

Key Insights
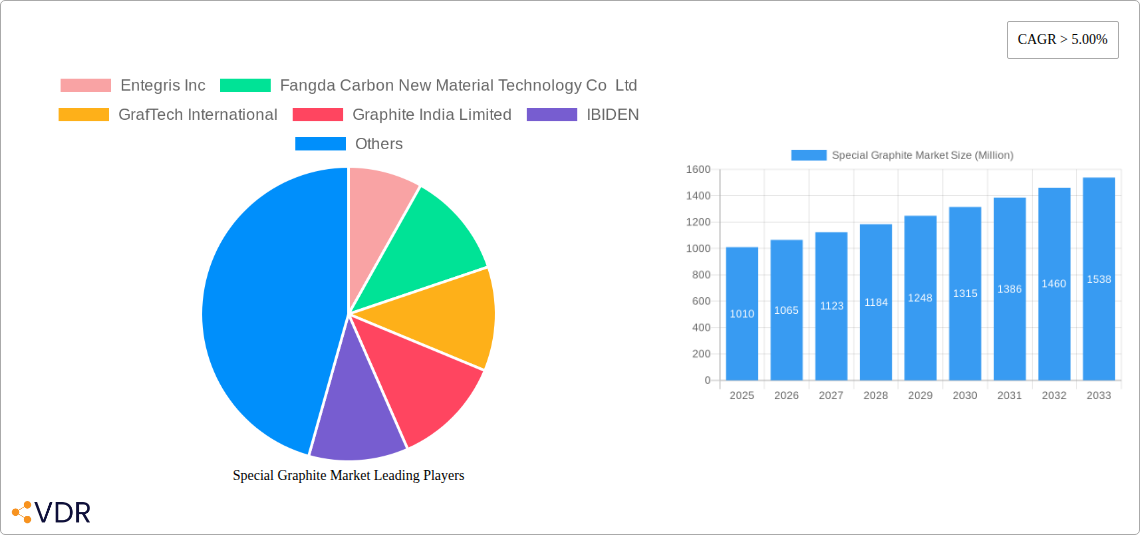
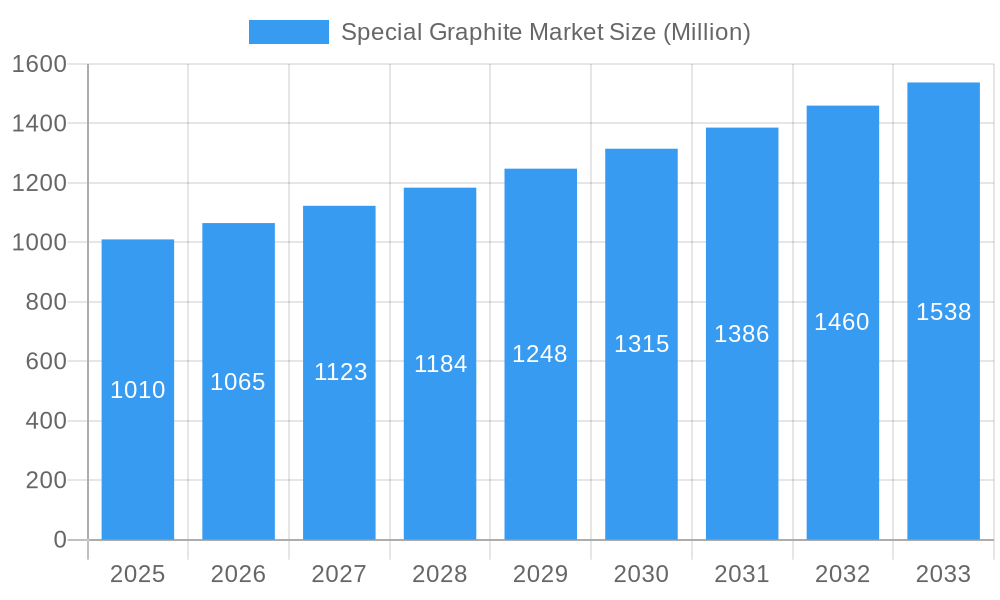
The global special graphite market, valued at $1.01 billion in 2025, is projected to experience robust growth, exceeding a 5% compound annual growth rate (CAGR) from 2025 to 2033. This expansion is fueled by several key drivers. The increasing demand for high-performance materials in diverse sectors such as electronics, energy storage, and aerospace is a significant factor. The rising adoption of electric vehicles (EVs) and renewable energy technologies further boosts demand for special graphite, particularly in battery applications and solar panels. Furthermore, advancements in graphite processing and purification technologies are leading to the development of higher-quality, more specialized graphite products catering to evolving industry needs. While challenges exist, such as price volatility of raw materials and the environmental impact of graphite mining and processing, ongoing research and development efforts, along with increasing sustainability initiatives within the industry, are expected to mitigate these concerns and support continued market expansion.
Special Graphite Market Market Size (In Billion)
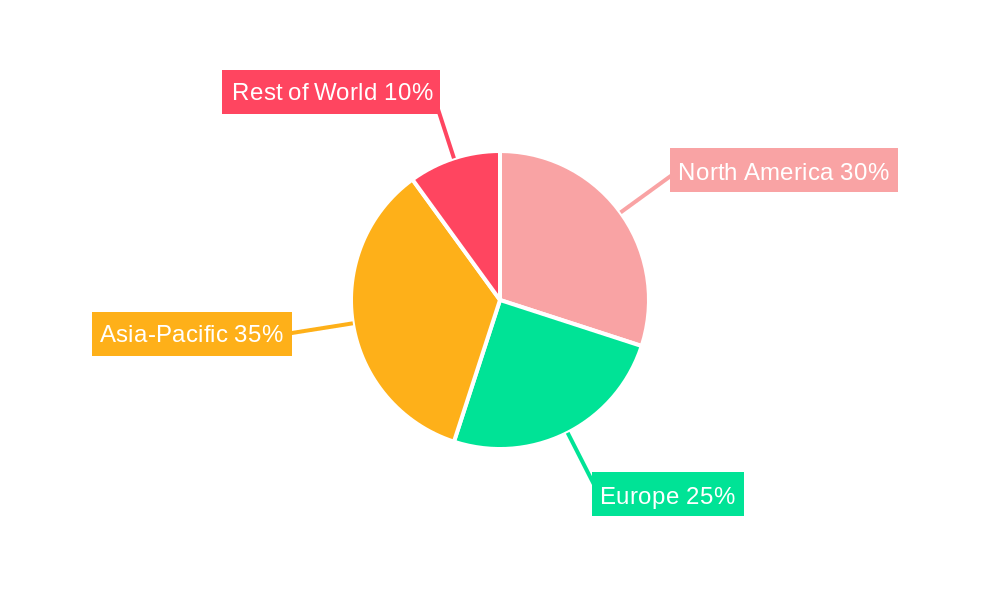
The market is segmented by various types of special graphite, applications, and geographical regions. While specific segment breakdowns are not provided, the major players in this competitive landscape include Entegris Inc., Fangda Carbon, GrafTech International, Graphite India, IBIDEN, Mersen SA, Morgan Advanced Materials, Nippon Carbon, and others. The competitive landscape is marked by both established global players and regional manufacturers. These companies are actively engaged in strategic collaborations, mergers and acquisitions, and technological innovations to maintain their market share and cater to the growing demand. Geographic distribution likely reflects established manufacturing hubs and key consumption markets, with regions like North America, Europe, and Asia-Pacific anticipated to be significant contributors to overall market growth, driven by the concentration of manufacturing and technological advancements in these areas. The forecast period, 2025-2033, anticipates sustained growth driven by the continuous evolution of technologies reliant on high-performance graphite materials.
Special Graphite Market Company Market Share
Special Graphite Market: A Comprehensive Report (2019-2033)
This in-depth report provides a comprehensive analysis of the Special Graphite Market, encompassing market dynamics, growth trends, regional analysis, product landscape, key players, and future outlook. The study period covers 2019-2033, with 2025 as the base and estimated year. The report segments the market into [Insert Specific Market Segments Here - e.g., by type, application, end-use industry], providing a granular view of this crucial sector within the broader Graphite Market. The report is essential for industry professionals, investors, and strategic decision-makers seeking to navigate this dynamic market. Market value is presented in Million units.
Projected Market Size (Million Units):
- 2025 (Estimated): xx
- 2033 (Forecast): xx
Special Graphite Market Dynamics & Structure
The Special Graphite market exhibits a [High/Medium/Low] level of concentration, with key players holding [xx]% of the market share. Technological innovation, particularly in [Specific areas of technological advancements, e.g., high-temperature applications, improved purity], is a crucial driver, alongside stringent regulatory frameworks concerning [Specific regulations, e.g., environmental compliance, material safety]. Competitive substitutes include [List Specific Substitutes, e.g., alternative materials in specific applications], though the unique properties of special graphite often provide a competitive edge. End-user demographics are diverse, spanning [List Major End-Use Industries, e.g., aerospace, electronics, energy]. M&A activity in the sector has seen [xx] deals in the past five years, indicating [High/Medium/Low] consolidation.
- Market Concentration: [xx]% held by top 5 players
- Technological Innovation Drivers: High-purity graphite, improved thermal conductivity, enhanced mechanical strength
- Regulatory Landscape: Environmental regulations, safety standards (specific examples)
- Competitive Substitutes: [List with impact assessment, e.g., ceramics, advanced polymers]
- End-User Demographics: Aerospace, Automotive, Electronics, Energy (Market Share Breakdown for each if available)
- M&A Activity: [xx] deals in the past 5 years, indicating [Trend - e.g., increasing consolidation]
Special Graphite Market Growth Trends & Insights
The Special Graphite market is experiencing robust expansion, projected to grow at a Compound Annual Growth Rate (CAGR) of approximately [Insert Projected CAGR]% from 2025 to 2033, building upon a significant historical growth rate of [Specific historical growth rate]% between 2019 and 2024. This upward trajectory is primarily propelled by the escalating demand from the burgeoning electronics industry, the rapid advancements in renewable energy technologies such as solar and battery storage, and substantial government investments in critical infrastructure and technological development. Innovations like the development of novel graphite grades with enhanced properties and sophisticated, eco-friendly manufacturing techniques are significantly accelerating adoption across a wide spectrum of industries. Furthermore, a pronounced shift in consumer and industrial preferences towards sustainable materials and high-performance products is a key contributor to this positive market outlook. The market penetration rate for special graphite is anticipated to reach an impressive [Insert Market Penetration Rate]% by the year 2033.
Dominant Regions, Countries, or Segments in Special Graphite Market
Currently, the Asia Pacific region stands as the undisputed leader in the special graphite market, commanding an estimated [Insert Asia Pacific Market Share]% of the global market share in 2025. This preeminence is underpinned by several compelling factors:
- Robust Economic Expansion: Driven by substantial industrial output, particularly from manufacturing powerhouses like China, and significant growth in renewable energy investments across nations such as India.
- Supportive Government Frameworks: The implementation of favorable government policies, including substantial subsidies for renewable energy projects and extensive investments in modern infrastructure development, further bolsters market growth.
- Well-Established Industrial Ecosystem: The region benefits from a mature manufacturing base, exemplified by the presence of major global graphite producers in China and a readily available skilled workforce adept at specialized graphite production.
- Sustained Demand from Core Sectors: High and consistent demand from critical industries, including the electronics manufacturing sector in East Asia and the rapidly expanding automotive production in select regional economies, fuels market dominance.
Other significant regions contributing to the global special graphite market include [List other significant regions/countries with market share and growth rate if available, e.g., North America (XX% market share, YY% CAGR), Europe (XX% market share, YY% CAGR)].
Special Graphite Market Product Landscape
Special graphite products are characterized by their unique properties, enabling diverse applications. Recent innovations focus on improving [Key properties, e.g., thermal conductivity, purity, strength], leading to enhanced performance in applications such as [Specific applications, e.g., semiconductor manufacturing, high-temperature furnaces, aerospace components]. Unique selling propositions include [USP list, e.g., high-purity grades for electronics, customized shapes and sizes, superior thermal shock resistance]. Technological advancements are driven by [Advancement list, e.g., advanced manufacturing processes, materials science breakthroughs].
Key Drivers, Barriers & Challenges in Special Graphite Market
Key Growth Drivers:
- The ever-increasing demand for high-purity graphite in the advanced electronics industry, vital for components in semiconductors and displays.
- The substantial growth within the renewable energy sector, which is creating a significant demand for specialized graphite components essential for the efficient operation of solar cells and advanced battery technologies.
- Proactive government initiatives, coupled with substantial investments in large-scale infrastructure projects worldwide, are generating consistent demand for versatile and high-performance special graphite materials.
Key Challenges & Restraints:
- The inherent volatility in raw material prices, which can lead to unpredictable fluctuations in production costs and affect profitability margins.
- The increasing stringency of environmental regulations and the imperative to adhere to rigorous safety standards, necessitating substantial investment in compliance and sustainable practices.
- Intense market competition from both emerging alternative materials that offer similar or enhanced properties, and from established, large-scale players within the graphite industry itself.
Emerging Opportunities in Special Graphite Market
Emerging opportunities lie in:
- The expansion of electric vehicles and energy storage solutions, driving increased demand for advanced graphite materials.
- The development of new applications in the aerospace and defense industries.
- Exploring innovative manufacturing processes to reduce production costs and improve material properties.
Growth Accelerators in the Special Graphite Market Industry
Technological breakthroughs in materials science, particularly the development of novel graphite grades with enhanced properties, are key growth accelerators. Strategic partnerships between graphite producers and end-users are also fostering innovation and expanding market reach. Aggressive market expansion strategies into high-growth regions and diversification into new applications further contribute to accelerating market growth.
Key Players Shaping the Special Graphite Market Market
- Entegris Inc
- Fangda Carbon New Material Technology Co Ltd
- GrafTech International
- Graphite India Limited
- IBIDEN
- Mersen SA
- Morgan Advanced Materials
- Nippon Carbon Co Ltd
- Pingdingshan City Kaiyuan specialty graphite Ltd
- Schunk Carbon Technology
- SEC CARBON LIMITED
- SGL Carbon
- Tokai Carbon Co Ltd
- Toyo Tanso Co Ltd
- Yichang Xincheng Graphite Co Ltd
Notable Milestones in Special Graphite Market Sector
- July 2023: Mersen inaugurated its new Columbia, USA site (240,000 sq meters), boosting extruded graphite production capacity by 4,000 tons/year and isostatic graphite by 2,000 tons/year. Planned expansion to 16,000 tons of isostatic graphite by end of 2024.
- June 2023: Ibiden Graphite Korea announced expansion of its artificial graphite plant in Gyeongsangbuk-do, South Korea.
In-Depth Special Graphite Market Market Outlook
The future of the Special Graphite market appears bright, driven by the convergence of technological advancements and increasing demand across diverse sectors. Continued innovation in graphite materials, coupled with strategic partnerships and expansion into new geographical markets, will unlock significant growth potential. Strategic opportunities exist for companies to leverage emerging technologies and cater to the growing demand for sustainable and high-performance materials. The market is poised for considerable expansion over the forecast period.
Special Graphite Market Segmentation
-
1. Product Type
- 1.1. Extruded Graphite
- 1.2. Isotropic Graphite
- 1.3. Molded Graphite
-
2. End-user Industry
- 2.1. Electronics Industry
- 2.2. Photovoltaic Industry
- 2.3. Foundry and Metallurgy Industry
- 2.4. Other En
Special Graphite Market Segmentation By Geography
-
1. Asia Pacific
- 1.1. China
- 1.2. India
- 1.3. Japan
- 1.4. South Korea
- 1.5. Rest of Asia Pacific
-
2. North America
- 2.1. United States
- 2.2. Canada
- 2.3. Mexico
-
3. Europe
- 3.1. Germany
- 3.2. United Kingdom
- 3.3. France
- 3.4. Italy
- 3.5. Rest of Europe
-
4. South America
- 4.1. Brazil
- 4.2. Argentina
- 4.3. Rest of South America
-
5. Middle East and Africa
- 5.1. Saudi Arabia
- 5.2. South Africa
- 5.3. Rest of Middle East and Africa
Special Graphite Market Regional Market Share
Geographic Coverage of Special Graphite Market
Special Graphite Market REPORT HIGHLIGHTS
| Aspects | Details |
|---|---|
| Study Period | 2020-2034 |
| Base Year | 2025 |
| Estimated Year | 2026 |
| Forecast Period | 2026-2034 |
| Historical Period | 2020-2025 |
| Growth Rate | CAGR of > 5.00% from 2020-2034 |
| Segmentation |
|
Table of Contents
- 1. Introduction
- 1.1. Research Scope
- 1.2. Market Segmentation
- 1.3. Research Objective
- 1.4. Definitions and Assumptions
- 2. Executive Summary
- 2.1. Market Snapshot
- 3. Market Dynamics
- 3.1. Market Drivers
- 3.2. Market Restrains
- 3.3. Market Trends
- 3.4. Market Opportunities
- 4. Market Factor Analysis
- 4.1. Porters Five Forces
- 4.1.1. Bargaining Power of Suppliers
- 4.1.2. Bargaining Power of Buyers
- 4.1.3. Threat of New Entrants
- 4.1.4. Threat of Substitutes
- 4.1.5. Competitive Rivalry
- 4.2. PESTEL analysis
- 4.3. BCG Analysis
- 4.3.1. Stars (High Growth, High Market Share)
- 4.3.2. Cash Cows (Low Growth, High Market Share)
- 4.3.3. Question Mark (High Growth, Low Market Share)
- 4.3.4. Dogs (Low Growth, Low Market Share)
- 4.4. Ansoff Matrix Analysis
- 4.5. Supply Chain Analysis
- 4.6. Regulatory Landscape
- 4.7. Current Market Potential and Opportunity Assessment (TAM–SAM–SOM Framework)
- 4.8. VDR Analyst Note
- 4.1. Porters Five Forces
- 5. Market Analysis, Insights and Forecast 2021-2033
- 5.1. Market Analysis, Insights and Forecast - by Product Type
- 5.1.1. Extruded Graphite
- 5.1.2. Isotropic Graphite
- 5.1.3. Molded Graphite
- 5.2. Market Analysis, Insights and Forecast - by End-user Industry
- 5.2.1. Electronics Industry
- 5.2.2. Photovoltaic Industry
- 5.2.3. Foundry and Metallurgy Industry
- 5.2.4. Other En
- 5.3. Market Analysis, Insights and Forecast - by Region
- 5.3.1. Asia Pacific
- 5.3.2. North America
- 5.3.3. Europe
- 5.3.4. South America
- 5.3.5. Middle East and Africa
- 5.1. Market Analysis, Insights and Forecast - by Product Type
- 6. Global Special Graphite Market Analysis, Insights and Forecast, 2021-2033
- 6.1. Market Analysis, Insights and Forecast - by Product Type
- 6.1.1. Extruded Graphite
- 6.1.2. Isotropic Graphite
- 6.1.3. Molded Graphite
- 6.2. Market Analysis, Insights and Forecast - by End-user Industry
- 6.2.1. Electronics Industry
- 6.2.2. Photovoltaic Industry
- 6.2.3. Foundry and Metallurgy Industry
- 6.2.4. Other En
- 6.1. Market Analysis, Insights and Forecast - by Product Type
- 7. Asia Pacific Special Graphite Market Analysis, Insights and Forecast, 2021-2033
- 7.1. Market Analysis, Insights and Forecast - by Product Type
- 7.1.1. Extruded Graphite
- 7.1.2. Isotropic Graphite
- 7.1.3. Molded Graphite
- 7.2. Market Analysis, Insights and Forecast - by End-user Industry
- 7.2.1. Electronics Industry
- 7.2.2. Photovoltaic Industry
- 7.2.3. Foundry and Metallurgy Industry
- 7.2.4. Other En
- 7.1. Market Analysis, Insights and Forecast - by Product Type
- 8. North America Special Graphite Market Analysis, Insights and Forecast, 2021-2033
- 8.1. Market Analysis, Insights and Forecast - by Product Type
- 8.1.1. Extruded Graphite
- 8.1.2. Isotropic Graphite
- 8.1.3. Molded Graphite
- 8.2. Market Analysis, Insights and Forecast - by End-user Industry
- 8.2.1. Electronics Industry
- 8.2.2. Photovoltaic Industry
- 8.2.3. Foundry and Metallurgy Industry
- 8.2.4. Other En
- 8.1. Market Analysis, Insights and Forecast - by Product Type
- 9. Europe Special Graphite Market Analysis, Insights and Forecast, 2021-2033
- 9.1. Market Analysis, Insights and Forecast - by Product Type
- 9.1.1. Extruded Graphite
- 9.1.2. Isotropic Graphite
- 9.1.3. Molded Graphite
- 9.2. Market Analysis, Insights and Forecast - by End-user Industry
- 9.2.1. Electronics Industry
- 9.2.2. Photovoltaic Industry
- 9.2.3. Foundry and Metallurgy Industry
- 9.2.4. Other En
- 9.1. Market Analysis, Insights and Forecast - by Product Type
- 10. South America Special Graphite Market Analysis, Insights and Forecast, 2021-2033
- 10.1. Market Analysis, Insights and Forecast - by Product Type
- 10.1.1. Extruded Graphite
- 10.1.2. Isotropic Graphite
- 10.1.3. Molded Graphite
- 10.2. Market Analysis, Insights and Forecast - by End-user Industry
- 10.2.1. Electronics Industry
- 10.2.2. Photovoltaic Industry
- 10.2.3. Foundry and Metallurgy Industry
- 10.2.4. Other En
- 10.1. Market Analysis, Insights and Forecast - by Product Type
- 11. Middle East and Africa Special Graphite Market Analysis, Insights and Forecast, 2021-2033
- 11.1. Market Analysis, Insights and Forecast - by Product Type
- 11.1.1. Extruded Graphite
- 11.1.2. Isotropic Graphite
- 11.1.3. Molded Graphite
- 11.2. Market Analysis, Insights and Forecast - by End-user Industry
- 11.2.1. Electronics Industry
- 11.2.2. Photovoltaic Industry
- 11.2.3. Foundry and Metallurgy Industry
- 11.2.4. Other En
- 11.1. Market Analysis, Insights and Forecast - by Product Type
- 12. Competitive Analysis
- 12.1. Company Profiles
- 12.1.1 Entegris Inc
- 12.1.1.1. Company Overview
- 12.1.1.2. Products
- 12.1.1.3. Company Financials
- 12.1.1.4. SWOT Analysis
- 12.1.2 Fangda Carbon New Material Technology Co Ltd
- 12.1.2.1. Company Overview
- 12.1.2.2. Products
- 12.1.2.3. Company Financials
- 12.1.2.4. SWOT Analysis
- 12.1.3 GrafTech International
- 12.1.3.1. Company Overview
- 12.1.3.2. Products
- 12.1.3.3. Company Financials
- 12.1.3.4. SWOT Analysis
- 12.1.4 Graphite India Limited
- 12.1.4.1. Company Overview
- 12.1.4.2. Products
- 12.1.4.3. Company Financials
- 12.1.4.4. SWOT Analysis
- 12.1.5 IBIDEN
- 12.1.5.1. Company Overview
- 12.1.5.2. Products
- 12.1.5.3. Company Financials
- 12.1.5.4. SWOT Analysis
- 12.1.6 Mersen SA
- 12.1.6.1. Company Overview
- 12.1.6.2. Products
- 12.1.6.3. Company Financials
- 12.1.6.4. SWOT Analysis
- 12.1.7 Morgan Advanced Materials
- 12.1.7.1. Company Overview
- 12.1.7.2. Products
- 12.1.7.3. Company Financials
- 12.1.7.4. SWOT Analysis
- 12.1.8 Nippon Carbon Co Ltd
- 12.1.8.1. Company Overview
- 12.1.8.2. Products
- 12.1.8.3. Company Financials
- 12.1.8.4. SWOT Analysis
- 12.1.9 Pingdingshan City Kaiyuan specialty graphite Ltd
- 12.1.9.1. Company Overview
- 12.1.9.2. Products
- 12.1.9.3. Company Financials
- 12.1.9.4. SWOT Analysis
- 12.1.10 Schunk Carbon Technology
- 12.1.10.1. Company Overview
- 12.1.10.2. Products
- 12.1.10.3. Company Financials
- 12.1.10.4. SWOT Analysis
- 12.1.11 SEC CARBON LIMITED
- 12.1.11.1. Company Overview
- 12.1.11.2. Products
- 12.1.11.3. Company Financials
- 12.1.11.4. SWOT Analysis
- 12.1.12 SGL Carbon
- 12.1.12.1. Company Overview
- 12.1.12.2. Products
- 12.1.12.3. Company Financials
- 12.1.12.4. SWOT Analysis
- 12.1.13 Tokai Carbon Co Ltd
- 12.1.13.1. Company Overview
- 12.1.13.2. Products
- 12.1.13.3. Company Financials
- 12.1.13.4. SWOT Analysis
- 12.1.14 Toyo Tanso Co Ltd
- 12.1.14.1. Company Overview
- 12.1.14.2. Products
- 12.1.14.3. Company Financials
- 12.1.14.4. SWOT Analysis
- 12.1.15 Yichang Xincheng Graphite Co Ltd *List Not Exhaustive
- 12.1.15.1. Company Overview
- 12.1.15.2. Products
- 12.1.15.3. Company Financials
- 12.1.15.4. SWOT Analysis
- 12.1.1 Entegris Inc
- 12.2. Market Entropy
- 12.2.1 Company's Key Areas Served
- 12.2.2 Recent Developments
- 12.3. Company Market Share Analysis 2025
- 12.3.1 Top 5 Companies Market Share Analysis
- 12.3.2 Top 3 Companies Market Share Analysis
- 12.4. List of Potential Customers
- 13. Research Methodology
List of Figures
- Figure 1: Global Special Graphite Market Revenue Breakdown (Million, %) by Region 2025 & 2033
- Figure 2: Global Special Graphite Market Volume Breakdown (Billion, %) by Region 2025 & 2033
- Figure 3: Asia Pacific Special Graphite Market Revenue (Million), by Product Type 2025 & 2033
- Figure 4: Asia Pacific Special Graphite Market Volume (Billion), by Product Type 2025 & 2033
- Figure 5: Asia Pacific Special Graphite Market Revenue Share (%), by Product Type 2025 & 2033
- Figure 6: Asia Pacific Special Graphite Market Volume Share (%), by Product Type 2025 & 2033
- Figure 7: Asia Pacific Special Graphite Market Revenue (Million), by End-user Industry 2025 & 2033
- Figure 8: Asia Pacific Special Graphite Market Volume (Billion), by End-user Industry 2025 & 2033
- Figure 9: Asia Pacific Special Graphite Market Revenue Share (%), by End-user Industry 2025 & 2033
- Figure 10: Asia Pacific Special Graphite Market Volume Share (%), by End-user Industry 2025 & 2033
- Figure 11: Asia Pacific Special Graphite Market Revenue (Million), by Country 2025 & 2033
- Figure 12: Asia Pacific Special Graphite Market Volume (Billion), by Country 2025 & 2033
- Figure 13: Asia Pacific Special Graphite Market Revenue Share (%), by Country 2025 & 2033
- Figure 14: Asia Pacific Special Graphite Market Volume Share (%), by Country 2025 & 2033
- Figure 15: North America Special Graphite Market Revenue (Million), by Product Type 2025 & 2033
- Figure 16: North America Special Graphite Market Volume (Billion), by Product Type 2025 & 2033
- Figure 17: North America Special Graphite Market Revenue Share (%), by Product Type 2025 & 2033
- Figure 18: North America Special Graphite Market Volume Share (%), by Product Type 2025 & 2033
- Figure 19: North America Special Graphite Market Revenue (Million), by End-user Industry 2025 & 2033
- Figure 20: North America Special Graphite Market Volume (Billion), by End-user Industry 2025 & 2033
- Figure 21: North America Special Graphite Market Revenue Share (%), by End-user Industry 2025 & 2033
- Figure 22: North America Special Graphite Market Volume Share (%), by End-user Industry 2025 & 2033
- Figure 23: North America Special Graphite Market Revenue (Million), by Country 2025 & 2033
- Figure 24: North America Special Graphite Market Volume (Billion), by Country 2025 & 2033
- Figure 25: North America Special Graphite Market Revenue Share (%), by Country 2025 & 2033
- Figure 26: North America Special Graphite Market Volume Share (%), by Country 2025 & 2033
- Figure 27: Europe Special Graphite Market Revenue (Million), by Product Type 2025 & 2033
- Figure 28: Europe Special Graphite Market Volume (Billion), by Product Type 2025 & 2033
- Figure 29: Europe Special Graphite Market Revenue Share (%), by Product Type 2025 & 2033
- Figure 30: Europe Special Graphite Market Volume Share (%), by Product Type 2025 & 2033
- Figure 31: Europe Special Graphite Market Revenue (Million), by End-user Industry 2025 & 2033
- Figure 32: Europe Special Graphite Market Volume (Billion), by End-user Industry 2025 & 2033
- Figure 33: Europe Special Graphite Market Revenue Share (%), by End-user Industry 2025 & 2033
- Figure 34: Europe Special Graphite Market Volume Share (%), by End-user Industry 2025 & 2033
- Figure 35: Europe Special Graphite Market Revenue (Million), by Country 2025 & 2033
- Figure 36: Europe Special Graphite Market Volume (Billion), by Country 2025 & 2033
- Figure 37: Europe Special Graphite Market Revenue Share (%), by Country 2025 & 2033
- Figure 38: Europe Special Graphite Market Volume Share (%), by Country 2025 & 2033
- Figure 39: South America Special Graphite Market Revenue (Million), by Product Type 2025 & 2033
- Figure 40: South America Special Graphite Market Volume (Billion), by Product Type 2025 & 2033
- Figure 41: South America Special Graphite Market Revenue Share (%), by Product Type 2025 & 2033
- Figure 42: South America Special Graphite Market Volume Share (%), by Product Type 2025 & 2033
- Figure 43: South America Special Graphite Market Revenue (Million), by End-user Industry 2025 & 2033
- Figure 44: South America Special Graphite Market Volume (Billion), by End-user Industry 2025 & 2033
- Figure 45: South America Special Graphite Market Revenue Share (%), by End-user Industry 2025 & 2033
- Figure 46: South America Special Graphite Market Volume Share (%), by End-user Industry 2025 & 2033
- Figure 47: South America Special Graphite Market Revenue (Million), by Country 2025 & 2033
- Figure 48: South America Special Graphite Market Volume (Billion), by Country 2025 & 2033
- Figure 49: South America Special Graphite Market Revenue Share (%), by Country 2025 & 2033
- Figure 50: South America Special Graphite Market Volume Share (%), by Country 2025 & 2033
- Figure 51: Middle East and Africa Special Graphite Market Revenue (Million), by Product Type 2025 & 2033
- Figure 52: Middle East and Africa Special Graphite Market Volume (Billion), by Product Type 2025 & 2033
- Figure 53: Middle East and Africa Special Graphite Market Revenue Share (%), by Product Type 2025 & 2033
- Figure 54: Middle East and Africa Special Graphite Market Volume Share (%), by Product Type 2025 & 2033
- Figure 55: Middle East and Africa Special Graphite Market Revenue (Million), by End-user Industry 2025 & 2033
- Figure 56: Middle East and Africa Special Graphite Market Volume (Billion), by End-user Industry 2025 & 2033
- Figure 57: Middle East and Africa Special Graphite Market Revenue Share (%), by End-user Industry 2025 & 2033
- Figure 58: Middle East and Africa Special Graphite Market Volume Share (%), by End-user Industry 2025 & 2033
- Figure 59: Middle East and Africa Special Graphite Market Revenue (Million), by Country 2025 & 2033
- Figure 60: Middle East and Africa Special Graphite Market Volume (Billion), by Country 2025 & 2033
- Figure 61: Middle East and Africa Special Graphite Market Revenue Share (%), by Country 2025 & 2033
- Figure 62: Middle East and Africa Special Graphite Market Volume Share (%), by Country 2025 & 2033
List of Tables
- Table 1: Global Special Graphite Market Revenue Million Forecast, by Product Type 2020 & 2033
- Table 2: Global Special Graphite Market Volume Billion Forecast, by Product Type 2020 & 2033
- Table 3: Global Special Graphite Market Revenue Million Forecast, by End-user Industry 2020 & 2033
- Table 4: Global Special Graphite Market Volume Billion Forecast, by End-user Industry 2020 & 2033
- Table 5: Global Special Graphite Market Revenue Million Forecast, by Region 2020 & 2033
- Table 6: Global Special Graphite Market Volume Billion Forecast, by Region 2020 & 2033
- Table 7: Global Special Graphite Market Revenue Million Forecast, by Product Type 2020 & 2033
- Table 8: Global Special Graphite Market Volume Billion Forecast, by Product Type 2020 & 2033
- Table 9: Global Special Graphite Market Revenue Million Forecast, by End-user Industry 2020 & 2033
- Table 10: Global Special Graphite Market Volume Billion Forecast, by End-user Industry 2020 & 2033
- Table 11: Global Special Graphite Market Revenue Million Forecast, by Country 2020 & 2033
- Table 12: Global Special Graphite Market Volume Billion Forecast, by Country 2020 & 2033
- Table 13: China Special Graphite Market Revenue (Million) Forecast, by Application 2020 & 2033
- Table 14: China Special Graphite Market Volume (Billion) Forecast, by Application 2020 & 2033
- Table 15: India Special Graphite Market Revenue (Million) Forecast, by Application 2020 & 2033
- Table 16: India Special Graphite Market Volume (Billion) Forecast, by Application 2020 & 2033
- Table 17: Japan Special Graphite Market Revenue (Million) Forecast, by Application 2020 & 2033
- Table 18: Japan Special Graphite Market Volume (Billion) Forecast, by Application 2020 & 2033
- Table 19: South Korea Special Graphite Market Revenue (Million) Forecast, by Application 2020 & 2033
- Table 20: South Korea Special Graphite Market Volume (Billion) Forecast, by Application 2020 & 2033
- Table 21: Rest of Asia Pacific Special Graphite Market Revenue (Million) Forecast, by Application 2020 & 2033
- Table 22: Rest of Asia Pacific Special Graphite Market Volume (Billion) Forecast, by Application 2020 & 2033
- Table 23: Global Special Graphite Market Revenue Million Forecast, by Product Type 2020 & 2033
- Table 24: Global Special Graphite Market Volume Billion Forecast, by Product Type 2020 & 2033
- Table 25: Global Special Graphite Market Revenue Million Forecast, by End-user Industry 2020 & 2033
- Table 26: Global Special Graphite Market Volume Billion Forecast, by End-user Industry 2020 & 2033
- Table 27: Global Special Graphite Market Revenue Million Forecast, by Country 2020 & 2033
- Table 28: Global Special Graphite Market Volume Billion Forecast, by Country 2020 & 2033
- Table 29: United States Special Graphite Market Revenue (Million) Forecast, by Application 2020 & 2033
- Table 30: United States Special Graphite Market Volume (Billion) Forecast, by Application 2020 & 2033
- Table 31: Canada Special Graphite Market Revenue (Million) Forecast, by Application 2020 & 2033
- Table 32: Canada Special Graphite Market Volume (Billion) Forecast, by Application 2020 & 2033
- Table 33: Mexico Special Graphite Market Revenue (Million) Forecast, by Application 2020 & 2033
- Table 34: Mexico Special Graphite Market Volume (Billion) Forecast, by Application 2020 & 2033
- Table 35: Global Special Graphite Market Revenue Million Forecast, by Product Type 2020 & 2033
- Table 36: Global Special Graphite Market Volume Billion Forecast, by Product Type 2020 & 2033
- Table 37: Global Special Graphite Market Revenue Million Forecast, by End-user Industry 2020 & 2033
- Table 38: Global Special Graphite Market Volume Billion Forecast, by End-user Industry 2020 & 2033
- Table 39: Global Special Graphite Market Revenue Million Forecast, by Country 2020 & 2033
- Table 40: Global Special Graphite Market Volume Billion Forecast, by Country 2020 & 2033
- Table 41: Germany Special Graphite Market Revenue (Million) Forecast, by Application 2020 & 2033
- Table 42: Germany Special Graphite Market Volume (Billion) Forecast, by Application 2020 & 2033
- Table 43: United Kingdom Special Graphite Market Revenue (Million) Forecast, by Application 2020 & 2033
- Table 44: United Kingdom Special Graphite Market Volume (Billion) Forecast, by Application 2020 & 2033
- Table 45: France Special Graphite Market Revenue (Million) Forecast, by Application 2020 & 2033
- Table 46: France Special Graphite Market Volume (Billion) Forecast, by Application 2020 & 2033
- Table 47: Italy Special Graphite Market Revenue (Million) Forecast, by Application 2020 & 2033
- Table 48: Italy Special Graphite Market Volume (Billion) Forecast, by Application 2020 & 2033
- Table 49: Rest of Europe Special Graphite Market Revenue (Million) Forecast, by Application 2020 & 2033
- Table 50: Rest of Europe Special Graphite Market Volume (Billion) Forecast, by Application 2020 & 2033
- Table 51: Global Special Graphite Market Revenue Million Forecast, by Product Type 2020 & 2033
- Table 52: Global Special Graphite Market Volume Billion Forecast, by Product Type 2020 & 2033
- Table 53: Global Special Graphite Market Revenue Million Forecast, by End-user Industry 2020 & 2033
- Table 54: Global Special Graphite Market Volume Billion Forecast, by End-user Industry 2020 & 2033
- Table 55: Global Special Graphite Market Revenue Million Forecast, by Country 2020 & 2033
- Table 56: Global Special Graphite Market Volume Billion Forecast, by Country 2020 & 2033
- Table 57: Brazil Special Graphite Market Revenue (Million) Forecast, by Application 2020 & 2033
- Table 58: Brazil Special Graphite Market Volume (Billion) Forecast, by Application 2020 & 2033
- Table 59: Argentina Special Graphite Market Revenue (Million) Forecast, by Application 2020 & 2033
- Table 60: Argentina Special Graphite Market Volume (Billion) Forecast, by Application 2020 & 2033
- Table 61: Rest of South America Special Graphite Market Revenue (Million) Forecast, by Application 2020 & 2033
- Table 62: Rest of South America Special Graphite Market Volume (Billion) Forecast, by Application 2020 & 2033
- Table 63: Global Special Graphite Market Revenue Million Forecast, by Product Type 2020 & 2033
- Table 64: Global Special Graphite Market Volume Billion Forecast, by Product Type 2020 & 2033
- Table 65: Global Special Graphite Market Revenue Million Forecast, by End-user Industry 2020 & 2033
- Table 66: Global Special Graphite Market Volume Billion Forecast, by End-user Industry 2020 & 2033
- Table 67: Global Special Graphite Market Revenue Million Forecast, by Country 2020 & 2033
- Table 68: Global Special Graphite Market Volume Billion Forecast, by Country 2020 & 2033
- Table 69: Saudi Arabia Special Graphite Market Revenue (Million) Forecast, by Application 2020 & 2033
- Table 70: Saudi Arabia Special Graphite Market Volume (Billion) Forecast, by Application 2020 & 2033
- Table 71: South Africa Special Graphite Market Revenue (Million) Forecast, by Application 2020 & 2033
- Table 72: South Africa Special Graphite Market Volume (Billion) Forecast, by Application 2020 & 2033
- Table 73: Rest of Middle East and Africa Special Graphite Market Revenue (Million) Forecast, by Application 2020 & 2033
- Table 74: Rest of Middle East and Africa Special Graphite Market Volume (Billion) Forecast, by Application 2020 & 2033
Frequently Asked Questions
1. What is the projected Compound Annual Growth Rate (CAGR) of the Special Graphite Market?
The projected CAGR is approximately > 5.00%.
2. Which companies are prominent players in the Special Graphite Market?
Key companies in the market include Entegris Inc, Fangda Carbon New Material Technology Co Ltd, GrafTech International, Graphite India Limited, IBIDEN, Mersen SA, Morgan Advanced Materials, Nippon Carbon Co Ltd, Pingdingshan City Kaiyuan specialty graphite Ltd, Schunk Carbon Technology, SEC CARBON LIMITED, SGL Carbon, Tokai Carbon Co Ltd, Toyo Tanso Co Ltd, Yichang Xincheng Graphite Co Ltd *List Not Exhaustive.
3. What are the main segments of the Special Graphite Market?
The market segments include Product Type, End-user Industry.
4. Can you provide details about the market size?
The market size is estimated to be USD 1.01 Million as of 2022.
5. What are some drivers contributing to market growth?
Increasing Government Policies for Solar Energy; Augmenting Demand from the Growing Lithium-ion Battery Industry; Increasing Demand for Expandable Graphite as a Flame Retardant Material.
6. What are the notable trends driving market growth?
Increasing Demand from the Electronics Industry.
7. Are there any restraints impacting market growth?
Increasing Government Policies for Solar Energy; Augmenting Demand from the Growing Lithium-ion Battery Industry; Increasing Demand for Expandable Graphite as a Flame Retardant Material.
8. Can you provide examples of recent developments in the market?
July 2023: Mersen inaugurated its Columbia site in the United States, spanning 240,000 square meters. The plant can produce 4,000 tons of extruded graphite and 2,000 tons of isostatic graphite per year. As part of its 2027 strategic plan, Mersen will further increase its global isostatic graphite manufacturing capacities to 16,000 tons by the end of 2024.
9. What pricing options are available for accessing the report?
Pricing options include single-user, multi-user, and enterprise licenses priced at USD 4750, USD 5250, and USD 8750 respectively.
10. Is the market size provided in terms of value or volume?
The market size is provided in terms of value, measured in Million and volume, measured in Billion.
11. Are there any specific market keywords associated with the report?
Yes, the market keyword associated with the report is "Special Graphite Market," which aids in identifying and referencing the specific market segment covered.
12. How do I determine which pricing option suits my needs best?
The pricing options vary based on user requirements and access needs. Individual users may opt for single-user licenses, while businesses requiring broader access may choose multi-user or enterprise licenses for cost-effective access to the report.
13. Are there any additional resources or data provided in the Special Graphite Market report?
While the report offers comprehensive insights, it's advisable to review the specific contents or supplementary materials provided to ascertain if additional resources or data are available.
14. How can I stay updated on further developments or reports in the Special Graphite Market?
To stay informed about further developments, trends, and reports in the Special Graphite Market, consider subscribing to industry newsletters, following relevant companies and organizations, or regularly checking reputable industry news sources and publications.
Methodology
Step 1 - Identification of Relevant Samples Size from Population Database


Step 2 - Approaches for Defining Global Market Size (Value, Volume* & Price*)

Note*: In applicable scenarios
Step 3 - Data Sources
Primary Research
- Web Analytics
- Survey Reports
- Research Institute
- Latest Research Reports
- Opinion Leaders
Secondary Research
- Annual Reports
- White Paper
- Latest Press Release
- Industry Association
- Paid Database
- Investor Presentations

Step 4 - Data Triangulation
Involves using different sources of information in order to increase the validity of a study
These sources are likely to be stakeholders in a program - participants, other researchers, program staff, other community members, and so on.
Then we put all data in single framework & apply various statistical tools to find out the dynamic on the market.
During the analysis stage, feedback from the stakeholder groups would be compared to determine areas of agreement as well as areas of divergence