
Key Insights
The South and Central America Oil Country Tubular Goods (OCTG) market presents a compelling investment opportunity, driven by sustained growth in oil and gas exploration and production activities across the region. While precise market sizing for South and Central America is not explicitly provided, we can infer substantial growth potential based on the global CAGR of >4.50% and regional trends. The significant investments in upstream oil and gas projects, particularly in countries like Brazil, Argentina, and Colombia, are key drivers. Increased demand for higher-grade OCTG, including API grade, is anticipated due to the exploration of deeper and more challenging oil and gas reservoirs. However, the market faces constraints including economic volatility in certain countries within the region and fluctuations in global oil prices, which can directly impact investment decisions. The seamless and electric resistance welded (ERW) segments will likely witness robust growth, mirroring global trends. Major international players such as Tenaris SA and Vallourec SA, alongside regional players, are actively competing for market share, indicating a dynamic market landscape. Further analysis of specific national markets within South and Central America, considering factors such as government regulations, infrastructure development, and exploration licenses, is crucial for a more precise market assessment.
The forecast period of 2025-2033 suggests continuous expansion, aligning with global projections for increased energy demand. The market segmentation by manufacturing process (seamless and ERW) and grade (premium and API) allows for a targeted approach by manufacturers. While challenges such as geopolitical instability and fluctuating commodity prices remain, the long-term outlook for the South and Central American OCTG market remains positive, particularly with a focus on sustainable energy infrastructure projects and increased domestic production to meet regional demand. Growth in specific countries will be impacted by government policies favoring domestic energy production and investments in refinery and pipeline infrastructure. The competitive landscape, with both international and regional players, underscores the necessity for effective strategies focusing on product innovation, operational efficiency, and strong distribution networks.
South and Central America OCTG Industry Market Report: 2019-2033
This comprehensive report provides an in-depth analysis of the South and Central America Oil Country Tubular Goods (OCTG) industry, covering market dynamics, growth trends, key players, and future outlook. The study period spans from 2019 to 2033, with 2025 serving as the base and estimated year. The report is essential for industry professionals, investors, and strategic decision-makers seeking to understand and capitalize on opportunities within this dynamic market. Key segments analyzed include seamless and electric resistance welded (ERW) OCTG, as well as premium and API grade products.
South and Central America OCTG Industry Market Dynamics & Structure
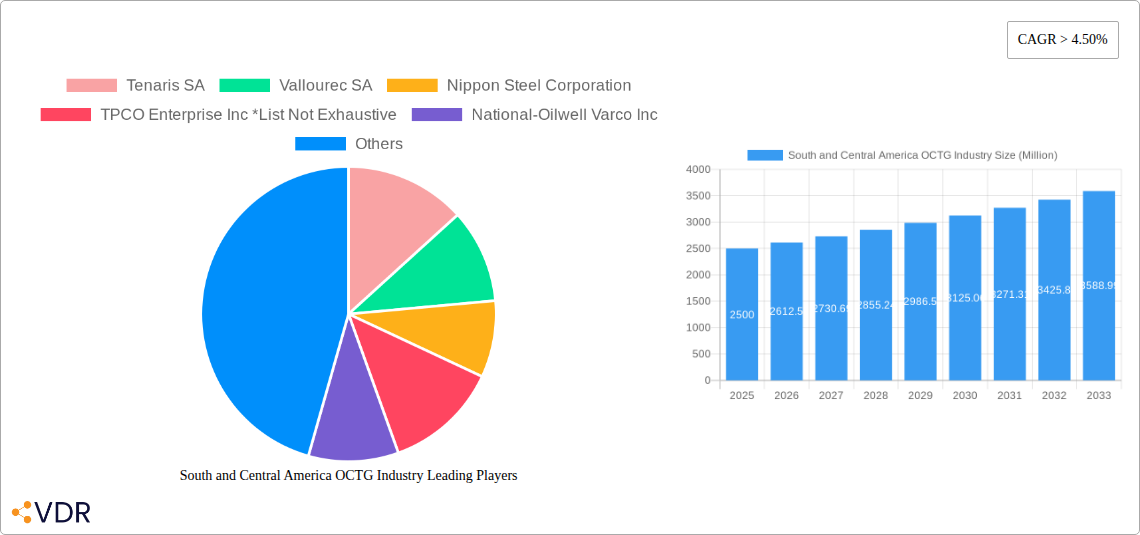
The South and Central America OCTG market is characterized by moderate concentration, with key players such as Tenaris SA, Vallourec SA, Nippon Steel Corporation, National-Oilwell Varco Inc, ArcelorMittal SA, and TPCO Enterprise Inc. holding significant market share. However, smaller regional players also contribute significantly to the overall market volume. Market share in 2025 is estimated as follows: Tenaris SA (30%), Vallourec SA (20%), others (50%).
- Market Concentration: Moderate, with a few dominant players and several smaller regional competitors.
- Technological Innovation: Driven by increasing demand for high-performance OCTG to withstand harsh operating conditions in deepwater and unconventional oil and gas extraction.
- Regulatory Framework: Varies across countries, impacting import/export activities and environmental regulations.
- Competitive Product Substitutes: Limited, with OCTG remaining the primary choice for well construction and completion.
- End-User Demographics: Primarily focused on national oil companies and international exploration & production companies.
- M&A Trends: Moderate activity observed in recent years, mainly focused on strengthening regional presence and access to resources. Estimated M&A deal volume between 2019-2024: xx Million USD.
South and Central America OCTG Industry Growth Trends & Insights
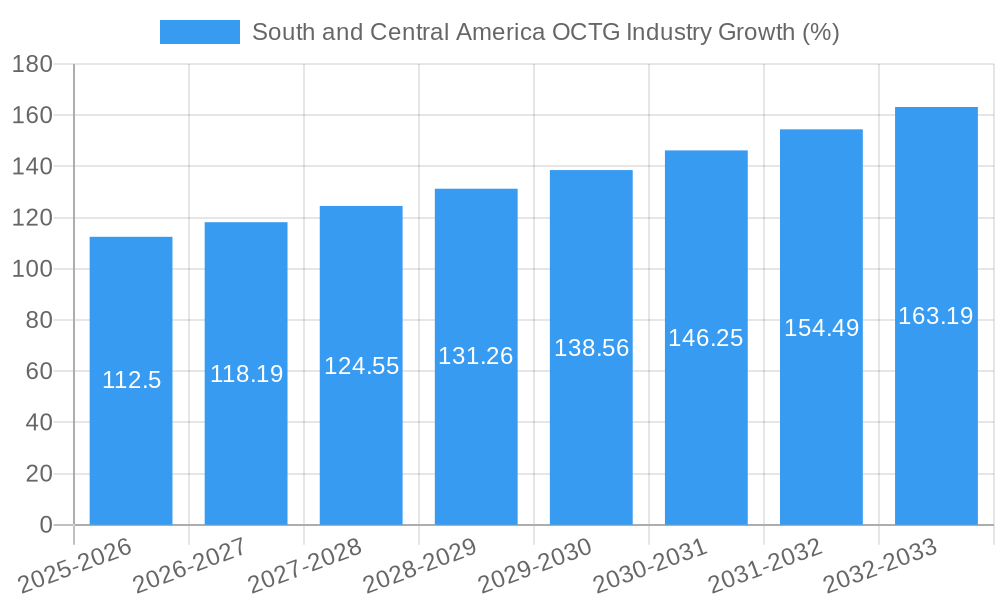
The South and Central America OCTG market experienced fluctuating growth during the historical period (2019-2024) primarily influenced by oil price volatility and exploration activity. However, from 2025 onwards, a steady growth trajectory is projected, driven by increasing investments in oil and gas infrastructure development and exploration activities in key regions across South and Central America. The market size in 2024 was approximately xx Million Units and is projected to reach xx Million Units by 2033, exhibiting a Compound Annual Growth Rate (CAGR) of xx% during the forecast period (2025-2033). This growth is fueled by increased demand from both onshore and offshore projects, as well as the growing adoption of advanced technologies in the oil and gas sector. Market penetration of premium grade OCTG is expected to increase significantly in the forecast period, driven by demand for superior performance and durability.
Dominant Regions, Countries, or Segments in South and Central America OCTG Industry
Brazil and Mexico are the dominant countries in the South and Central America OCTG market, representing xx% and xx% of the total market volume in 2025, respectively. The seamless segment holds a larger market share compared to ERW, primarily due to its superior performance characteristics in high-pressure and high-temperature applications. Premium grade OCTG is experiencing faster growth compared to API grade, reflecting the industry trend towards enhanced performance requirements.
- Key Drivers for Brazil: Strong domestic oil and gas production, ongoing exploration & production investments, and government support for energy sector development.
- Key Drivers for Mexico: Energy sector reforms, investments in deepwater exploration, and increased private sector participation.
- Seamless Segment Dominance: Driven by higher strength and durability compared to ERW products, particularly suitable for deepwater and high-pressure applications.
- Premium Grade Growth: Fueled by the demand for improved performance and longer lifespan in challenging well conditions.
South and Central America OCTG Industry Product Landscape
The South and Central America OCTG market offers a wide range of products, including seamless and ERW pipes in various diameters, grades, and specifications. Recent innovations focus on enhancing material strength, corrosion resistance, and wellbore stability. Premium grade OCTG, with enhanced metallurgical properties, is gaining traction due to its superior performance in demanding applications. Technological advancements, such as advanced coatings and improved manufacturing processes, contribute to enhanced product durability and performance.
Key Drivers, Barriers & Challenges in South and Central America OCTG Industry
Key Drivers: Increased oil and gas exploration and production activities, government initiatives to boost energy sector growth, and rising demand for high-performance OCTG products.
Key Challenges: Fluctuations in oil prices, potential supply chain disruptions, stringent environmental regulations, and intense competition among various OCTG suppliers. These challenges impact profitability margins and market stability.
Emerging Opportunities in South and Central America OCTG Industry
Emerging opportunities lie in the growing demand for advanced OCTG solutions tailored for unconventional resource extraction (e.g., shale gas), expansion into new regional markets, and the adoption of advanced materials and technologies such as carbon capture and storage (CCS) related applications for enhanced oil recovery. Furthermore, strategic partnerships between OCTG manufacturers and energy companies can unlock new growth avenues.
Growth Accelerators in the South and Central America OCTG Industry
Technological breakthroughs in materials science and manufacturing processes are key accelerators, allowing for the production of higher-performance, more cost-effective OCTG. Strategic partnerships between manufacturers and energy companies can enhance efficiency and collaboration throughout the supply chain. Moreover, market expansion into emerging regions and diversification of product offerings will contribute significantly to long-term growth.
Key Players Shaping the South and Central America OCTG Market
- Tenaris SA
- Vallourec SA
- Nippon Steel Corporation
- TPCO Enterprise Inc
- National-Oilwell Varco Inc
- ArcelorMittal SA
- List Not Exhaustive
Notable Milestones in South and Central America OCTG Industry Sector
- 2021: Tenaris SA announced expansion of its South American manufacturing facility.
- 2022: Vallourec SA secured a major contract for OCTG supply in Brazil's offshore oil fields.
- 2023: Increased investment in R&D for corrosion-resistant OCTG. (Specific details unavailable, representative example)
In-Depth South and Central America OCTG Industry Market Outlook
The South and Central America OCTG market is poised for robust growth over the next decade, driven by ongoing energy sector investments and advancements in upstream oil and gas technologies. Strategic investments in research and development and strategic partnerships within the industry will be key to realizing future market potential and driving long-term value creation.
South and Central America OCTG Industry Segmentation
-
1. Manufacturing Process
- 1.1. Seamless
- 1.2. Electric Resistance Welded
-
2. Grade
- 2.1. Premium Grade
- 2.2. API Grade
-
3. Geography
- 3.1. Brazil
- 3.2. Argentina
- 3.3. Venezuela
- 3.4. Rest of South and Central America
South and Central America OCTG Industry Segmentation By Geography
- 1. Brazil
- 2. Argentina
- 3. Venezuela
- 4. Rest of South and Central America
South and Central America OCTG Industry REPORT HIGHLIGHTS
| Aspects | Details |
|---|---|
| Study Period | 2019-2033 |
| Base Year | 2024 |
| Estimated Year | 2025 |
| Forecast Period | 2025-2033 |
| Historical Period | 2019-2024 |
| Growth Rate | CAGR of > 4.50% from 2019-2033 |
| Segmentation |
|
Table of Contents
- 1. Introduction
- 1.1. Research Scope
- 1.2. Market Segmentation
- 1.3. Research Methodology
- 1.4. Definitions and Assumptions
- 2. Executive Summary
- 2.1. Introduction
- 3. Market Dynamics
- 3.1. Introduction
- 3.2. Market Drivers
- 3.2.1. 4.; Proven Shale Gas Reserves 4.; Technological Advancement in Horizontal Drilling and Hydraulic Fracturing
- 3.3. Market Restrains
- 3.3.1. 4.; High Exploration Cost
- 3.4. Market Trends
- 3.4.1. Premium Grade Segment is Expected to Witness Significant Demand
- 4. Market Factor Analysis
- 4.1. Porters Five Forces
- 4.2. Supply/Value Chain
- 4.3. PESTEL analysis
- 4.4. Market Entropy
- 4.5. Patent/Trademark Analysis
- 5. Global South and Central America OCTG Industry Analysis, Insights and Forecast, 2019-2031
- 5.1. Market Analysis, Insights and Forecast - by Manufacturing Process
- 5.1.1. Seamless
- 5.1.2. Electric Resistance Welded
- 5.2. Market Analysis, Insights and Forecast - by Grade
- 5.2.1. Premium Grade
- 5.2.2. API Grade
- 5.3. Market Analysis, Insights and Forecast - by Geography
- 5.3.1. Brazil
- 5.3.2. Argentina
- 5.3.3. Venezuela
- 5.3.4. Rest of South and Central America
- 5.4. Market Analysis, Insights and Forecast - by Region
- 5.4.1. Brazil
- 5.4.2. Argentina
- 5.4.3. Venezuela
- 5.4.4. Rest of South and Central America
- 5.1. Market Analysis, Insights and Forecast - by Manufacturing Process
- 6. Brazil South and Central America OCTG Industry Analysis, Insights and Forecast, 2019-2031
- 6.1. Market Analysis, Insights and Forecast - by Manufacturing Process
- 6.1.1. Seamless
- 6.1.2. Electric Resistance Welded
- 6.2. Market Analysis, Insights and Forecast - by Grade
- 6.2.1. Premium Grade
- 6.2.2. API Grade
- 6.3. Market Analysis, Insights and Forecast - by Geography
- 6.3.1. Brazil
- 6.3.2. Argentina
- 6.3.3. Venezuela
- 6.3.4. Rest of South and Central America
- 6.1. Market Analysis, Insights and Forecast - by Manufacturing Process
- 7. Argentina South and Central America OCTG Industry Analysis, Insights and Forecast, 2019-2031
- 7.1. Market Analysis, Insights and Forecast - by Manufacturing Process
- 7.1.1. Seamless
- 7.1.2. Electric Resistance Welded
- 7.2. Market Analysis, Insights and Forecast - by Grade
- 7.2.1. Premium Grade
- 7.2.2. API Grade
- 7.3. Market Analysis, Insights and Forecast - by Geography
- 7.3.1. Brazil
- 7.3.2. Argentina
- 7.3.3. Venezuela
- 7.3.4. Rest of South and Central America
- 7.1. Market Analysis, Insights and Forecast - by Manufacturing Process
- 8. Venezuela South and Central America OCTG Industry Analysis, Insights and Forecast, 2019-2031
- 8.1. Market Analysis, Insights and Forecast - by Manufacturing Process
- 8.1.1. Seamless
- 8.1.2. Electric Resistance Welded
- 8.2. Market Analysis, Insights and Forecast - by Grade
- 8.2.1. Premium Grade
- 8.2.2. API Grade
- 8.3. Market Analysis, Insights and Forecast - by Geography
- 8.3.1. Brazil
- 8.3.2. Argentina
- 8.3.3. Venezuela
- 8.3.4. Rest of South and Central America
- 8.1. Market Analysis, Insights and Forecast - by Manufacturing Process
- 9. Rest of South and Central America South and Central America OCTG Industry Analysis, Insights and Forecast, 2019-2031
- 9.1. Market Analysis, Insights and Forecast - by Manufacturing Process
- 9.1.1. Seamless
- 9.1.2. Electric Resistance Welded
- 9.2. Market Analysis, Insights and Forecast - by Grade
- 9.2.1. Premium Grade
- 9.2.2. API Grade
- 9.3. Market Analysis, Insights and Forecast - by Geography
- 9.3.1. Brazil
- 9.3.2. Argentina
- 9.3.3. Venezuela
- 9.3.4. Rest of South and Central America
- 9.1. Market Analysis, Insights and Forecast - by Manufacturing Process
- 10. North America South and Central America OCTG Industry Analysis, Insights and Forecast, 2019-2031
- 10.1. Market Analysis, Insights and Forecast - By Country/Sub-region
- 10.1.1 United States
- 10.1.2 Canada
- 10.1.3 Mexico
- 11. Europe South and Central America OCTG Industry Analysis, Insights and Forecast, 2019-2031
- 11.1. Market Analysis, Insights and Forecast - By Country/Sub-region
- 11.1.1 Germany
- 11.1.2 United Kingdom
- 11.1.3 France
- 11.1.4 Spain
- 11.1.5 Italy
- 11.1.6 Spain
- 11.1.7 Belgium
- 11.1.8 Netherland
- 11.1.9 Nordics
- 11.1.10 Rest of Europe
- 12. Asia Pacific South and Central America OCTG Industry Analysis, Insights and Forecast, 2019-2031
- 12.1. Market Analysis, Insights and Forecast - By Country/Sub-region
- 12.1.1 China
- 12.1.2 Japan
- 12.1.3 India
- 12.1.4 South Korea
- 12.1.5 Southeast Asia
- 12.1.6 Australia
- 12.1.7 Indonesia
- 12.1.8 Phillipes
- 12.1.9 Singapore
- 12.1.10 Thailandc
- 12.1.11 Rest of Asia Pacific
- 13. South America South and Central America OCTG Industry Analysis, Insights and Forecast, 2019-2031
- 13.1. Market Analysis, Insights and Forecast - By Country/Sub-region
- 13.1.1 Brazil
- 13.1.2 Argentina
- 13.1.3 Peru
- 13.1.4 Chile
- 13.1.5 Colombia
- 13.1.6 Ecuador
- 13.1.7 Venezuela
- 13.1.8 Rest of South America
- 14. North America South and Central America OCTG Industry Analysis, Insights and Forecast, 2019-2031
- 14.1. Market Analysis, Insights and Forecast - By Country/Sub-region
- 14.1.1 United States
- 14.1.2 Canada
- 14.1.3 Mexico
- 15. MEA South and Central America OCTG Industry Analysis, Insights and Forecast, 2019-2031
- 15.1. Market Analysis, Insights and Forecast - By Country/Sub-region
- 15.1.1 United Arab Emirates
- 15.1.2 Saudi Arabia
- 15.1.3 South Africa
- 15.1.4 Rest of Middle East and Africa
- 16. Competitive Analysis
- 16.1. Global Market Share Analysis 2024
- 16.2. Company Profiles
- 16.2.1 Tenaris SA
- 16.2.1.1. Overview
- 16.2.1.2. Products
- 16.2.1.3. SWOT Analysis
- 16.2.1.4. Recent Developments
- 16.2.1.5. Financials (Based on Availability)
- 16.2.2 Vallourec SA
- 16.2.2.1. Overview
- 16.2.2.2. Products
- 16.2.2.3. SWOT Analysis
- 16.2.2.4. Recent Developments
- 16.2.2.5. Financials (Based on Availability)
- 16.2.3 Nippon Steel Corporation
- 16.2.3.1. Overview
- 16.2.3.2. Products
- 16.2.3.3. SWOT Analysis
- 16.2.3.4. Recent Developments
- 16.2.3.5. Financials (Based on Availability)
- 16.2.4 TPCO Enterprise Inc *List Not Exhaustive
- 16.2.4.1. Overview
- 16.2.4.2. Products
- 16.2.4.3. SWOT Analysis
- 16.2.4.4. Recent Developments
- 16.2.4.5. Financials (Based on Availability)
- 16.2.5 National-Oilwell Varco Inc
- 16.2.5.1. Overview
- 16.2.5.2. Products
- 16.2.5.3. SWOT Analysis
- 16.2.5.4. Recent Developments
- 16.2.5.5. Financials (Based on Availability)
- 16.2.6 ArcelorMittal SA
- 16.2.6.1. Overview
- 16.2.6.2. Products
- 16.2.6.3. SWOT Analysis
- 16.2.6.4. Recent Developments
- 16.2.6.5. Financials (Based on Availability)
- 16.2.1 Tenaris SA
List of Figures
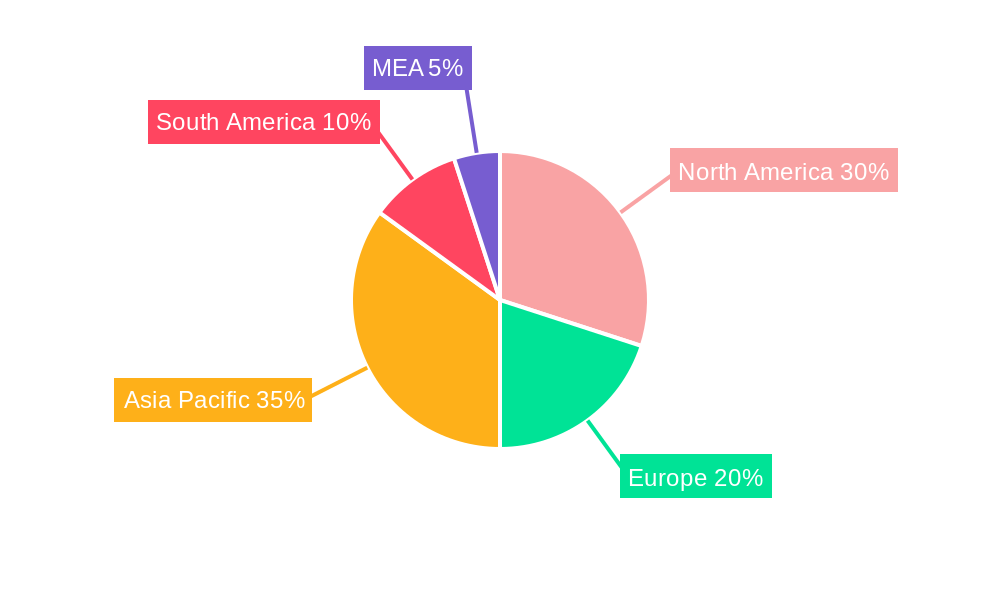
- Figure 1: Global South and Central America OCTG Industry Revenue Breakdown (Million, %) by Region 2024 & 2032
- Figure 2: North America South and Central America OCTG Industry Revenue (Million), by Country 2024 & 2032
- Figure 3: North America South and Central America OCTG Industry Revenue Share (%), by Country 2024 & 2032
- Figure 4: Europe South and Central America OCTG Industry Revenue (Million), by Country 2024 & 2032
- Figure 5: Europe South and Central America OCTG Industry Revenue Share (%), by Country 2024 & 2032
- Figure 6: Asia Pacific South and Central America OCTG Industry Revenue (Million), by Country 2024 & 2032
- Figure 7: Asia Pacific South and Central America OCTG Industry Revenue Share (%), by Country 2024 & 2032
- Figure 8: South America South and Central America OCTG Industry Revenue (Million), by Country 2024 & 2032
- Figure 9: South America South and Central America OCTG Industry Revenue Share (%), by Country 2024 & 2032
- Figure 10: North America South and Central America OCTG Industry Revenue (Million), by Country 2024 & 2032
- Figure 11: North America South and Central America OCTG Industry Revenue Share (%), by Country 2024 & 2032
- Figure 12: MEA South and Central America OCTG Industry Revenue (Million), by Country 2024 & 2032
- Figure 13: MEA South and Central America OCTG Industry Revenue Share (%), by Country 2024 & 2032
- Figure 14: Brazil South and Central America OCTG Industry Revenue (Million), by Manufacturing Process 2024 & 2032
- Figure 15: Brazil South and Central America OCTG Industry Revenue Share (%), by Manufacturing Process 2024 & 2032
- Figure 16: Brazil South and Central America OCTG Industry Revenue (Million), by Grade 2024 & 2032
- Figure 17: Brazil South and Central America OCTG Industry Revenue Share (%), by Grade 2024 & 2032
- Figure 18: Brazil South and Central America OCTG Industry Revenue (Million), by Geography 2024 & 2032
- Figure 19: Brazil South and Central America OCTG Industry Revenue Share (%), by Geography 2024 & 2032
- Figure 20: Brazil South and Central America OCTG Industry Revenue (Million), by Country 2024 & 2032
- Figure 21: Brazil South and Central America OCTG Industry Revenue Share (%), by Country 2024 & 2032
- Figure 22: Argentina South and Central America OCTG Industry Revenue (Million), by Manufacturing Process 2024 & 2032
- Figure 23: Argentina South and Central America OCTG Industry Revenue Share (%), by Manufacturing Process 2024 & 2032
- Figure 24: Argentina South and Central America OCTG Industry Revenue (Million), by Grade 2024 & 2032
- Figure 25: Argentina South and Central America OCTG Industry Revenue Share (%), by Grade 2024 & 2032
- Figure 26: Argentina South and Central America OCTG Industry Revenue (Million), by Geography 2024 & 2032
- Figure 27: Argentina South and Central America OCTG Industry Revenue Share (%), by Geography 2024 & 2032
- Figure 28: Argentina South and Central America OCTG Industry Revenue (Million), by Country 2024 & 2032
- Figure 29: Argentina South and Central America OCTG Industry Revenue Share (%), by Country 2024 & 2032
- Figure 30: Venezuela South and Central America OCTG Industry Revenue (Million), by Manufacturing Process 2024 & 2032
- Figure 31: Venezuela South and Central America OCTG Industry Revenue Share (%), by Manufacturing Process 2024 & 2032
- Figure 32: Venezuela South and Central America OCTG Industry Revenue (Million), by Grade 2024 & 2032
- Figure 33: Venezuela South and Central America OCTG Industry Revenue Share (%), by Grade 2024 & 2032
- Figure 34: Venezuela South and Central America OCTG Industry Revenue (Million), by Geography 2024 & 2032
- Figure 35: Venezuela South and Central America OCTG Industry Revenue Share (%), by Geography 2024 & 2032
- Figure 36: Venezuela South and Central America OCTG Industry Revenue (Million), by Country 2024 & 2032
- Figure 37: Venezuela South and Central America OCTG Industry Revenue Share (%), by Country 2024 & 2032
- Figure 38: Rest of South and Central America South and Central America OCTG Industry Revenue (Million), by Manufacturing Process 2024 & 2032
- Figure 39: Rest of South and Central America South and Central America OCTG Industry Revenue Share (%), by Manufacturing Process 2024 & 2032
- Figure 40: Rest of South and Central America South and Central America OCTG Industry Revenue (Million), by Grade 2024 & 2032
- Figure 41: Rest of South and Central America South and Central America OCTG Industry Revenue Share (%), by Grade 2024 & 2032
- Figure 42: Rest of South and Central America South and Central America OCTG Industry Revenue (Million), by Geography 2024 & 2032
- Figure 43: Rest of South and Central America South and Central America OCTG Industry Revenue Share (%), by Geography 2024 & 2032
- Figure 44: Rest of South and Central America South and Central America OCTG Industry Revenue (Million), by Country 2024 & 2032
- Figure 45: Rest of South and Central America South and Central America OCTG Industry Revenue Share (%), by Country 2024 & 2032
List of Tables
- Table 1: Global South and Central America OCTG Industry Revenue Million Forecast, by Region 2019 & 2032
- Table 2: Global South and Central America OCTG Industry Revenue Million Forecast, by Manufacturing Process 2019 & 2032
- Table 3: Global South and Central America OCTG Industry Revenue Million Forecast, by Grade 2019 & 2032
- Table 4: Global South and Central America OCTG Industry Revenue Million Forecast, by Geography 2019 & 2032
- Table 5: Global South and Central America OCTG Industry Revenue Million Forecast, by Region 2019 & 2032
- Table 6: Global South and Central America OCTG Industry Revenue Million Forecast, by Country 2019 & 2032
- Table 7: United States South and Central America OCTG Industry Revenue (Million) Forecast, by Application 2019 & 2032
- Table 8: Canada South and Central America OCTG Industry Revenue (Million) Forecast, by Application 2019 & 2032
- Table 9: Mexico South and Central America OCTG Industry Revenue (Million) Forecast, by Application 2019 & 2032
- Table 10: Global South and Central America OCTG Industry Revenue Million Forecast, by Country 2019 & 2032
- Table 11: Germany South and Central America OCTG Industry Revenue (Million) Forecast, by Application 2019 & 2032
- Table 12: United Kingdom South and Central America OCTG Industry Revenue (Million) Forecast, by Application 2019 & 2032
- Table 13: France South and Central America OCTG Industry Revenue (Million) Forecast, by Application 2019 & 2032
- Table 14: Spain South and Central America OCTG Industry Revenue (Million) Forecast, by Application 2019 & 2032
- Table 15: Italy South and Central America OCTG Industry Revenue (Million) Forecast, by Application 2019 & 2032
- Table 16: Spain South and Central America OCTG Industry Revenue (Million) Forecast, by Application 2019 & 2032
- Table 17: Belgium South and Central America OCTG Industry Revenue (Million) Forecast, by Application 2019 & 2032
- Table 18: Netherland South and Central America OCTG Industry Revenue (Million) Forecast, by Application 2019 & 2032
- Table 19: Nordics South and Central America OCTG Industry Revenue (Million) Forecast, by Application 2019 & 2032
- Table 20: Rest of Europe South and Central America OCTG Industry Revenue (Million) Forecast, by Application 2019 & 2032
- Table 21: Global South and Central America OCTG Industry Revenue Million Forecast, by Country 2019 & 2032
- Table 22: China South and Central America OCTG Industry Revenue (Million) Forecast, by Application 2019 & 2032
- Table 23: Japan South and Central America OCTG Industry Revenue (Million) Forecast, by Application 2019 & 2032
- Table 24: India South and Central America OCTG Industry Revenue (Million) Forecast, by Application 2019 & 2032
- Table 25: South Korea South and Central America OCTG Industry Revenue (Million) Forecast, by Application 2019 & 2032
- Table 26: Southeast Asia South and Central America OCTG Industry Revenue (Million) Forecast, by Application 2019 & 2032
- Table 27: Australia South and Central America OCTG Industry Revenue (Million) Forecast, by Application 2019 & 2032
- Table 28: Indonesia South and Central America OCTG Industry Revenue (Million) Forecast, by Application 2019 & 2032
- Table 29: Phillipes South and Central America OCTG Industry Revenue (Million) Forecast, by Application 2019 & 2032
- Table 30: Singapore South and Central America OCTG Industry Revenue (Million) Forecast, by Application 2019 & 2032
- Table 31: Thailandc South and Central America OCTG Industry Revenue (Million) Forecast, by Application 2019 & 2032
- Table 32: Rest of Asia Pacific South and Central America OCTG Industry Revenue (Million) Forecast, by Application 2019 & 2032
- Table 33: Global South and Central America OCTG Industry Revenue Million Forecast, by Country 2019 & 2032
- Table 34: Brazil South and Central America OCTG Industry Revenue (Million) Forecast, by Application 2019 & 2032
- Table 35: Argentina South and Central America OCTG Industry Revenue (Million) Forecast, by Application 2019 & 2032
- Table 36: Peru South and Central America OCTG Industry Revenue (Million) Forecast, by Application 2019 & 2032
- Table 37: Chile South and Central America OCTG Industry Revenue (Million) Forecast, by Application 2019 & 2032
- Table 38: Colombia South and Central America OCTG Industry Revenue (Million) Forecast, by Application 2019 & 2032
- Table 39: Ecuador South and Central America OCTG Industry Revenue (Million) Forecast, by Application 2019 & 2032
- Table 40: Venezuela South and Central America OCTG Industry Revenue (Million) Forecast, by Application 2019 & 2032
- Table 41: Rest of South America South and Central America OCTG Industry Revenue (Million) Forecast, by Application 2019 & 2032
- Table 42: Global South and Central America OCTG Industry Revenue Million Forecast, by Country 2019 & 2032
- Table 43: United States South and Central America OCTG Industry Revenue (Million) Forecast, by Application 2019 & 2032
- Table 44: Canada South and Central America OCTG Industry Revenue (Million) Forecast, by Application 2019 & 2032
- Table 45: Mexico South and Central America OCTG Industry Revenue (Million) Forecast, by Application 2019 & 2032
- Table 46: Global South and Central America OCTG Industry Revenue Million Forecast, by Country 2019 & 2032
- Table 47: United Arab Emirates South and Central America OCTG Industry Revenue (Million) Forecast, by Application 2019 & 2032
- Table 48: Saudi Arabia South and Central America OCTG Industry Revenue (Million) Forecast, by Application 2019 & 2032
- Table 49: South Africa South and Central America OCTG Industry Revenue (Million) Forecast, by Application 2019 & 2032
- Table 50: Rest of Middle East and Africa South and Central America OCTG Industry Revenue (Million) Forecast, by Application 2019 & 2032
- Table 51: Global South and Central America OCTG Industry Revenue Million Forecast, by Manufacturing Process 2019 & 2032
- Table 52: Global South and Central America OCTG Industry Revenue Million Forecast, by Grade 2019 & 2032
- Table 53: Global South and Central America OCTG Industry Revenue Million Forecast, by Geography 2019 & 2032
- Table 54: Global South and Central America OCTG Industry Revenue Million Forecast, by Country 2019 & 2032
- Table 55: Global South and Central America OCTG Industry Revenue Million Forecast, by Manufacturing Process 2019 & 2032
- Table 56: Global South and Central America OCTG Industry Revenue Million Forecast, by Grade 2019 & 2032
- Table 57: Global South and Central America OCTG Industry Revenue Million Forecast, by Geography 2019 & 2032
- Table 58: Global South and Central America OCTG Industry Revenue Million Forecast, by Country 2019 & 2032
- Table 59: Global South and Central America OCTG Industry Revenue Million Forecast, by Manufacturing Process 2019 & 2032
- Table 60: Global South and Central America OCTG Industry Revenue Million Forecast, by Grade 2019 & 2032
- Table 61: Global South and Central America OCTG Industry Revenue Million Forecast, by Geography 2019 & 2032
- Table 62: Global South and Central America OCTG Industry Revenue Million Forecast, by Country 2019 & 2032
- Table 63: Global South and Central America OCTG Industry Revenue Million Forecast, by Manufacturing Process 2019 & 2032
- Table 64: Global South and Central America OCTG Industry Revenue Million Forecast, by Grade 2019 & 2032
- Table 65: Global South and Central America OCTG Industry Revenue Million Forecast, by Geography 2019 & 2032
- Table 66: Global South and Central America OCTG Industry Revenue Million Forecast, by Country 2019 & 2032
Frequently Asked Questions
1. What is the projected Compound Annual Growth Rate (CAGR) of the South and Central America OCTG Industry?
The projected CAGR is approximately > 4.50%.
2. Which companies are prominent players in the South and Central America OCTG Industry?
Key companies in the market include Tenaris SA, Vallourec SA, Nippon Steel Corporation, TPCO Enterprise Inc *List Not Exhaustive, National-Oilwell Varco Inc, ArcelorMittal SA.
3. What are the main segments of the South and Central America OCTG Industry?
The market segments include Manufacturing Process, Grade, Geography.
4. Can you provide details about the market size?
The market size is estimated to be USD XX Million as of 2022.
5. What are some drivers contributing to market growth?
4.; Proven Shale Gas Reserves 4.; Technological Advancement in Horizontal Drilling and Hydraulic Fracturing.
6. What are the notable trends driving market growth?
Premium Grade Segment is Expected to Witness Significant Demand.
7. Are there any restraints impacting market growth?
4.; High Exploration Cost.
8. Can you provide examples of recent developments in the market?
N/A
9. What pricing options are available for accessing the report?
Pricing options include single-user, multi-user, and enterprise licenses priced at USD 4750, USD 5250, and USD 8750 respectively.
10. Is the market size provided in terms of value or volume?
The market size is provided in terms of value, measured in Million.
11. Are there any specific market keywords associated with the report?
Yes, the market keyword associated with the report is "South and Central America OCTG Industry," which aids in identifying and referencing the specific market segment covered.
12. How do I determine which pricing option suits my needs best?
The pricing options vary based on user requirements and access needs. Individual users may opt for single-user licenses, while businesses requiring broader access may choose multi-user or enterprise licenses for cost-effective access to the report.
13. Are there any additional resources or data provided in the South and Central America OCTG Industry report?
While the report offers comprehensive insights, it's advisable to review the specific contents or supplementary materials provided to ascertain if additional resources or data are available.
14. How can I stay updated on further developments or reports in the South and Central America OCTG Industry?
To stay informed about further developments, trends, and reports in the South and Central America OCTG Industry, consider subscribing to industry newsletters, following relevant companies and organizations, or regularly checking reputable industry news sources and publications.
Methodology
Step 1 - Identification of Relevant Samples Size from Population Database


Step 2 - Approaches for Defining Global Market Size (Value, Volume* & Price*)

Note*: In applicable scenarios
Step 3 - Data Sources
Primary Research
- Web Analytics
- Survey Reports
- Research Institute
- Latest Research Reports
- Opinion Leaders
Secondary Research
- Annual Reports
- White Paper
- Latest Press Release
- Industry Association
- Paid Database
- Investor Presentations

Step 4 - Data Triangulation
Involves using different sources of information in order to increase the validity of a study
These sources are likely to be stakeholders in a program - participants, other researchers, program staff, other community members, and so on.
Then we put all data in single framework & apply various statistical tools to find out the dynamic on the market.
During the analysis stage, feedback from the stakeholder groups would be compared to determine areas of agreement as well as areas of divergence


