
Key Insights
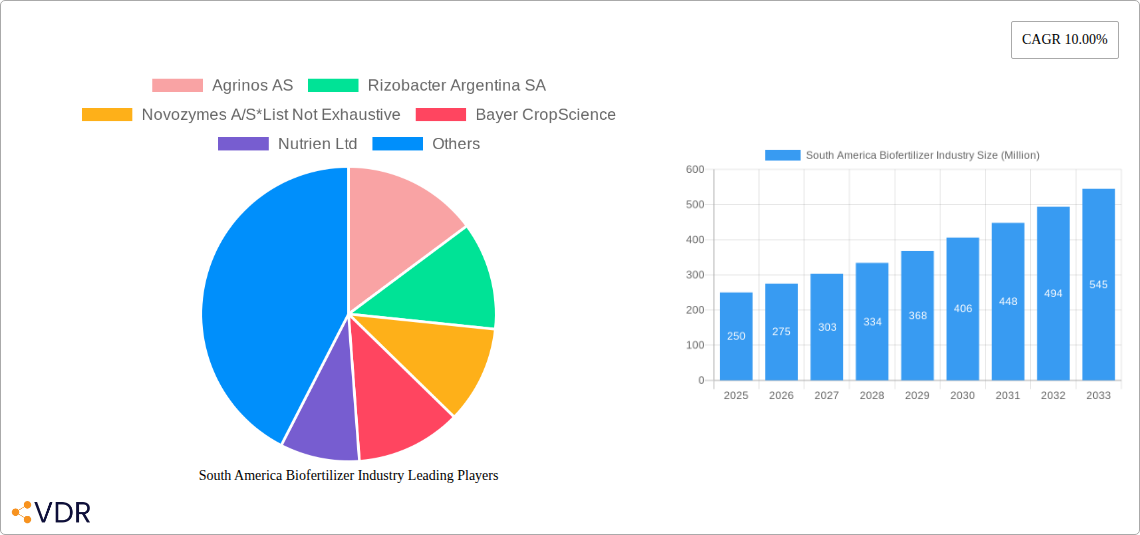
The South American biofertilizer market, currently experiencing robust growth, is projected to reach a significant size over the forecast period (2025-2033). Driven by increasing awareness of sustainable agriculture practices, stringent regulations on chemical fertilizers, and the rising demand for higher crop yields, the market is poised for substantial expansion. The CAGR of 10% indicates a consistently healthy growth trajectory. Key segments driving this expansion include Rhizobium, Azotobacter, and Phosphate Solubilizing Bacteria among microorganisms, and liquid biofertilizers within technology types. Seed and soil treatment applications are experiencing considerable demand, particularly within grains and cereals, pulses and oilseeds, and commercial crops. Leading players like Agrinos AS, Rizobacter Argentina SA, and Novozymes A/S are strategically positioning themselves to capitalize on these market trends through product innovation and expansion into key agricultural regions. Brazil and Argentina, as major agricultural producers in South America, are significant contributors to market growth, with the remaining South American countries exhibiting potential for future expansion. The market's growth is further fueled by government initiatives promoting sustainable agriculture and the increasing adoption of precision farming techniques.
While the market faces certain restraints such as high initial investment costs for biofertilizer adoption and challenges in consistent product quality, the long-term benefits of increased crop yields, reduced environmental impact, and improved soil health outweigh these obstacles. The market is expected to witness increased competition amongst established players and new entrants, leading to further innovation and a wider range of biofertilizer products tailored to specific crop needs and regional conditions. Continued research and development efforts focusing on enhancing biofertilizer efficacy and exploring new microbial strains will be crucial in driving future growth within the South American biofertilizer sector. The market segmentation offers various opportunities for targeted investments and product development.
South America Biofertilizer Industry: A Comprehensive Market Report (2019-2033)
This comprehensive report provides an in-depth analysis of the South America biofertilizer industry, offering invaluable insights for industry professionals, investors, and stakeholders. It covers market dynamics, growth trends, leading segments, key players, and future outlook, utilizing data from the study period 2019-2024, a base year of 2025, and forecasts spanning 2025-2033. The report segments the market by Microorganism type (Rhizobium, Azotobacter, Azospirillum, Blue-green Algae, Phosphate Solubilizing Bacteria, Mycorrhiza, Other Microorganisms), Technology Type (Carrier Enriched Biofertilizers, Liquid Biofertilizers, Other Technology Types), Application (Seed Treatment, Soil Treatment), and Crop Type (Grains and Cereals, Pulses and Oilseeds, Commercial Crops, Fruits and Vegetables, Other Crop Types).
South America Biofertilizer Industry Market Dynamics & Structure
The South American biofertilizer market is characterized by moderate concentration, with key players like Agrinos AS, Rizobacter Argentina SA, Novozymes A/S, Bayer CropScience, Nutrien Ltd, Mapleton Agri Biotech Pty Limited, Biomax, and Lallemand Inc. holding significant market share. However, the market also features numerous smaller players, leading to a competitive landscape. Market size in 2025 is estimated at XX Million.
- Market Concentration: Moderately concentrated, with top 5 players holding approximately 45% market share in 2025.
- Technological Innovation: Driven by increasing demand for sustainable agriculture and the need for improved crop yields. Innovation focuses on developing more effective and efficient biofertilizers tailored to specific crops and soil conditions.
- Regulatory Framework: Varies across South American countries, impacting market access and product registration. Harmonization of regulations is a key factor for future growth.
- Competitive Substitutes: Chemical fertilizers remain a significant competitor, though increasing awareness of environmental concerns is driving a shift towards biofertilizers.
- End-User Demographics: Primarily farmers, ranging from smallholders to large-scale agricultural operations. Market penetration varies depending on crop type, farming practices, and geographical location.
- M&A Trends: A moderate level of M&A activity observed in the historical period (2019-2024), with approximately xx deals completed. This trend is expected to continue driven by consolidation and expansion strategies.
South America Biofertilizer Industry Growth Trends & Insights
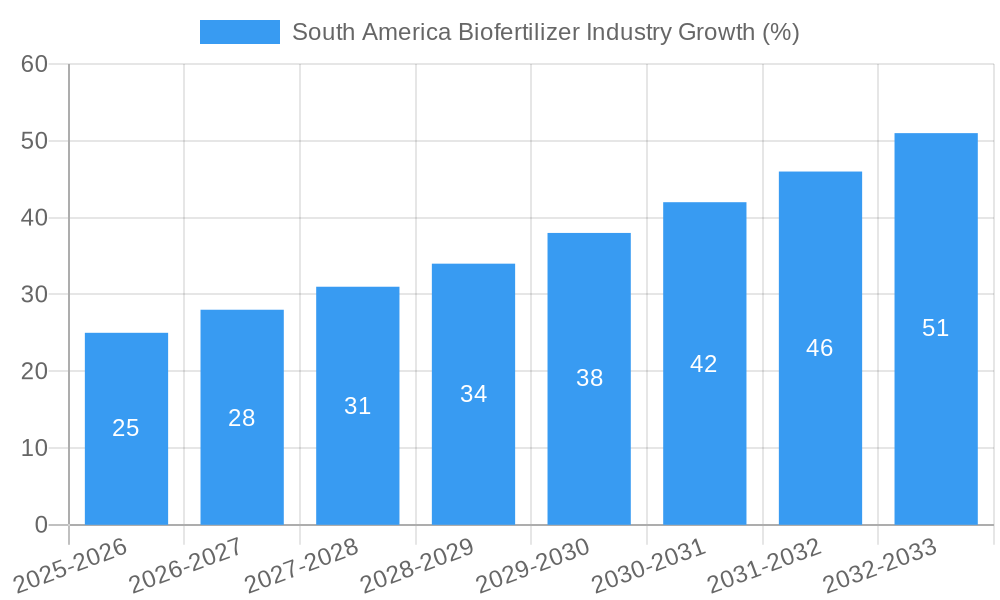
The South American biofertilizer market experienced significant growth during the historical period (2019-2024), driven by factors including increasing awareness of sustainable agricultural practices, government support for bio-based solutions, and rising demand for higher crop yields. The market is projected to maintain a strong CAGR of xx% from 2025 to 2033, reaching an estimated value of xx Million by 2033. This growth is fueled by several factors:
- Increasing adoption of sustainable agricultural practices among farmers.
- Government initiatives promoting the use of biofertilizers.
- Technological advancements resulting in more effective biofertilizer formulations.
- Growing demand for high-quality agricultural products.
- Rising awareness of environmental concerns associated with chemical fertilizers.
Dominant Regions, Countries, or Segments in South America Biofertilizer Industry
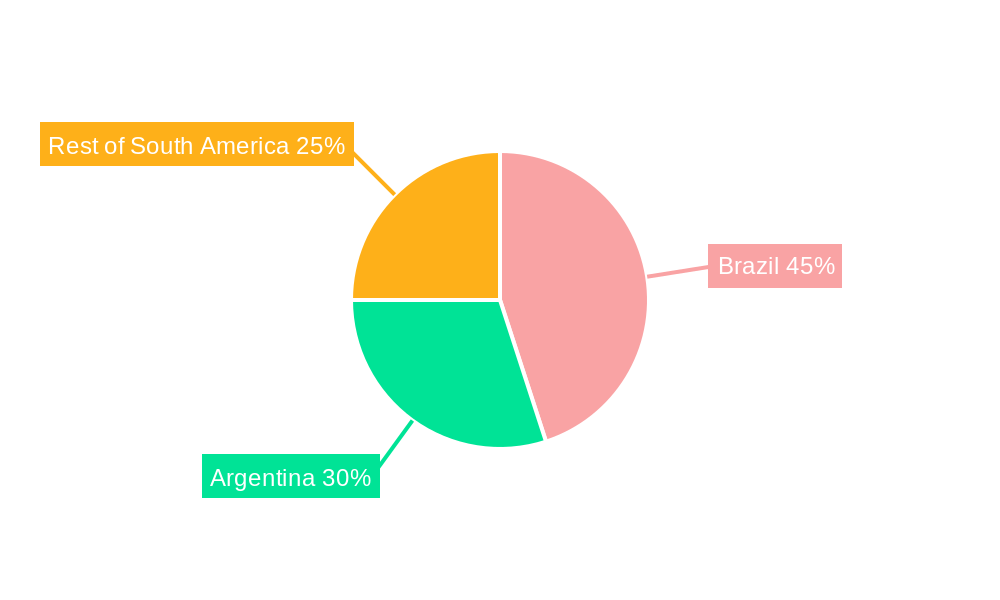
Brazil and Argentina are the dominant markets within South America, accounting for approximately 70% of total market value in 2025. The high adoption of biofertilizers in these countries is driven by factors including large agricultural production areas, supportive government policies, and a relatively advanced agricultural infrastructure.
- Leading Segment (by Microorganism): Rhizobium and Phosphate Solubilizing Bacteria are dominant segments due to their efficacy in various crops and soil types.
- Leading Segment (by Technology Type): Liquid biofertilizers show higher growth due to ease of application and better nutrient availability.
- Leading Segment (by Application): Seed treatment is the preferred application method due to its cost-effectiveness and targeted nutrient delivery.
- Leading Segment (by Crop Type): Grains and cereals segment contributes most to market growth due to its large area under cultivation.
- Key Drivers: Favorable government policies, increasing farmer awareness, and the expanding agricultural sector.
South America Biofertilizer Industry Product Landscape
The South American biofertilizer market offers a diverse range of products formulated for specific crops and soil conditions. Innovations focus on improving efficacy, shelf life, and ease of application. Formulations tailored to specific nutrient deficiencies are gaining traction, while improvements in carrier materials and delivery systems contribute to product differentiation. The emphasis is on sustainable and eco-friendly production methods, meeting the requirements of environmentally conscious consumers. Key features include higher nutrient delivery efficiency, improved shelf life, and better crop yield enhancement.
Key Drivers, Barriers & Challenges in South America Biofertilizer Industry
Key Drivers:
- Growing awareness of the environmental impact of chemical fertilizers.
- Increasing demand for sustainable and organic agricultural products.
- Government support and incentives for biofertilizer adoption.
- Technological advancements leading to more effective biofertilizers.
Challenges & Restraints:
- High initial investment costs for farmers to transition to biofertilizers.
- Limited awareness and understanding of biofertilizer technology among farmers.
- Inconsistent regulatory frameworks across different countries.
- Competition from cheaper chemical fertilizers. This leads to approximately xx million units lost annually in potential sales.
Emerging Opportunities in South America Biofertilizer Industry
- Growing demand for biofertilizers in organic farming.
- Expanding opportunities in specialized crop segments, like fruits and vegetables.
- Development of biofertilizers with improved efficacy and targeted nutrient delivery.
- Increased focus on biofertilizer formulations for specific soil types and climatic conditions.
Growth Accelerators in the South America Biofertilizer Industry
The South American biofertilizer market is poised for robust growth, driven by technological breakthroughs in biofertilizer formulation, increasing collaboration among industry players and research institutions, and expanding market penetration in untapped regions and crop segments. Government support through subsidies and awareness campaigns also accelerates market expansion.
Key Players Shaping the South America Biofertilizer Industry Market
- Agrinos AS
- Rizobacter Argentina SA
- Novozymes A/S
- Bayer CropScience
- Nutrien Ltd
- Mapleton Agri Biotech Pty Limited
- Biomax
- Lallemand Inc
Notable Milestones in South America Biofertilizer Industry Sector
- 2020: Introduction of a new Rhizobium-based biofertilizer by Rizobacter Argentina SA specifically targeting soybean crops.
- 2022: Agrinos AS partnered with a major Brazilian agricultural cooperative to expand its market reach.
- 2023: Regulatory approval granted for a new liquid biofertilizer formulation in Argentina.
In-Depth South America Biofertilizer Industry Market Outlook
The South American biofertilizer market is expected to experience substantial growth over the forecast period (2025-2033), driven by increasing demand for sustainable agricultural practices and technological advancements. Strategic partnerships, investments in research and development, and expansion into new markets will further contribute to the market's growth potential. The market presents significant opportunities for both established players and new entrants.
South America Biofertilizer Industry Segmentation
- 1. Production Analysis
- 2. Consumption Analysis
- 3. Import Market Analysis (Value & Volume)
- 4. Export Market Analysis (Value & Volume)
- 5. Price Trend Analysis
South America Biofertilizer Industry Segmentation By Geography
-
1. South America
- 1.1. Brazil
- 1.2. Argentina
- 1.3. Chile
- 1.4. Colombia
- 1.5. Peru
- 1.6. Venezuela
- 1.7. Ecuador
- 1.8. Bolivia
- 1.9. Paraguay
- 1.10. Uruguay
South America Biofertilizer Industry REPORT HIGHLIGHTS
| Aspects | Details |
|---|---|
| Study Period | 2019-2033 |
| Base Year | 2024 |
| Estimated Year | 2025 |
| Forecast Period | 2025-2033 |
| Historical Period | 2019-2024 |
| Growth Rate | CAGR of 10.00% from 2019-2033 |
| Segmentation |
|
Table of Contents
- 1. Introduction
- 1.1. Research Scope
- 1.2. Market Segmentation
- 1.3. Research Methodology
- 1.4. Definitions and Assumptions
- 2. Executive Summary
- 2.1. Introduction
- 3. Market Dynamics
- 3.1. Introduction
- 3.2. Market Drivers
- 3.2.1. Seed Treatment As A Solution To Enhance Yield; Growing Awareness For Seed Treatment Among The Farmers; Rising Trend Of Organic Farming
- 3.3. Market Restrains
- 3.3.1. Limitations Across Farm-Level Seed Treatment; Rising Environmental Concerns
- 3.4. Market Trends
- 3.4.1. Increased Practice Of Organic Farming
- 4. Market Factor Analysis
- 4.1. Porters Five Forces
- 4.2. Supply/Value Chain
- 4.3. PESTEL analysis
- 4.4. Market Entropy
- 4.5. Patent/Trademark Analysis
- 5. South America Biofertilizer Industry Analysis, Insights and Forecast, 2019-2031
- 5.1. Market Analysis, Insights and Forecast - by Production Analysis
- 5.2. Market Analysis, Insights and Forecast - by Consumption Analysis
- 5.3. Market Analysis, Insights and Forecast - by Import Market Analysis (Value & Volume)
- 5.4. Market Analysis, Insights and Forecast - by Export Market Analysis (Value & Volume)
- 5.5. Market Analysis, Insights and Forecast - by Price Trend Analysis
- 5.6. Market Analysis, Insights and Forecast - by Region
- 5.6.1. South America
- 5.1. Market Analysis, Insights and Forecast - by Production Analysis
- 6. Brazil South America Biofertilizer Industry Analysis, Insights and Forecast, 2019-2031
- 7. Argentina South America Biofertilizer Industry Analysis, Insights and Forecast, 2019-2031
- 8. Rest of South America South America Biofertilizer Industry Analysis, Insights and Forecast, 2019-2031
- 9. Competitive Analysis
- 9.1. Market Share Analysis 2024
- 9.2. Company Profiles
- 9.2.1 Agrinos AS
- 9.2.1.1. Overview
- 9.2.1.2. Products
- 9.2.1.3. SWOT Analysis
- 9.2.1.4. Recent Developments
- 9.2.1.5. Financials (Based on Availability)
- 9.2.2 Rizobacter Argentina SA
- 9.2.2.1. Overview
- 9.2.2.2. Products
- 9.2.2.3. SWOT Analysis
- 9.2.2.4. Recent Developments
- 9.2.2.5. Financials (Based on Availability)
- 9.2.3 Novozymes A/S*List Not Exhaustive
- 9.2.3.1. Overview
- 9.2.3.2. Products
- 9.2.3.3. SWOT Analysis
- 9.2.3.4. Recent Developments
- 9.2.3.5. Financials (Based on Availability)
- 9.2.4 Bayer CropScience
- 9.2.4.1. Overview
- 9.2.4.2. Products
- 9.2.4.3. SWOT Analysis
- 9.2.4.4. Recent Developments
- 9.2.4.5. Financials (Based on Availability)
- 9.2.5 Nutrien Ltd
- 9.2.5.1. Overview
- 9.2.5.2. Products
- 9.2.5.3. SWOT Analysis
- 9.2.5.4. Recent Developments
- 9.2.5.5. Financials (Based on Availability)
- 9.2.6 Mapleton Agri Biotech Pty Limited
- 9.2.6.1. Overview
- 9.2.6.2. Products
- 9.2.6.3. SWOT Analysis
- 9.2.6.4. Recent Developments
- 9.2.6.5. Financials (Based on Availability)
- 9.2.7 Biomax
- 9.2.7.1. Overview
- 9.2.7.2. Products
- 9.2.7.3. SWOT Analysis
- 9.2.7.4. Recent Developments
- 9.2.7.5. Financials (Based on Availability)
- 9.2.8 Lallemand Inc
- 9.2.8.1. Overview
- 9.2.8.2. Products
- 9.2.8.3. SWOT Analysis
- 9.2.8.4. Recent Developments
- 9.2.8.5. Financials (Based on Availability)
- 9.2.1 Agrinos AS
List of Figures
- Figure 1: South America Biofertilizer Industry Revenue Breakdown (Million, %) by Product 2024 & 2032
- Figure 2: South America Biofertilizer Industry Share (%) by Company 2024
List of Tables
- Table 1: South America Biofertilizer Industry Revenue Million Forecast, by Region 2019 & 2032
- Table 2: South America Biofertilizer Industry Revenue Million Forecast, by Production Analysis 2019 & 2032
- Table 3: South America Biofertilizer Industry Revenue Million Forecast, by Consumption Analysis 2019 & 2032
- Table 4: South America Biofertilizer Industry Revenue Million Forecast, by Import Market Analysis (Value & Volume) 2019 & 2032
- Table 5: South America Biofertilizer Industry Revenue Million Forecast, by Export Market Analysis (Value & Volume) 2019 & 2032
- Table 6: South America Biofertilizer Industry Revenue Million Forecast, by Price Trend Analysis 2019 & 2032
- Table 7: South America Biofertilizer Industry Revenue Million Forecast, by Region 2019 & 2032
- Table 8: South America Biofertilizer Industry Revenue Million Forecast, by Country 2019 & 2032
- Table 9: Brazil South America Biofertilizer Industry Revenue (Million) Forecast, by Application 2019 & 2032
- Table 10: Argentina South America Biofertilizer Industry Revenue (Million) Forecast, by Application 2019 & 2032
- Table 11: Rest of South America South America Biofertilizer Industry Revenue (Million) Forecast, by Application 2019 & 2032
- Table 12: South America Biofertilizer Industry Revenue Million Forecast, by Production Analysis 2019 & 2032
- Table 13: South America Biofertilizer Industry Revenue Million Forecast, by Consumption Analysis 2019 & 2032
- Table 14: South America Biofertilizer Industry Revenue Million Forecast, by Import Market Analysis (Value & Volume) 2019 & 2032
- Table 15: South America Biofertilizer Industry Revenue Million Forecast, by Export Market Analysis (Value & Volume) 2019 & 2032
- Table 16: South America Biofertilizer Industry Revenue Million Forecast, by Price Trend Analysis 2019 & 2032
- Table 17: South America Biofertilizer Industry Revenue Million Forecast, by Country 2019 & 2032
- Table 18: Brazil South America Biofertilizer Industry Revenue (Million) Forecast, by Application 2019 & 2032
- Table 19: Argentina South America Biofertilizer Industry Revenue (Million) Forecast, by Application 2019 & 2032
- Table 20: Chile South America Biofertilizer Industry Revenue (Million) Forecast, by Application 2019 & 2032
- Table 21: Colombia South America Biofertilizer Industry Revenue (Million) Forecast, by Application 2019 & 2032
- Table 22: Peru South America Biofertilizer Industry Revenue (Million) Forecast, by Application 2019 & 2032
- Table 23: Venezuela South America Biofertilizer Industry Revenue (Million) Forecast, by Application 2019 & 2032
- Table 24: Ecuador South America Biofertilizer Industry Revenue (Million) Forecast, by Application 2019 & 2032
- Table 25: Bolivia South America Biofertilizer Industry Revenue (Million) Forecast, by Application 2019 & 2032
- Table 26: Paraguay South America Biofertilizer Industry Revenue (Million) Forecast, by Application 2019 & 2032
- Table 27: Uruguay South America Biofertilizer Industry Revenue (Million) Forecast, by Application 2019 & 2032
Frequently Asked Questions
1. What is the projected Compound Annual Growth Rate (CAGR) of the South America Biofertilizer Industry?
The projected CAGR is approximately 10.00%.
2. Which companies are prominent players in the South America Biofertilizer Industry?
Key companies in the market include Agrinos AS, Rizobacter Argentina SA, Novozymes A/S*List Not Exhaustive, Bayer CropScience, Nutrien Ltd, Mapleton Agri Biotech Pty Limited, Biomax, Lallemand Inc.
3. What are the main segments of the South America Biofertilizer Industry?
The market segments include Production Analysis, Consumption Analysis, Import Market Analysis (Value & Volume), Export Market Analysis (Value & Volume), Price Trend Analysis.
4. Can you provide details about the market size?
The market size is estimated to be USD XX Million as of 2022.
5. What are some drivers contributing to market growth?
Seed Treatment As A Solution To Enhance Yield; Growing Awareness For Seed Treatment Among The Farmers; Rising Trend Of Organic Farming.
6. What are the notable trends driving market growth?
Increased Practice Of Organic Farming.
7. Are there any restraints impacting market growth?
Limitations Across Farm-Level Seed Treatment; Rising Environmental Concerns.
8. Can you provide examples of recent developments in the market?
N/A
9. What pricing options are available for accessing the report?
Pricing options include single-user, multi-user, and enterprise licenses priced at USD 4750, USD 5250, and USD 8750 respectively.
10. Is the market size provided in terms of value or volume?
The market size is provided in terms of value, measured in Million.
11. Are there any specific market keywords associated with the report?
Yes, the market keyword associated with the report is "South America Biofertilizer Industry," which aids in identifying and referencing the specific market segment covered.
12. How do I determine which pricing option suits my needs best?
The pricing options vary based on user requirements and access needs. Individual users may opt for single-user licenses, while businesses requiring broader access may choose multi-user or enterprise licenses for cost-effective access to the report.
13. Are there any additional resources or data provided in the South America Biofertilizer Industry report?
While the report offers comprehensive insights, it's advisable to review the specific contents or supplementary materials provided to ascertain if additional resources or data are available.
14. How can I stay updated on further developments or reports in the South America Biofertilizer Industry?
To stay informed about further developments, trends, and reports in the South America Biofertilizer Industry, consider subscribing to industry newsletters, following relevant companies and organizations, or regularly checking reputable industry news sources and publications.
Methodology
Step 1 - Identification of Relevant Samples Size from Population Database


Step 2 - Approaches for Defining Global Market Size (Value, Volume* & Price*)

Note*: In applicable scenarios
Step 3 - Data Sources
Primary Research
- Web Analytics
- Survey Reports
- Research Institute
- Latest Research Reports
- Opinion Leaders
Secondary Research
- Annual Reports
- White Paper
- Latest Press Release
- Industry Association
- Paid Database
- Investor Presentations

Step 4 - Data Triangulation
Involves using different sources of information in order to increase the validity of a study
These sources are likely to be stakeholders in a program - participants, other researchers, program staff, other community members, and so on.
Then we put all data in single framework & apply various statistical tools to find out the dynamic on the market.
During the analysis stage, feedback from the stakeholder groups would be compared to determine areas of agreement as well as areas of divergence


