Solar Energy Market 2025-2033 Trends: Unveiling Growth Opportunities and Competitor Dynamics

Solar Energy Market by Production Analysis, by Consumption Analysis, by Import Market Analysis (Value & Volume), by Export Market Analysis (Value & Volume), by Price Trend Analysis, by North America (United States, Mexico, Canada, Rest of North America), by Europe (Germany, Spain, Italy, United Kingdom, France, NORDIC, Turkey, Russia, Rest of Europe), by Asia Pacific (China, India, Japan, Australia, Vietnam, South Korea, Malaysia, Thailand, Indonesia, Rest of Asia pacific), by South America (Brazil, Argentina, Chile, Colombia, Rest of South America), by Middle East and Africa (Saudi Arabia, United Arab Emirates, Egypt, Nigeria, South Africa, Middle East and Africa) Forecast 2025-2033

Jun 24 2025
Base Year: 2024

234 Pages
Main Logo

Solar Energy Market 2025-2033 Trends: Unveiling Growth Opportunities and Competitor Dynamics


Home
Industries
Energy & Power
sponsor image
sponsor image
sponsor image
sponsor image
sponsor image

Tailored for you

  • In-depth Analysis Tailored to Specified Regions or Segments
  • Company Profiles Customized to User Preferences
  • Comprehensive Insights Focused on Specific Segments or Regions
  • Customized Evaluation of Competitive Landscape to Meet Your Needs
  • Tailored Customization to Address Other Specific Requirements
Ask for customization


Key Insights

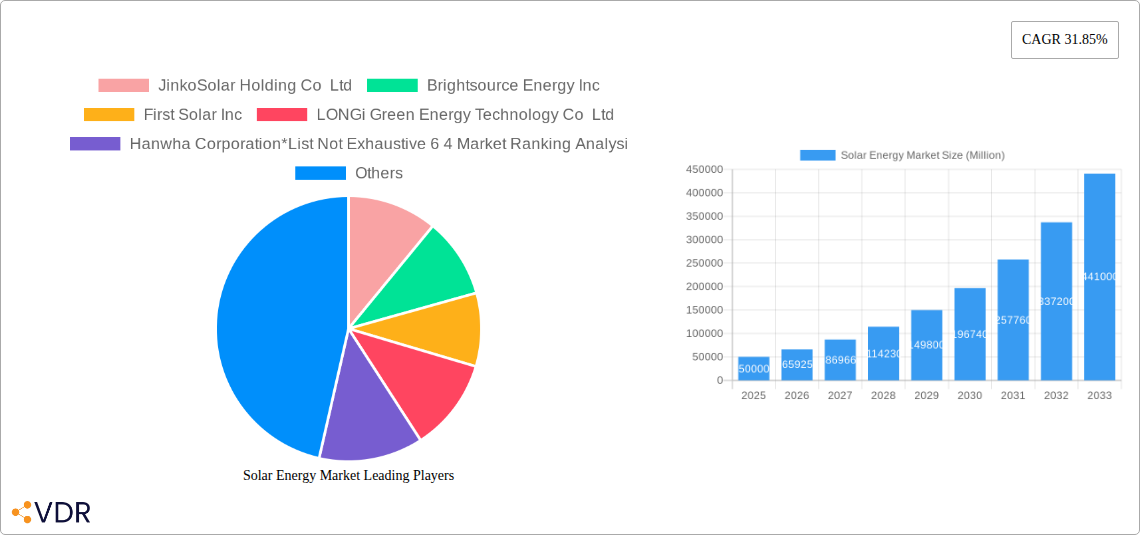
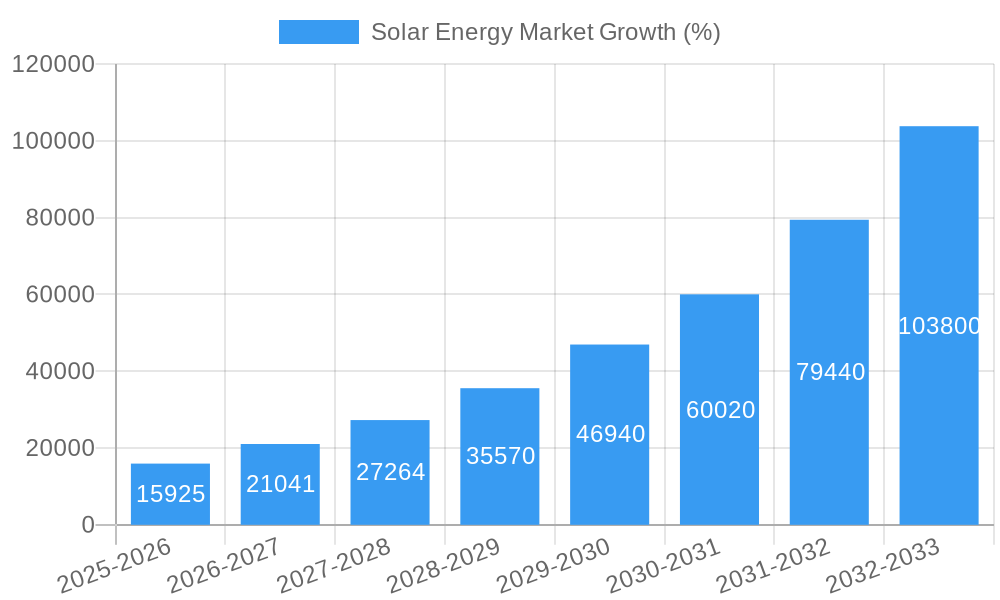
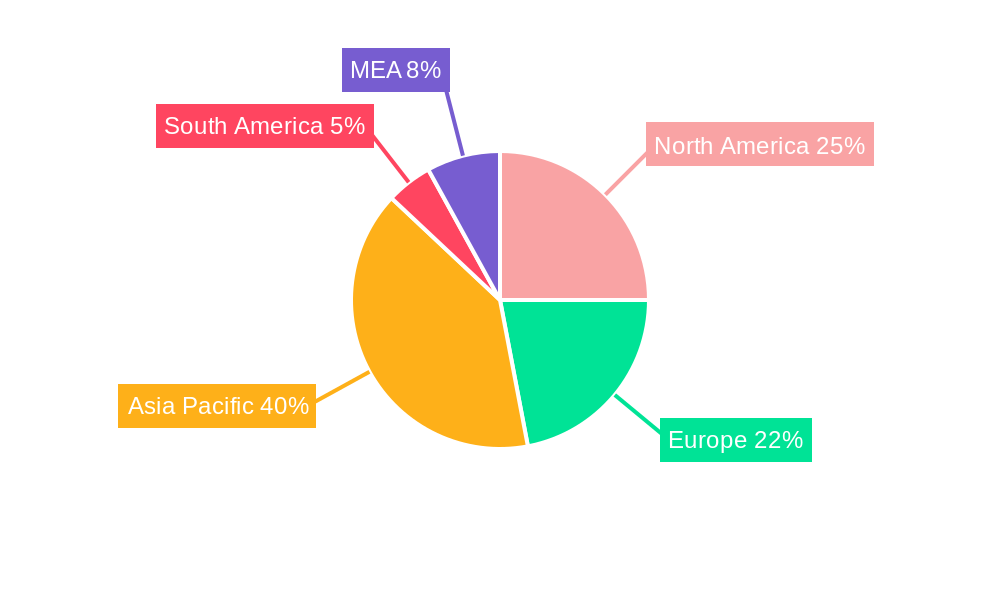
The global solar energy market is experiencing robust growth, projected to reach a substantial size with a Compound Annual Growth Rate (CAGR) of 31.85% from 2025 to 2033. Several factors drive this expansion. Increasing concerns about climate change and the urgent need for renewable energy sources are fueling significant government investments in solar energy infrastructure and supportive policies. Technological advancements, resulting in more efficient and cost-effective solar panels (crystalline silicon and thin-film technologies), are further bolstering market penetration. The declining cost of solar energy systems makes them increasingly competitive with traditional energy sources, particularly in residential, commercial & industrial (C&I), and utility-scale deployments. Ground-mounted systems continue to dominate, but rooftop installations are also experiencing strong growth, particularly in densely populated areas. Major players like JinkoSolar, First Solar, LONGi Green Energy, and Trina Solar are driving innovation and market expansion through strategic partnerships, technological advancements, and aggressive expansion into new markets. Geographic growth is diversified, with North America, Europe, and Asia-Pacific leading the charge, fueled by strong government support and increasing consumer adoption. However, market restraints include intermittency issues, land availability constraints for large-scale projects, and the dependence on weather conditions. Despite these challenges, the long-term outlook for the solar energy market remains exceptionally positive, driven by the global imperative to transition towards sustainable energy solutions.

The market segmentation reveals diverse growth patterns. The crystalline silicon segment currently holds the largest market share due to its established technology and cost-effectiveness. However, thin-film technologies are gaining traction due to their flexibility and potential for higher efficiency. In terms of end-users, the utility-scale segment is the largest, driven by large-scale solar power plant installations. However, the residential and C&I segments are exhibiting rapid growth, driven by increasing consumer awareness and government incentives. Regional variations reflect differing levels of government support, technological infrastructure, and consumer adoption rates. North America and Europe benefit from well-established markets and supportive policy frameworks, while Asia-Pacific, particularly China, is experiencing explosive growth driven by substantial government investments and a massive domestic market. The competitive landscape is dynamic, with established players and emerging companies vying for market share through continuous innovation and strategic acquisitions. The forecast period promises substantial growth, driven by the continued fall in solar energy costs and increasing global demand for clean energy.

Solar Energy Market Research Report - Market Size, Growth & Forecast

Solar Energy Market: A Comprehensive Report (2019-2033)

This in-depth report provides a comprehensive analysis of the global solar energy market, encompassing its dynamics, growth trends, key players, and future outlook. The study period covers 2019-2033, with 2025 as the base and estimated year. We delve into parent markets (renewable energy) and child markets (residential, commercial & industrial, utility-scale solar) to offer a granular understanding of this rapidly evolving sector. The report’s findings are invaluable for investors, industry professionals, and policymakers seeking to navigate the complexities of the solar energy landscape. Expected market size values are presented in million units.

Solar Energy Market Dynamics & Structure

The solar energy market is characterized by increasing concentration among leading players, yet also significant fragmentation amongst smaller specialized companies. Technological innovation, particularly in areas like perovskite solar cells and improved efficiency of existing technologies, is a key driver. Stringent environmental regulations globally are pushing adoption, while government incentives and subsidies are further accelerating market growth. While competing energy sources (natural gas, fossil fuels) pose a challenge, their environmental impact offers a strong comparative advantage to solar power. Mergers and acquisitions (M&A) activity is significant, with larger players consolidating their market share.

  • Market Concentration: xx% held by top 5 players (2024).
  • Technological Innovation: Focus on efficiency improvements (xx% increase projected by 2033), and emerging technologies like perovskites.
  • Regulatory Frameworks: Government incentives driving adoption (xx Million USD in subsidies projected globally by 2030).
  • Competitive Substitutes: Natural gas and fossil fuels face increasing competition due to environmental concerns.
  • End-User Demographics: Shift towards larger-scale utility projects alongside residential and C&I growth.
  • M&A Trends: xx major deals in the last 5 years, indicating consolidation trends.

Solar Energy Market Growth Trends & Insights

The global solar energy market has witnessed exponential growth over the past decade, driven by decreasing costs, improved efficiency, and increasing environmental awareness. The market size has expanded from xx Million units in 2019 to xx Million units in 2024, with a Compound Annual Growth Rate (CAGR) of xx%. This growth trajectory is expected to continue throughout the forecast period (2025-2033), reaching xx Million units by 2033, driven by factors such as: increasing energy demand, supportive government policies, and technological advancements. Market penetration is also rising steadily, with solar energy accounting for a growing share of the global electricity generation mix. Consumer behavior is shifting towards renewable energy sources, further fueling market growth. Technological disruptions, such as the development of more efficient solar panels and energy storage solutions, are further accelerating market expansion.

Solar Energy Market Growth

Dominant Regions, Countries, or Segments in Solar Energy Market

China continues to dominate the global solar energy market, followed by the United States and India. The crystalline silicon segment holds the largest market share within the "Type" category, driven by its maturity and cost-effectiveness. The utility-scale segment under "End-User" dominates due to economies of scale and large-scale project deployments. Ground-mounted systems under "Deployment" remain the most prevalent installation type.

  • Key Drivers (China): Government support, strong manufacturing base, and large-scale projects.
  • Key Drivers (USA): Increasing renewable energy mandates and incentives, improving grid infrastructure.
  • Key Drivers (India): Rapid economic growth, rising energy demand, and government initiatives to boost renewable energy capacity.
  • Market Share (Crystalline Silicon): xx% (2024)
  • Market Share (Utility-Scale): xx% (2024)
  • Market Share (Ground-Mounted): xx% (2024)

Solar Energy Market Product Landscape

The solar energy market offers a diverse range of products, including crystalline silicon and thin-film solar panels. Recent innovations focus on increasing efficiency, improving durability, and reducing costs. Key performance metrics include energy conversion efficiency, power output, and lifespan. Unique selling propositions include higher energy yield, lower degradation rates, and improved aesthetics. Technological advancements have resulted in lighter, more flexible, and aesthetically pleasing solar panels, expanding their potential applications.

Key Drivers, Barriers & Challenges in Solar Energy Market

Key Drivers: Decreasing manufacturing costs, increasing government support through subsidies and mandates, growing environmental concerns, and advancements in energy storage technologies.

Key Challenges: Intermittency of solar power, land use requirements for large-scale projects, grid integration challenges, and dependence on raw materials (polysilicon). Supply chain disruptions have impacted manufacturing and installation, leading to project delays and increased costs (estimated xx% increase in project costs in 2023 due to supply chain issues).

Emerging Opportunities in Solar Energy Market

The floating solar power sector presents significant growth opportunities. Integration of solar energy into building designs (Building Integrated Photovoltaics - BIPV) offers aesthetic and economic advantages. Emerging markets in Africa and South America present untapped potential. The development of agrivoltaics, integrating agriculture and solar energy, could generate significant revenue streams while decreasing land use conflict.

Growth Accelerators in the Solar Energy Market Industry

Technological advancements, particularly in perovskite solar cells and tandem technology, promise significant efficiency gains. Strategic partnerships between solar energy companies and energy storage providers are streamlining energy supply and creating a more reliable energy solution. Expansion into developing economies offers substantial untapped potential, and policy-driven initiatives including tax incentives and carbon pricing continue to drive demand.

Key Players Shaping the Solar Energy Market Market

  • JinkoSolar Holding Co Ltd
  • Brightsource Energy Inc
  • First Solar Inc
  • LONGi Green Energy Technology Co Ltd
  • Hanwha Corporation
  • Trina Solar Co Ltd
  • Engie SA
  • NextEra Energy Inc
  • SunPower Corporation
  • REC Solar Holdings AS
  • Canadian Solar Inc
  • Sharp Corporation
  • Abengoa SA
  • JA Solar Holding
  • Acciona SA
  • ACWA Power

Notable Milestones in Solar Energy Market Sector

  • February 2024: ReNew Energy Global PLC and Sembcorp Industries Ltd collaborate on a USD 241 million, 350 MW solar energy project sale.
  • October 2023: SECI launches a tender for 1 GW of interstate grid-connected solar projects in India, signifying significant future growth.
  • March 2023: BELECTRIC Solar Ltd UK and NextEnergy Solar Fund sign a framework agreement for over 150 MWp in O&M services in the UK.

In-Depth Solar Energy Market Market Outlook

The future of the solar energy market is bright, with continued growth driven by technological innovation, supportive government policies, and increasing environmental awareness. Strategic partnerships and expansion into new markets will further fuel market expansion. The decreasing cost of solar energy, coupled with increasing energy demand, positions the solar energy market for sustained long-term growth and significant investment opportunities. The integration of smart technologies and energy storage solutions will improve grid stability and enhance solar energy’s overall appeal.

Solar Energy Market Segmentation

  • 1. Production Analysis
  • 2. Consumption Analysis
  • 3. Import Market Analysis (Value & Volume)
  • 4. Export Market Analysis (Value & Volume)
  • 5. Price Trend Analysis

Solar Energy Market Segmentation By Geography

  • 1. North America
    • 1.1. United States
    • 1.2. Mexico
    • 1.3. Canada
    • 1.4. Rest of North America
  • 2. Europe
    • 2.1. Germany
    • 2.2. Spain
    • 2.3. Italy
    • 2.4. United Kingdom
    • 2.5. France
    • 2.6. NORDIC
    • 2.7. Turkey
    • 2.8. Russia
    • 2.9. Rest of Europe
  • 3. Asia Pacific
    • 3.1. China
    • 3.2. India
    • 3.3. Japan
    • 3.4. Australia
    • 3.5. Vietnam
    • 3.6. South Korea
    • 3.7. Malaysia
    • 3.8. Thailand
    • 3.9. Indonesia
    • 3.10. Rest of Asia pacific
  • 4. South America
    • 4.1. Brazil
    • 4.2. Argentina
    • 4.3. Chile
    • 4.4. Colombia
    • 4.5. Rest of South America
  • 5. Middle East and Africa
    • 5.1. Saudi Arabia
    • 5.2. United Arab Emirates
    • 5.3. Egypt
    • 5.4. Nigeria
    • 5.5. South Africa
    • 5.6. Middle East and Africa
Solar Energy Market Regional Share


Solar Energy Market REPORT HIGHLIGHTS

AspectsDetails
Study Period 2019-2033
Base Year 2024
Estimated Year 2025
Forecast Period2025-2033
Historical Period2019-2024
Growth RateCAGR of 31.85% from 2019-2033
Segmentation
    • By Production Analysis
    • By Consumption Analysis
    • By Import Market Analysis (Value & Volume)
    • By Export Market Analysis (Value & Volume)
    • By Price Trend Analysis
  • By Geography
    • North America
      • United States
      • Mexico
      • Canada
      • Rest of North America
    • Europe
      • Germany
      • Spain
      • Italy
      • United Kingdom
      • France
      • NORDIC
      • Turkey
      • Russia
      • Rest of Europe
    • Asia Pacific
      • China
      • India
      • Japan
      • Australia
      • Vietnam
      • South Korea
      • Malaysia
      • Thailand
      • Indonesia
      • Rest of Asia pacific
    • South America
      • Brazil
      • Argentina
      • Chile
      • Colombia
      • Rest of South America
    • Middle East and Africa
      • Saudi Arabia
      • United Arab Emirates
      • Egypt
      • Nigeria
      • South Africa
      • Middle East and Africa


Table of Contents

  1. 1. Introduction
    • 1.1. Research Scope
    • 1.2. Market Segmentation
    • 1.3. Research Methodology
    • 1.4. Definitions and Assumptions
  2. 2. Executive Summary
    • 2.1. Introduction
  3. 3. Market Dynamics
    • 3.1. Introduction
      • 3.2. Market Drivers
        • 3.2.1. 4.; Government Incentives and Policies4.; Declining Price and Installation Cost of Solar PV Systems
      • 3.3. Market Restrains
        • 3.3.1. 4.; Rising Adoption of Alternate Clean Power Sources
      • 3.4. Market Trends
        • 3.4.1. Solar Photovoltaic (PV) Segment Expected to Dominate the Market
  4. 4. Market Factor Analysis
    • 4.1. Porters Five Forces
    • 4.2. Supply/Value Chain
    • 4.3. PESTEL analysis
    • 4.4. Market Entropy
    • 4.5. Patent/Trademark Analysis
  5. 5. Global Solar Energy Market Analysis, Insights and Forecast, 2019-2031
    • 5.1. Market Analysis, Insights and Forecast - by Production Analysis
      • 5.2. Market Analysis, Insights and Forecast - by Consumption Analysis
        • 5.3. Market Analysis, Insights and Forecast - by Import Market Analysis (Value & Volume)
          • 5.4. Market Analysis, Insights and Forecast - by Export Market Analysis (Value & Volume)
            • 5.5. Market Analysis, Insights and Forecast - by Price Trend Analysis
              • 5.6. Market Analysis, Insights and Forecast - by Region
                • 5.6.1. North America
                • 5.6.2. Europe
                • 5.6.3. Asia Pacific
                • 5.6.4. South America
                • 5.6.5. Middle East and Africa
            • 6. North America Solar Energy Market Analysis, Insights and Forecast, 2019-2031
              • 6.1. Market Analysis, Insights and Forecast - by Production Analysis
                • 6.2. Market Analysis, Insights and Forecast - by Consumption Analysis
                  • 6.3. Market Analysis, Insights and Forecast - by Import Market Analysis (Value & Volume)
                    • 6.4. Market Analysis, Insights and Forecast - by Export Market Analysis (Value & Volume)
                      • 6.5. Market Analysis, Insights and Forecast - by Price Trend Analysis
                      • 7. Europe Solar Energy Market Analysis, Insights and Forecast, 2019-2031
                        • 7.1. Market Analysis, Insights and Forecast - by Production Analysis
                          • 7.2. Market Analysis, Insights and Forecast - by Consumption Analysis
                            • 7.3. Market Analysis, Insights and Forecast - by Import Market Analysis (Value & Volume)
                              • 7.4. Market Analysis, Insights and Forecast - by Export Market Analysis (Value & Volume)
                                • 7.5. Market Analysis, Insights and Forecast - by Price Trend Analysis
                                • 8. Asia Pacific Solar Energy Market Analysis, Insights and Forecast, 2019-2031
                                  • 8.1. Market Analysis, Insights and Forecast - by Production Analysis
                                    • 8.2. Market Analysis, Insights and Forecast - by Consumption Analysis
                                      • 8.3. Market Analysis, Insights and Forecast - by Import Market Analysis (Value & Volume)
                                        • 8.4. Market Analysis, Insights and Forecast - by Export Market Analysis (Value & Volume)
                                          • 8.5. Market Analysis, Insights and Forecast - by Price Trend Analysis
                                          • 9. South America Solar Energy Market Analysis, Insights and Forecast, 2019-2031
                                            • 9.1. Market Analysis, Insights and Forecast - by Production Analysis
                                              • 9.2. Market Analysis, Insights and Forecast - by Consumption Analysis
                                                • 9.3. Market Analysis, Insights and Forecast - by Import Market Analysis (Value & Volume)
                                                  • 9.4. Market Analysis, Insights and Forecast - by Export Market Analysis (Value & Volume)
                                                    • 9.5. Market Analysis, Insights and Forecast - by Price Trend Analysis
                                                    • 10. Middle East and Africa Solar Energy Market Analysis, Insights and Forecast, 2019-2031
                                                      • 10.1. Market Analysis, Insights and Forecast - by Production Analysis
                                                        • 10.2. Market Analysis, Insights and Forecast - by Consumption Analysis
                                                          • 10.3. Market Analysis, Insights and Forecast - by Import Market Analysis (Value & Volume)
                                                            • 10.4. Market Analysis, Insights and Forecast - by Export Market Analysis (Value & Volume)
                                                              • 10.5. Market Analysis, Insights and Forecast - by Price Trend Analysis
                                                              • 11. North America Solar Energy Market Analysis, Insights and Forecast, 2019-2031
                                                                  • 11.1. Market Analysis, Insights and Forecast - By Country/Sub-region
                                                                    • 11.1.1 United States
                                                                    • 11.1.2 Canada
                                                                    • 11.1.3 Mexico
                                                              • 12. Europe Solar Energy Market Analysis, Insights and Forecast, 2019-2031
                                                                  • 12.1. Market Analysis, Insights and Forecast - By Country/Sub-region
                                                                    • 12.1.1 Germany
                                                                    • 12.1.2 United Kingdom
                                                                    • 12.1.3 France
                                                                    • 12.1.4 Spain
                                                                    • 12.1.5 Italy
                                                                    • 12.1.6 Spain
                                                                    • 12.1.7 Belgium
                                                                    • 12.1.8 Netherland
                                                                    • 12.1.9 Nordics
                                                                    • 12.1.10 Rest of Europe
                                                              • 13. Asia Pacific Solar Energy Market Analysis, Insights and Forecast, 2019-2031
                                                                  • 13.1. Market Analysis, Insights and Forecast - By Country/Sub-region
                                                                    • 13.1.1 China
                                                                    • 13.1.2 Japan
                                                                    • 13.1.3 India
                                                                    • 13.1.4 South Korea
                                                                    • 13.1.5 Southeast Asia
                                                                    • 13.1.6 Australia
                                                                    • 13.1.7 Indonesia
                                                                    • 13.1.8 Phillipes
                                                                    • 13.1.9 Singapore
                                                                    • 13.1.10 Thailandc
                                                                    • 13.1.11 Rest of Asia Pacific
                                                              • 14. South America Solar Energy Market Analysis, Insights and Forecast, 2019-2031
                                                                  • 14.1. Market Analysis, Insights and Forecast - By Country/Sub-region
                                                                    • 14.1.1 Brazil
                                                                    • 14.1.2 Argentina
                                                                    • 14.1.3 Peru
                                                                    • 14.1.4 Chile
                                                                    • 14.1.5 Colombia
                                                                    • 14.1.6 Ecuador
                                                                    • 14.1.7 Venezuela
                                                                    • 14.1.8 Rest of South America
                                                              • 15. North America Solar Energy Market Analysis, Insights and Forecast, 2019-2031
                                                                  • 15.1. Market Analysis, Insights and Forecast - By Country/Sub-region
                                                                    • 15.1.1 United States
                                                                    • 15.1.2 Canada
                                                                    • 15.1.3 Mexico
                                                              • 16. MEA Solar Energy Market Analysis, Insights and Forecast, 2019-2031
                                                                  • 16.1. Market Analysis, Insights and Forecast - By Country/Sub-region
                                                                    • 16.1.1 United Arab Emirates
                                                                    • 16.1.2 Saudi Arabia
                                                                    • 16.1.3 South Africa
                                                                    • 16.1.4 Rest of Middle East and Africa
                                                              • 17. Competitive Analysis
                                                                • 17.1. Global Market Share Analysis 2024
                                                                  • 17.2. Company Profiles
                                                                    • 17.2.1 JinkoSolar Holding Co Ltd
                                                                      • 17.2.1.1. Overview
                                                                      • 17.2.1.2. Products
                                                                      • 17.2.1.3. SWOT Analysis
                                                                      • 17.2.1.4. Recent Developments
                                                                      • 17.2.1.5. Financials (Based on Availability)
                                                                    • 17.2.2 Brightsource Energy Inc
                                                                      • 17.2.2.1. Overview
                                                                      • 17.2.2.2. Products
                                                                      • 17.2.2.3. SWOT Analysis
                                                                      • 17.2.2.4. Recent Developments
                                                                      • 17.2.2.5. Financials (Based on Availability)
                                                                    • 17.2.3 First Solar Inc
                                                                      • 17.2.3.1. Overview
                                                                      • 17.2.3.2. Products
                                                                      • 17.2.3.3. SWOT Analysis
                                                                      • 17.2.3.4. Recent Developments
                                                                      • 17.2.3.5. Financials (Based on Availability)
                                                                    • 17.2.4 LONGi Green Energy Technology Co Ltd
                                                                      • 17.2.4.1. Overview
                                                                      • 17.2.4.2. Products
                                                                      • 17.2.4.3. SWOT Analysis
                                                                      • 17.2.4.4. Recent Developments
                                                                      • 17.2.4.5. Financials (Based on Availability)
                                                                    • 17.2.5 Hanwha Corporation*List Not Exhaustive 6 4 Market Ranking Analysi
                                                                      • 17.2.5.1. Overview
                                                                      • 17.2.5.2. Products
                                                                      • 17.2.5.3. SWOT Analysis
                                                                      • 17.2.5.4. Recent Developments
                                                                      • 17.2.5.5. Financials (Based on Availability)
                                                                    • 17.2.6 Trina Solar Co Ltd
                                                                      • 17.2.6.1. Overview
                                                                      • 17.2.6.2. Products
                                                                      • 17.2.6.3. SWOT Analysis
                                                                      • 17.2.6.4. Recent Developments
                                                                      • 17.2.6.5. Financials (Based on Availability)
                                                                    • 17.2.7 Engie SA
                                                                      • 17.2.7.1. Overview
                                                                      • 17.2.7.2. Products
                                                                      • 17.2.7.3. SWOT Analysis
                                                                      • 17.2.7.4. Recent Developments
                                                                      • 17.2.7.5. Financials (Based on Availability)
                                                                    • 17.2.8 NextEra Energy Inc
                                                                      • 17.2.8.1. Overview
                                                                      • 17.2.8.2. Products
                                                                      • 17.2.8.3. SWOT Analysis
                                                                      • 17.2.8.4. Recent Developments
                                                                      • 17.2.8.5. Financials (Based on Availability)
                                                                    • 17.2.9 SunPower Corporation
                                                                      • 17.2.9.1. Overview
                                                                      • 17.2.9.2. Products
                                                                      • 17.2.9.3. SWOT Analysis
                                                                      • 17.2.9.4. Recent Developments
                                                                      • 17.2.9.5. Financials (Based on Availability)
                                                                    • 17.2.10 REC Solar Holdings AS
                                                                      • 17.2.10.1. Overview
                                                                      • 17.2.10.2. Products
                                                                      • 17.2.10.3. SWOT Analysis
                                                                      • 17.2.10.4. Recent Developments
                                                                      • 17.2.10.5. Financials (Based on Availability)
                                                                    • 17.2.11 Canadian Solar Inc
                                                                      • 17.2.11.1. Overview
                                                                      • 17.2.11.2. Products
                                                                      • 17.2.11.3. SWOT Analysis
                                                                      • 17.2.11.4. Recent Developments
                                                                      • 17.2.11.5. Financials (Based on Availability)
                                                                    • 17.2.12 Sharp Corporation
                                                                      • 17.2.12.1. Overview
                                                                      • 17.2.12.2. Products
                                                                      • 17.2.12.3. SWOT Analysis
                                                                      • 17.2.12.4. Recent Developments
                                                                      • 17.2.12.5. Financials (Based on Availability)
                                                                    • 17.2.13 Abengoa SA
                                                                      • 17.2.13.1. Overview
                                                                      • 17.2.13.2. Products
                                                                      • 17.2.13.3. SWOT Analysis
                                                                      • 17.2.13.4. Recent Developments
                                                                      • 17.2.13.5. Financials (Based on Availability)
                                                                    • 17.2.14 JA Solar Holding
                                                                      • 17.2.14.1. Overview
                                                                      • 17.2.14.2. Products
                                                                      • 17.2.14.3. SWOT Analysis
                                                                      • 17.2.14.4. Recent Developments
                                                                      • 17.2.14.5. Financials (Based on Availability)
                                                                    • 17.2.15 Acciona SA
                                                                      • 17.2.15.1. Overview
                                                                      • 17.2.15.2. Products
                                                                      • 17.2.15.3. SWOT Analysis
                                                                      • 17.2.15.4. Recent Developments
                                                                      • 17.2.15.5. Financials (Based on Availability)
                                                                    • 17.2.16 ACWA Power
                                                                      • 17.2.16.1. Overview
                                                                      • 17.2.16.2. Products
                                                                      • 17.2.16.3. SWOT Analysis
                                                                      • 17.2.16.4. Recent Developments
                                                                      • 17.2.16.5. Financials (Based on Availability)

                                                              List of Figures

                                                              1. Figure 1: Global Solar Energy Market Revenue Breakdown (Million, %) by Region 2024 & 2032
                                                              2. Figure 2: Global Solar Energy Market Volume Breakdown (Thousand, %) by Region 2024 & 2032
                                                              3. Figure 3: North America Solar Energy Market Revenue (Million), by Country 2024 & 2032
                                                              4. Figure 4: North America Solar Energy Market Volume (Thousand), by Country 2024 & 2032
                                                              5. Figure 5: North America Solar Energy Market Revenue Share (%), by Country 2024 & 2032
                                                              6. Figure 6: North America Solar Energy Market Volume Share (%), by Country 2024 & 2032
                                                              7. Figure 7: Europe Solar Energy Market Revenue (Million), by Country 2024 & 2032
                                                              8. Figure 8: Europe Solar Energy Market Volume (Thousand), by Country 2024 & 2032
                                                              9. Figure 9: Europe Solar Energy Market Revenue Share (%), by Country 2024 & 2032
                                                              10. Figure 10: Europe Solar Energy Market Volume Share (%), by Country 2024 & 2032
                                                              11. Figure 11: Asia Pacific Solar Energy Market Revenue (Million), by Country 2024 & 2032
                                                              12. Figure 12: Asia Pacific Solar Energy Market Volume (Thousand), by Country 2024 & 2032
                                                              13. Figure 13: Asia Pacific Solar Energy Market Revenue Share (%), by Country 2024 & 2032
                                                              14. Figure 14: Asia Pacific Solar Energy Market Volume Share (%), by Country 2024 & 2032
                                                              15. Figure 15: South America Solar Energy Market Revenue (Million), by Country 2024 & 2032
                                                              16. Figure 16: South America Solar Energy Market Volume (Thousand), by Country 2024 & 2032
                                                              17. Figure 17: South America Solar Energy Market Revenue Share (%), by Country 2024 & 2032
                                                              18. Figure 18: South America Solar Energy Market Volume Share (%), by Country 2024 & 2032
                                                              19. Figure 19: North America Solar Energy Market Revenue (Million), by Country 2024 & 2032
                                                              20. Figure 20: North America Solar Energy Market Volume (Thousand), by Country 2024 & 2032
                                                              21. Figure 21: North America Solar Energy Market Revenue Share (%), by Country 2024 & 2032
                                                              22. Figure 22: North America Solar Energy Market Volume Share (%), by Country 2024 & 2032
                                                              23. Figure 23: MEA Solar Energy Market Revenue (Million), by Country 2024 & 2032
                                                              24. Figure 24: MEA Solar Energy Market Volume (Thousand), by Country 2024 & 2032
                                                              25. Figure 25: MEA Solar Energy Market Revenue Share (%), by Country 2024 & 2032
                                                              26. Figure 26: MEA Solar Energy Market Volume Share (%), by Country 2024 & 2032
                                                              27. Figure 27: North America Solar Energy Market Revenue (Million), by Production Analysis 2024 & 2032
                                                              28. Figure 28: North America Solar Energy Market Volume (Thousand), by Production Analysis 2024 & 2032
                                                              29. Figure 29: North America Solar Energy Market Revenue Share (%), by Production Analysis 2024 & 2032
                                                              30. Figure 30: North America Solar Energy Market Volume Share (%), by Production Analysis 2024 & 2032
                                                              31. Figure 31: North America Solar Energy Market Revenue (Million), by Consumption Analysis 2024 & 2032
                                                              32. Figure 32: North America Solar Energy Market Volume (Thousand), by Consumption Analysis 2024 & 2032
                                                              33. Figure 33: North America Solar Energy Market Revenue Share (%), by Consumption Analysis 2024 & 2032
                                                              34. Figure 34: North America Solar Energy Market Volume Share (%), by Consumption Analysis 2024 & 2032
                                                              35. Figure 35: North America Solar Energy Market Revenue (Million), by Import Market Analysis (Value & Volume) 2024 & 2032
                                                              36. Figure 36: North America Solar Energy Market Volume (Thousand), by Import Market Analysis (Value & Volume) 2024 & 2032
                                                              37. Figure 37: North America Solar Energy Market Revenue Share (%), by Import Market Analysis (Value & Volume) 2024 & 2032
                                                              38. Figure 38: North America Solar Energy Market Volume Share (%), by Import Market Analysis (Value & Volume) 2024 & 2032
                                                              39. Figure 39: North America Solar Energy Market Revenue (Million), by Export Market Analysis (Value & Volume) 2024 & 2032
                                                              40. Figure 40: North America Solar Energy Market Volume (Thousand), by Export Market Analysis (Value & Volume) 2024 & 2032
                                                              41. Figure 41: North America Solar Energy Market Revenue Share (%), by Export Market Analysis (Value & Volume) 2024 & 2032
                                                              42. Figure 42: North America Solar Energy Market Volume Share (%), by Export Market Analysis (Value & Volume) 2024 & 2032
                                                              43. Figure 43: North America Solar Energy Market Revenue (Million), by Price Trend Analysis 2024 & 2032
                                                              44. Figure 44: North America Solar Energy Market Volume (Thousand), by Price Trend Analysis 2024 & 2032
                                                              45. Figure 45: North America Solar Energy Market Revenue Share (%), by Price Trend Analysis 2024 & 2032
                                                              46. Figure 46: North America Solar Energy Market Volume Share (%), by Price Trend Analysis 2024 & 2032
                                                              47. Figure 47: North America Solar Energy Market Revenue (Million), by Country 2024 & 2032
                                                              48. Figure 48: North America Solar Energy Market Volume (Thousand), by Country 2024 & 2032
                                                              49. Figure 49: North America Solar Energy Market Revenue Share (%), by Country 2024 & 2032
                                                              50. Figure 50: North America Solar Energy Market Volume Share (%), by Country 2024 & 2032
                                                              51. Figure 51: Europe Solar Energy Market Revenue (Million), by Production Analysis 2024 & 2032
                                                              52. Figure 52: Europe Solar Energy Market Volume (Thousand), by Production Analysis 2024 & 2032
                                                              53. Figure 53: Europe Solar Energy Market Revenue Share (%), by Production Analysis 2024 & 2032
                                                              54. Figure 54: Europe Solar Energy Market Volume Share (%), by Production Analysis 2024 & 2032
                                                              55. Figure 55: Europe Solar Energy Market Revenue (Million), by Consumption Analysis 2024 & 2032
                                                              56. Figure 56: Europe Solar Energy Market Volume (Thousand), by Consumption Analysis 2024 & 2032
                                                              57. Figure 57: Europe Solar Energy Market Revenue Share (%), by Consumption Analysis 2024 & 2032
                                                              58. Figure 58: Europe Solar Energy Market Volume Share (%), by Consumption Analysis 2024 & 2032
                                                              59. Figure 59: Europe Solar Energy Market Revenue (Million), by Import Market Analysis (Value & Volume) 2024 & 2032
                                                              60. Figure 60: Europe Solar Energy Market Volume (Thousand), by Import Market Analysis (Value & Volume) 2024 & 2032
                                                              61. Figure 61: Europe Solar Energy Market Revenue Share (%), by Import Market Analysis (Value & Volume) 2024 & 2032
                                                              62. Figure 62: Europe Solar Energy Market Volume Share (%), by Import Market Analysis (Value & Volume) 2024 & 2032
                                                              63. Figure 63: Europe Solar Energy Market Revenue (Million), by Export Market Analysis (Value & Volume) 2024 & 2032
                                                              64. Figure 64: Europe Solar Energy Market Volume (Thousand), by Export Market Analysis (Value & Volume) 2024 & 2032
                                                              65. Figure 65: Europe Solar Energy Market Revenue Share (%), by Export Market Analysis (Value & Volume) 2024 & 2032
                                                              66. Figure 66: Europe Solar Energy Market Volume Share (%), by Export Market Analysis (Value & Volume) 2024 & 2032
                                                              67. Figure 67: Europe Solar Energy Market Revenue (Million), by Price Trend Analysis 2024 & 2032
                                                              68. Figure 68: Europe Solar Energy Market Volume (Thousand), by Price Trend Analysis 2024 & 2032
                                                              69. Figure 69: Europe Solar Energy Market Revenue Share (%), by Price Trend Analysis 2024 & 2032
                                                              70. Figure 70: Europe Solar Energy Market Volume Share (%), by Price Trend Analysis 2024 & 2032
                                                              71. Figure 71: Europe Solar Energy Market Revenue (Million), by Country 2024 & 2032
                                                              72. Figure 72: Europe Solar Energy Market Volume (Thousand), by Country 2024 & 2032
                                                              73. Figure 73: Europe Solar Energy Market Revenue Share (%), by Country 2024 & 2032
                                                              74. Figure 74: Europe Solar Energy Market Volume Share (%), by Country 2024 & 2032
                                                              75. Figure 75: Asia Pacific Solar Energy Market Revenue (Million), by Production Analysis 2024 & 2032
                                                              76. Figure 76: Asia Pacific Solar Energy Market Volume (Thousand), by Production Analysis 2024 & 2032
                                                              77. Figure 77: Asia Pacific Solar Energy Market Revenue Share (%), by Production Analysis 2024 & 2032
                                                              78. Figure 78: Asia Pacific Solar Energy Market Volume Share (%), by Production Analysis 2024 & 2032
                                                              79. Figure 79: Asia Pacific Solar Energy Market Revenue (Million), by Consumption Analysis 2024 & 2032
                                                              80. Figure 80: Asia Pacific Solar Energy Market Volume (Thousand), by Consumption Analysis 2024 & 2032
                                                              81. Figure 81: Asia Pacific Solar Energy Market Revenue Share (%), by Consumption Analysis 2024 & 2032
                                                              82. Figure 82: Asia Pacific Solar Energy Market Volume Share (%), by Consumption Analysis 2024 & 2032
                                                              83. Figure 83: Asia Pacific Solar Energy Market Revenue (Million), by Import Market Analysis (Value & Volume) 2024 & 2032
                                                              84. Figure 84: Asia Pacific Solar Energy Market Volume (Thousand), by Import Market Analysis (Value & Volume) 2024 & 2032
                                                              85. Figure 85: Asia Pacific Solar Energy Market Revenue Share (%), by Import Market Analysis (Value & Volume) 2024 & 2032
                                                              86. Figure 86: Asia Pacific Solar Energy Market Volume Share (%), by Import Market Analysis (Value & Volume) 2024 & 2032
                                                              87. Figure 87: Asia Pacific Solar Energy Market Revenue (Million), by Export Market Analysis (Value & Volume) 2024 & 2032
                                                              88. Figure 88: Asia Pacific Solar Energy Market Volume (Thousand), by Export Market Analysis (Value & Volume) 2024 & 2032
                                                              89. Figure 89: Asia Pacific Solar Energy Market Revenue Share (%), by Export Market Analysis (Value & Volume) 2024 & 2032
                                                              90. Figure 90: Asia Pacific Solar Energy Market Volume Share (%), by Export Market Analysis (Value & Volume) 2024 & 2032
                                                              91. Figure 91: Asia Pacific Solar Energy Market Revenue (Million), by Price Trend Analysis 2024 & 2032
                                                              92. Figure 92: Asia Pacific Solar Energy Market Volume (Thousand), by Price Trend Analysis 2024 & 2032
                                                              93. Figure 93: Asia Pacific Solar Energy Market Revenue Share (%), by Price Trend Analysis 2024 & 2032
                                                              94. Figure 94: Asia Pacific Solar Energy Market Volume Share (%), by Price Trend Analysis 2024 & 2032
                                                              95. Figure 95: Asia Pacific Solar Energy Market Revenue (Million), by Country 2024 & 2032
                                                              96. Figure 96: Asia Pacific Solar Energy Market Volume (Thousand), by Country 2024 & 2032
                                                              97. Figure 97: Asia Pacific Solar Energy Market Revenue Share (%), by Country 2024 & 2032
                                                              98. Figure 98: Asia Pacific Solar Energy Market Volume Share (%), by Country 2024 & 2032
                                                              99. Figure 99: South America Solar Energy Market Revenue (Million), by Production Analysis 2024 & 2032
                                                              100. Figure 100: South America Solar Energy Market Volume (Thousand), by Production Analysis 2024 & 2032
                                                              101. Figure 101: South America Solar Energy Market Revenue Share (%), by Production Analysis 2024 & 2032
                                                              102. Figure 102: South America Solar Energy Market Volume Share (%), by Production Analysis 2024 & 2032
                                                              103. Figure 103: South America Solar Energy Market Revenue (Million), by Consumption Analysis 2024 & 2032
                                                              104. Figure 104: South America Solar Energy Market Volume (Thousand), by Consumption Analysis 2024 & 2032
                                                              105. Figure 105: South America Solar Energy Market Revenue Share (%), by Consumption Analysis 2024 & 2032
                                                              106. Figure 106: South America Solar Energy Market Volume Share (%), by Consumption Analysis 2024 & 2032
                                                              107. Figure 107: South America Solar Energy Market Revenue (Million), by Import Market Analysis (Value & Volume) 2024 & 2032
                                                              108. Figure 108: South America Solar Energy Market Volume (Thousand), by Import Market Analysis (Value & Volume) 2024 & 2032
                                                              109. Figure 109: South America Solar Energy Market Revenue Share (%), by Import Market Analysis (Value & Volume) 2024 & 2032
                                                              110. Figure 110: South America Solar Energy Market Volume Share (%), by Import Market Analysis (Value & Volume) 2024 & 2032
                                                              111. Figure 111: South America Solar Energy Market Revenue (Million), by Export Market Analysis (Value & Volume) 2024 & 2032
                                                              112. Figure 112: South America Solar Energy Market Volume (Thousand), by Export Market Analysis (Value & Volume) 2024 & 2032
                                                              113. Figure 113: South America Solar Energy Market Revenue Share (%), by Export Market Analysis (Value & Volume) 2024 & 2032
                                                              114. Figure 114: South America Solar Energy Market Volume Share (%), by Export Market Analysis (Value & Volume) 2024 & 2032
                                                              115. Figure 115: South America Solar Energy Market Revenue (Million), by Price Trend Analysis 2024 & 2032
                                                              116. Figure 116: South America Solar Energy Market Volume (Thousand), by Price Trend Analysis 2024 & 2032
                                                              117. Figure 117: South America Solar Energy Market Revenue Share (%), by Price Trend Analysis 2024 & 2032
                                                              118. Figure 118: South America Solar Energy Market Volume Share (%), by Price Trend Analysis 2024 & 2032
                                                              119. Figure 119: South America Solar Energy Market Revenue (Million), by Country 2024 & 2032
                                                              120. Figure 120: South America Solar Energy Market Volume (Thousand), by Country 2024 & 2032
                                                              121. Figure 121: South America Solar Energy Market Revenue Share (%), by Country 2024 & 2032
                                                              122. Figure 122: South America Solar Energy Market Volume Share (%), by Country 2024 & 2032
                                                              123. Figure 123: Middle East and Africa Solar Energy Market Revenue (Million), by Production Analysis 2024 & 2032
                                                              124. Figure 124: Middle East and Africa Solar Energy Market Volume (Thousand), by Production Analysis 2024 & 2032
                                                              125. Figure 125: Middle East and Africa Solar Energy Market Revenue Share (%), by Production Analysis 2024 & 2032
                                                              126. Figure 126: Middle East and Africa Solar Energy Market Volume Share (%), by Production Analysis 2024 & 2032
                                                              127. Figure 127: Middle East and Africa Solar Energy Market Revenue (Million), by Consumption Analysis 2024 & 2032
                                                              128. Figure 128: Middle East and Africa Solar Energy Market Volume (Thousand), by Consumption Analysis 2024 & 2032
                                                              129. Figure 129: Middle East and Africa Solar Energy Market Revenue Share (%), by Consumption Analysis 2024 & 2032
                                                              130. Figure 130: Middle East and Africa Solar Energy Market Volume Share (%), by Consumption Analysis 2024 & 2032
                                                              131. Figure 131: Middle East and Africa Solar Energy Market Revenue (Million), by Import Market Analysis (Value & Volume) 2024 & 2032
                                                              132. Figure 132: Middle East and Africa Solar Energy Market Volume (Thousand), by Import Market Analysis (Value & Volume) 2024 & 2032
                                                              133. Figure 133: Middle East and Africa Solar Energy Market Revenue Share (%), by Import Market Analysis (Value & Volume) 2024 & 2032
                                                              134. Figure 134: Middle East and Africa Solar Energy Market Volume Share (%), by Import Market Analysis (Value & Volume) 2024 & 2032
                                                              135. Figure 135: Middle East and Africa Solar Energy Market Revenue (Million), by Export Market Analysis (Value & Volume) 2024 & 2032
                                                              136. Figure 136: Middle East and Africa Solar Energy Market Volume (Thousand), by Export Market Analysis (Value & Volume) 2024 & 2032
                                                              137. Figure 137: Middle East and Africa Solar Energy Market Revenue Share (%), by Export Market Analysis (Value & Volume) 2024 & 2032
                                                              138. Figure 138: Middle East and Africa Solar Energy Market Volume Share (%), by Export Market Analysis (Value & Volume) 2024 & 2032
                                                              139. Figure 139: Middle East and Africa Solar Energy Market Revenue (Million), by Price Trend Analysis 2024 & 2032
                                                              140. Figure 140: Middle East and Africa Solar Energy Market Volume (Thousand), by Price Trend Analysis 2024 & 2032
                                                              141. Figure 141: Middle East and Africa Solar Energy Market Revenue Share (%), by Price Trend Analysis 2024 & 2032
                                                              142. Figure 142: Middle East and Africa Solar Energy Market Volume Share (%), by Price Trend Analysis 2024 & 2032
                                                              143. Figure 143: Middle East and Africa Solar Energy Market Revenue (Million), by Country 2024 & 2032
                                                              144. Figure 144: Middle East and Africa Solar Energy Market Volume (Thousand), by Country 2024 & 2032
                                                              145. Figure 145: Middle East and Africa Solar Energy Market Revenue Share (%), by Country 2024 & 2032
                                                              146. Figure 146: Middle East and Africa Solar Energy Market Volume Share (%), by Country 2024 & 2032

                                                              List of Tables

                                                              1. Table 1: Global Solar Energy Market Revenue Million Forecast, by Region 2019 & 2032
                                                              2. Table 2: Global Solar Energy Market Volume Thousand Forecast, by Region 2019 & 2032
                                                              3. Table 3: Global Solar Energy Market Revenue Million Forecast, by Production Analysis 2019 & 2032
                                                              4. Table 4: Global Solar Energy Market Volume Thousand Forecast, by Production Analysis 2019 & 2032
                                                              5. Table 5: Global Solar Energy Market Revenue Million Forecast, by Consumption Analysis 2019 & 2032
                                                              6. Table 6: Global Solar Energy Market Volume Thousand Forecast, by Consumption Analysis 2019 & 2032
                                                              7. Table 7: Global Solar Energy Market Revenue Million Forecast, by Import Market Analysis (Value & Volume) 2019 & 2032
                                                              8. Table 8: Global Solar Energy Market Volume Thousand Forecast, by Import Market Analysis (Value & Volume) 2019 & 2032
                                                              9. Table 9: Global Solar Energy Market Revenue Million Forecast, by Export Market Analysis (Value & Volume) 2019 & 2032
                                                              10. Table 10: Global Solar Energy Market Volume Thousand Forecast, by Export Market Analysis (Value & Volume) 2019 & 2032
                                                              11. Table 11: Global Solar Energy Market Revenue Million Forecast, by Price Trend Analysis 2019 & 2032
                                                              12. Table 12: Global Solar Energy Market Volume Thousand Forecast, by Price Trend Analysis 2019 & 2032
                                                              13. Table 13: Global Solar Energy Market Revenue Million Forecast, by Region 2019 & 2032
                                                              14. Table 14: Global Solar Energy Market Volume Thousand Forecast, by Region 2019 & 2032
                                                              15. Table 15: Global Solar Energy Market Revenue Million Forecast, by Country 2019 & 2032
                                                              16. Table 16: Global Solar Energy Market Volume Thousand Forecast, by Country 2019 & 2032
                                                              17. Table 17: United States Solar Energy Market Revenue (Million) Forecast, by Application 2019 & 2032
                                                              18. Table 18: United States Solar Energy Market Volume (Thousand) Forecast, by Application 2019 & 2032
                                                              19. Table 19: Canada Solar Energy Market Revenue (Million) Forecast, by Application 2019 & 2032
                                                              20. Table 20: Canada Solar Energy Market Volume (Thousand) Forecast, by Application 2019 & 2032
                                                              21. Table 21: Mexico Solar Energy Market Revenue (Million) Forecast, by Application 2019 & 2032
                                                              22. Table 22: Mexico Solar Energy Market Volume (Thousand) Forecast, by Application 2019 & 2032
                                                              23. Table 23: Global Solar Energy Market Revenue Million Forecast, by Country 2019 & 2032
                                                              24. Table 24: Global Solar Energy Market Volume Thousand Forecast, by Country 2019 & 2032
                                                              25. Table 25: Germany Solar Energy Market Revenue (Million) Forecast, by Application 2019 & 2032
                                                              26. Table 26: Germany Solar Energy Market Volume (Thousand) Forecast, by Application 2019 & 2032
                                                              27. Table 27: United Kingdom Solar Energy Market Revenue (Million) Forecast, by Application 2019 & 2032
                                                              28. Table 28: United Kingdom Solar Energy Market Volume (Thousand) Forecast, by Application 2019 & 2032
                                                              29. Table 29: France Solar Energy Market Revenue (Million) Forecast, by Application 2019 & 2032
                                                              30. Table 30: France Solar Energy Market Volume (Thousand) Forecast, by Application 2019 & 2032
                                                              31. Table 31: Spain Solar Energy Market Revenue (Million) Forecast, by Application 2019 & 2032
                                                              32. Table 32: Spain Solar Energy Market Volume (Thousand) Forecast, by Application 2019 & 2032
                                                              33. Table 33: Italy Solar Energy Market Revenue (Million) Forecast, by Application 2019 & 2032
                                                              34. Table 34: Italy Solar Energy Market Volume (Thousand) Forecast, by Application 2019 & 2032
                                                              35. Table 35: Spain Solar Energy Market Revenue (Million) Forecast, by Application 2019 & 2032
                                                              36. Table 36: Spain Solar Energy Market Volume (Thousand) Forecast, by Application 2019 & 2032
                                                              37. Table 37: Belgium Solar Energy Market Revenue (Million) Forecast, by Application 2019 & 2032
                                                              38. Table 38: Belgium Solar Energy Market Volume (Thousand) Forecast, by Application 2019 & 2032
                                                              39. Table 39: Netherland Solar Energy Market Revenue (Million) Forecast, by Application 2019 & 2032
                                                              40. Table 40: Netherland Solar Energy Market Volume (Thousand) Forecast, by Application 2019 & 2032
                                                              41. Table 41: Nordics Solar Energy Market Revenue (Million) Forecast, by Application 2019 & 2032
                                                              42. Table 42: Nordics Solar Energy Market Volume (Thousand) Forecast, by Application 2019 & 2032
                                                              43. Table 43: Rest of Europe Solar Energy Market Revenue (Million) Forecast, by Application 2019 & 2032
                                                              44. Table 44: Rest of Europe Solar Energy Market Volume (Thousand) Forecast, by Application 2019 & 2032
                                                              45. Table 45: Global Solar Energy Market Revenue Million Forecast, by Country 2019 & 2032
                                                              46. Table 46: Global Solar Energy Market Volume Thousand Forecast, by Country 2019 & 2032
                                                              47. Table 47: China Solar Energy Market Revenue (Million) Forecast, by Application 2019 & 2032
                                                              48. Table 48: China Solar Energy Market Volume (Thousand) Forecast, by Application 2019 & 2032
                                                              49. Table 49: Japan Solar Energy Market Revenue (Million) Forecast, by Application 2019 & 2032
                                                              50. Table 50: Japan Solar Energy Market Volume (Thousand) Forecast, by Application 2019 & 2032
                                                              51. Table 51: India Solar Energy Market Revenue (Million) Forecast, by Application 2019 & 2032
                                                              52. Table 52: India Solar Energy Market Volume (Thousand) Forecast, by Application 2019 & 2032
                                                              53. Table 53: South Korea Solar Energy Market Revenue (Million) Forecast, by Application 2019 & 2032
                                                              54. Table 54: South Korea Solar Energy Market Volume (Thousand) Forecast, by Application 2019 & 2032
                                                              55. Table 55: Southeast Asia Solar Energy Market Revenue (Million) Forecast, by Application 2019 & 2032
                                                              56. Table 56: Southeast Asia Solar Energy Market Volume (Thousand) Forecast, by Application 2019 & 2032
                                                              57. Table 57: Australia Solar Energy Market Revenue (Million) Forecast, by Application 2019 & 2032
                                                              58. Table 58: Australia Solar Energy Market Volume (Thousand) Forecast, by Application 2019 & 2032
                                                              59. Table 59: Indonesia Solar Energy Market Revenue (Million) Forecast, by Application 2019 & 2032
                                                              60. Table 60: Indonesia Solar Energy Market Volume (Thousand) Forecast, by Application 2019 & 2032
                                                              61. Table 61: Phillipes Solar Energy Market Revenue (Million) Forecast, by Application 2019 & 2032
                                                              62. Table 62: Phillipes Solar Energy Market Volume (Thousand) Forecast, by Application 2019 & 2032
                                                              63. Table 63: Singapore Solar Energy Market Revenue (Million) Forecast, by Application 2019 & 2032
                                                              64. Table 64: Singapore Solar Energy Market Volume (Thousand) Forecast, by Application 2019 & 2032
                                                              65. Table 65: Thailandc Solar Energy Market Revenue (Million) Forecast, by Application 2019 & 2032
                                                              66. Table 66: Thailandc Solar Energy Market Volume (Thousand) Forecast, by Application 2019 & 2032
                                                              67. Table 67: Rest of Asia Pacific Solar Energy Market Revenue (Million) Forecast, by Application 2019 & 2032
                                                              68. Table 68: Rest of Asia Pacific Solar Energy Market Volume (Thousand) Forecast, by Application 2019 & 2032
                                                              69. Table 69: Global Solar Energy Market Revenue Million Forecast, by Country 2019 & 2032
                                                              70. Table 70: Global Solar Energy Market Volume Thousand Forecast, by Country 2019 & 2032
                                                              71. Table 71: Brazil Solar Energy Market Revenue (Million) Forecast, by Application 2019 & 2032
                                                              72. Table 72: Brazil Solar Energy Market Volume (Thousand) Forecast, by Application 2019 & 2032
                                                              73. Table 73: Argentina Solar Energy Market Revenue (Million) Forecast, by Application 2019 & 2032
                                                              74. Table 74: Argentina Solar Energy Market Volume (Thousand) Forecast, by Application 2019 & 2032
                                                              75. Table 75: Peru Solar Energy Market Revenue (Million) Forecast, by Application 2019 & 2032
                                                              76. Table 76: Peru Solar Energy Market Volume (Thousand) Forecast, by Application 2019 & 2032
                                                              77. Table 77: Chile Solar Energy Market Revenue (Million) Forecast, by Application 2019 & 2032
                                                              78. Table 78: Chile Solar Energy Market Volume (Thousand) Forecast, by Application 2019 & 2032
                                                              79. Table 79: Colombia Solar Energy Market Revenue (Million) Forecast, by Application 2019 & 2032
                                                              80. Table 80: Colombia Solar Energy Market Volume (Thousand) Forecast, by Application 2019 & 2032
                                                              81. Table 81: Ecuador Solar Energy Market Revenue (Million) Forecast, by Application 2019 & 2032
                                                              82. Table 82: Ecuador Solar Energy Market Volume (Thousand) Forecast, by Application 2019 & 2032
                                                              83. Table 83: Venezuela Solar Energy Market Revenue (Million) Forecast, by Application 2019 & 2032
                                                              84. Table 84: Venezuela Solar Energy Market Volume (Thousand) Forecast, by Application 2019 & 2032
                                                              85. Table 85: Rest of South America Solar Energy Market Revenue (Million) Forecast, by Application 2019 & 2032
                                                              86. Table 86: Rest of South America Solar Energy Market Volume (Thousand) Forecast, by Application 2019 & 2032
                                                              87. Table 87: Global Solar Energy Market Revenue Million Forecast, by Country 2019 & 2032
                                                              88. Table 88: Global Solar Energy Market Volume Thousand Forecast, by Country 2019 & 2032
                                                              89. Table 89: United States Solar Energy Market Revenue (Million) Forecast, by Application 2019 & 2032
                                                              90. Table 90: United States Solar Energy Market Volume (Thousand) Forecast, by Application 2019 & 2032
                                                              91. Table 91: Canada Solar Energy Market Revenue (Million) Forecast, by Application 2019 & 2032
                                                              92. Table 92: Canada Solar Energy Market Volume (Thousand) Forecast, by Application 2019 & 2032
                                                              93. Table 93: Mexico Solar Energy Market Revenue (Million) Forecast, by Application 2019 & 2032
                                                              94. Table 94: Mexico Solar Energy Market Volume (Thousand) Forecast, by Application 2019 & 2032
                                                              95. Table 95: Global Solar Energy Market Revenue Million Forecast, by Country 2019 & 2032
                                                              96. Table 96: Global Solar Energy Market Volume Thousand Forecast, by Country 2019 & 2032
                                                              97. Table 97: United Arab Emirates Solar Energy Market Revenue (Million) Forecast, by Application 2019 & 2032
                                                              98. Table 98: United Arab Emirates Solar Energy Market Volume (Thousand) Forecast, by Application 2019 & 2032
                                                              99. Table 99: Saudi Arabia Solar Energy Market Revenue (Million) Forecast, by Application 2019 & 2032
                                                              100. Table 100: Saudi Arabia Solar Energy Market Volume (Thousand) Forecast, by Application 2019 & 2032
                                                              101. Table 101: South Africa Solar Energy Market Revenue (Million) Forecast, by Application 2019 & 2032
                                                              102. Table 102: South Africa Solar Energy Market Volume (Thousand) Forecast, by Application 2019 & 2032
                                                              103. Table 103: Rest of Middle East and Africa Solar Energy Market Revenue (Million) Forecast, by Application 2019 & 2032
                                                              104. Table 104: Rest of Middle East and Africa Solar Energy Market Volume (Thousand) Forecast, by Application 2019 & 2032
                                                              105. Table 105: Global Solar Energy Market Revenue Million Forecast, by Production Analysis 2019 & 2032
                                                              106. Table 106: Global Solar Energy Market Volume Thousand Forecast, by Production Analysis 2019 & 2032
                                                              107. Table 107: Global Solar Energy Market Revenue Million Forecast, by Consumption Analysis 2019 & 2032
                                                              108. Table 108: Global Solar Energy Market Volume Thousand Forecast, by Consumption Analysis 2019 & 2032
                                                              109. Table 109: Global Solar Energy Market Revenue Million Forecast, by Import Market Analysis (Value & Volume) 2019 & 2032
                                                              110. Table 110: Global Solar Energy Market Volume Thousand Forecast, by Import Market Analysis (Value & Volume) 2019 & 2032
                                                              111. Table 111: Global Solar Energy Market Revenue Million Forecast, by Export Market Analysis (Value & Volume) 2019 & 2032
                                                              112. Table 112: Global Solar Energy Market Volume Thousand Forecast, by Export Market Analysis (Value & Volume) 2019 & 2032
                                                              113. Table 113: Global Solar Energy Market Revenue Million Forecast, by Price Trend Analysis 2019 & 2032
                                                              114. Table 114: Global Solar Energy Market Volume Thousand Forecast, by Price Trend Analysis 2019 & 2032
                                                              115. Table 115: Global Solar Energy Market Revenue Million Forecast, by Country 2019 & 2032
                                                              116. Table 116: Global Solar Energy Market Volume Thousand Forecast, by Country 2019 & 2032
                                                              117. Table 117: United States Solar Energy Market Revenue (Million) Forecast, by Application 2019 & 2032
                                                              118. Table 118: United States Solar Energy Market Volume (Thousand) Forecast, by Application 2019 & 2032
                                                              119. Table 119: Mexico Solar Energy Market Revenue (Million) Forecast, by Application 2019 & 2032
                                                              120. Table 120: Mexico Solar Energy Market Volume (Thousand) Forecast, by Application 2019 & 2032
                                                              121. Table 121: Canada Solar Energy Market Revenue (Million) Forecast, by Application 2019 & 2032
                                                              122. Table 122: Canada Solar Energy Market Volume (Thousand) Forecast, by Application 2019 & 2032
                                                              123. Table 123: Rest of North America Solar Energy Market Revenue (Million) Forecast, by Application 2019 & 2032
                                                              124. Table 124: Rest of North America Solar Energy Market Volume (Thousand) Forecast, by Application 2019 & 2032
                                                              125. Table 125: Global Solar Energy Market Revenue Million Forecast, by Production Analysis 2019 & 2032
                                                              126. Table 126: Global Solar Energy Market Volume Thousand Forecast, by Production Analysis 2019 & 2032
                                                              127. Table 127: Global Solar Energy Market Revenue Million Forecast, by Consumption Analysis 2019 & 2032
                                                              128. Table 128: Global Solar Energy Market Volume Thousand Forecast, by Consumption Analysis 2019 & 2032
                                                              129. Table 129: Global Solar Energy Market Revenue Million Forecast, by Import Market Analysis (Value & Volume) 2019 & 2032
                                                              130. Table 130: Global Solar Energy Market Volume Thousand Forecast, by Import Market Analysis (Value & Volume) 2019 & 2032
                                                              131. Table 131: Global Solar Energy Market Revenue Million Forecast, by Export Market Analysis (Value & Volume) 2019 & 2032
                                                              132. Table 132: Global Solar Energy Market Volume Thousand Forecast, by Export Market Analysis (Value & Volume) 2019 & 2032
                                                              133. Table 133: Global Solar Energy Market Revenue Million Forecast, by Price Trend Analysis 2019 & 2032
                                                              134. Table 134: Global Solar Energy Market Volume Thousand Forecast, by Price Trend Analysis 2019 & 2032
                                                              135. Table 135: Global Solar Energy Market Revenue Million Forecast, by Country 2019 & 2032
                                                              136. Table 136: Global Solar Energy Market Volume Thousand Forecast, by Country 2019 & 2032
                                                              137. Table 137: Germany Solar Energy Market Revenue (Million) Forecast, by Application 2019 & 2032
                                                              138. Table 138: Germany Solar Energy Market Volume (Thousand) Forecast, by Application 2019 & 2032
                                                              139. Table 139: Spain Solar Energy Market Revenue (Million) Forecast, by Application 2019 & 2032
                                                              140. Table 140: Spain Solar Energy Market Volume (Thousand) Forecast, by Application 2019 & 2032
                                                              141. Table 141: Italy Solar Energy Market Revenue (Million) Forecast, by Application 2019 & 2032
                                                              142. Table 142: Italy Solar Energy Market Volume (Thousand) Forecast, by Application 2019 & 2032
                                                              143. Table 143: United Kingdom Solar Energy Market Revenue (Million) Forecast, by Application 2019 & 2032
                                                              144. Table 144: United Kingdom Solar Energy Market Volume (Thousand) Forecast, by Application 2019 & 2032
                                                              145. Table 145: France Solar Energy Market Revenue (Million) Forecast, by Application 2019 & 2032
                                                              146. Table 146: France Solar Energy Market Volume (Thousand) Forecast, by Application 2019 & 2032
                                                              147. Table 147: NORDIC Solar Energy Market Revenue (Million) Forecast, by Application 2019 & 2032
                                                              148. Table 148: NORDIC Solar Energy Market Volume (Thousand) Forecast, by Application 2019 & 2032
                                                              149. Table 149: Turkey Solar Energy Market Revenue (Million) Forecast, by Application 2019 & 2032
                                                              150. Table 150: Turkey Solar Energy Market Volume (Thousand) Forecast, by Application 2019 & 2032
                                                              151. Table 151: Russia Solar Energy Market Revenue (Million) Forecast, by Application 2019 & 2032
                                                              152. Table 152: Russia Solar Energy Market Volume (Thousand) Forecast, by Application 2019 & 2032
                                                              153. Table 153: Rest of Europe Solar Energy Market Revenue (Million) Forecast, by Application 2019 & 2032
                                                              154. Table 154: Rest of Europe Solar Energy Market Volume (Thousand) Forecast, by Application 2019 & 2032
                                                              155. Table 155: Global Solar Energy Market Revenue Million Forecast, by Production Analysis 2019 & 2032
                                                              156. Table 156: Global Solar Energy Market Volume Thousand Forecast, by Production Analysis 2019 & 2032
                                                              157. Table 157: Global Solar Energy Market Revenue Million Forecast, by Consumption Analysis 2019 & 2032
                                                              158. Table 158: Global Solar Energy Market Volume Thousand Forecast, by Consumption Analysis 2019 & 2032
                                                              159. Table 159: Global Solar Energy Market Revenue Million Forecast, by Import Market Analysis (Value & Volume) 2019 & 2032
                                                              160. Table 160: Global Solar Energy Market Volume Thousand Forecast, by Import Market Analysis (Value & Volume) 2019 & 2032
                                                              161. Table 161: Global Solar Energy Market Revenue Million Forecast, by Export Market Analysis (Value & Volume) 2019 & 2032
                                                              162. Table 162: Global Solar Energy Market Volume Thousand Forecast, by Export Market Analysis (Value & Volume) 2019 & 2032
                                                              163. Table 163: Global Solar Energy Market Revenue Million Forecast, by Price Trend Analysis 2019 & 2032
                                                              164. Table 164: Global Solar Energy Market Volume Thousand Forecast, by Price Trend Analysis 2019 & 2032
                                                              165. Table 165: Global Solar Energy Market Revenue Million Forecast, by Country 2019 & 2032
                                                              166. Table 166: Global Solar Energy Market Volume Thousand Forecast, by Country 2019 & 2032
                                                              167. Table 167: China Solar Energy Market Revenue (Million) Forecast, by Application 2019 & 2032
                                                              168. Table 168: China Solar Energy Market Volume (Thousand) Forecast, by Application 2019 & 2032
                                                              169. Table 169: India Solar Energy Market Revenue (Million) Forecast, by Application 2019 & 2032
                                                              170. Table 170: India Solar Energy Market Volume (Thousand) Forecast, by Application 2019 & 2032
                                                              171. Table 171: Japan Solar Energy Market Revenue (Million) Forecast, by Application 2019 & 2032
                                                              172. Table 172: Japan Solar Energy Market Volume (Thousand) Forecast, by Application 2019 & 2032
                                                              173. Table 173: Australia Solar Energy Market Revenue (Million) Forecast, by Application 2019 & 2032
                                                              174. Table 174: Australia Solar Energy Market Volume (Thousand) Forecast, by Application 2019 & 2032
                                                              175. Table 175: Vietnam Solar Energy Market Revenue (Million) Forecast, by Application 2019 & 2032
                                                              176. Table 176: Vietnam Solar Energy Market Volume (Thousand) Forecast, by Application 2019 & 2032
                                                              177. Table 177: South Korea Solar Energy Market Revenue (Million) Forecast, by Application 2019 & 2032
                                                              178. Table 178: South Korea Solar Energy Market Volume (Thousand) Forecast, by Application 2019 & 2032
                                                              179. Table 179: Malaysia Solar Energy Market Revenue (Million) Forecast, by Application 2019 & 2032
                                                              180. Table 180: Malaysia Solar Energy Market Volume (Thousand) Forecast, by Application 2019 & 2032
                                                              181. Table 181: Thailand Solar Energy Market Revenue (Million) Forecast, by Application 2019 & 2032
                                                              182. Table 182: Thailand Solar Energy Market Volume (Thousand) Forecast, by Application 2019 & 2032
                                                              183. Table 183: Indonesia Solar Energy Market Revenue (Million) Forecast, by Application 2019 & 2032
                                                              184. Table 184: Indonesia Solar Energy Market Volume (Thousand) Forecast, by Application 2019 & 2032
                                                              185. Table 185: Rest of Asia pacific Solar Energy Market Revenue (Million) Forecast, by Application 2019 & 2032
                                                              186. Table 186: Rest of Asia pacific Solar Energy Market Volume (Thousand) Forecast, by Application 2019 & 2032
                                                              187. Table 187: Global Solar Energy Market Revenue Million Forecast, by Production Analysis 2019 & 2032
                                                              188. Table 188: Global Solar Energy Market Volume Thousand Forecast, by Production Analysis 2019 & 2032
                                                              189. Table 189: Global Solar Energy Market Revenue Million Forecast, by Consumption Analysis 2019 & 2032
                                                              190. Table 190: Global Solar Energy Market Volume Thousand Forecast, by Consumption Analysis 2019 & 2032
                                                              191. Table 191: Global Solar Energy Market Revenue Million Forecast, by Import Market Analysis (Value & Volume) 2019 & 2032
                                                              192. Table 192: Global Solar Energy Market Volume Thousand Forecast, by Import Market Analysis (Value & Volume) 2019 & 2032
                                                              193. Table 193: Global Solar Energy Market Revenue Million Forecast, by Export Market Analysis (Value & Volume) 2019 & 2032
                                                              194. Table 194: Global Solar Energy Market Volume Thousand Forecast, by Export Market Analysis (Value & Volume) 2019 & 2032
                                                              195. Table 195: Global Solar Energy Market Revenue Million Forecast, by Price Trend Analysis 2019 & 2032
                                                              196. Table 196: Global Solar Energy Market Volume Thousand Forecast, by Price Trend Analysis 2019 & 2032
                                                              197. Table 197: Global Solar Energy Market Revenue Million Forecast, by Country 2019 & 2032
                                                              198. Table 198: Global Solar Energy Market Volume Thousand Forecast, by Country 2019 & 2032
                                                              199. Table 199: Brazil Solar Energy Market Revenue (Million) Forecast, by Application 2019 & 2032
                                                              200. Table 200: Brazil Solar Energy Market Volume (Thousand) Forecast, by Application 2019 & 2032
                                                              201. Table 201: Argentina Solar Energy Market Revenue (Million) Forecast, by Application 2019 & 2032
                                                              202. Table 202: Argentina Solar Energy Market Volume (Thousand) Forecast, by Application 2019 & 2032
                                                              203. Table 203: Chile Solar Energy Market Revenue (Million) Forecast, by Application 2019 & 2032
                                                              204. Table 204: Chile Solar Energy Market Volume (Thousand) Forecast, by Application 2019 & 2032
                                                              205. Table 205: Colombia Solar Energy Market Revenue (Million) Forecast, by Application 2019 & 2032
                                                              206. Table 206: Colombia Solar Energy Market Volume (Thousand) Forecast, by Application 2019 & 2032
                                                              207. Table 207: Rest of South America Solar Energy Market Revenue (Million) Forecast, by Application 2019 & 2032
                                                              208. Table 208: Rest of South America Solar Energy Market Volume (Thousand) Forecast, by Application 2019 & 2032
                                                              209. Table 209: Global Solar Energy Market Revenue Million Forecast, by Production Analysis 2019 & 2032
                                                              210. Table 210: Global Solar Energy Market Volume Thousand Forecast, by Production Analysis 2019 & 2032
                                                              211. Table 211: Global Solar Energy Market Revenue Million Forecast, by Consumption Analysis 2019 & 2032
                                                              212. Table 212: Global Solar Energy Market Volume Thousand Forecast, by Consumption Analysis 2019 & 2032
                                                              213. Table 213: Global Solar Energy Market Revenue Million Forecast, by Import Market Analysis (Value & Volume) 2019 & 2032
                                                              214. Table 214: Global Solar Energy Market Volume Thousand Forecast, by Import Market Analysis (Value & Volume) 2019 & 2032
                                                              215. Table 215: Global Solar Energy Market Revenue Million Forecast, by Export Market Analysis (Value & Volume) 2019 & 2032
                                                              216. Table 216: Global Solar Energy Market Volume Thousand Forecast, by Export Market Analysis (Value & Volume) 2019 & 2032
                                                              217. Table 217: Global Solar Energy Market Revenue Million Forecast, by Price Trend Analysis 2019 & 2032
                                                              218. Table 218: Global Solar Energy Market Volume Thousand Forecast, by Price Trend Analysis 2019 & 2032
                                                              219. Table 219: Global Solar Energy Market Revenue Million Forecast, by Country 2019 & 2032
                                                              220. Table 220: Global Solar Energy Market Volume Thousand Forecast, by Country 2019 & 2032
                                                              221. Table 221: Saudi Arabia Solar Energy Market Revenue (Million) Forecast, by Application 2019 & 2032
                                                              222. Table 222: Saudi Arabia Solar Energy Market Volume (Thousand) Forecast, by Application 2019 & 2032
                                                              223. Table 223: United Arab Emirates Solar Energy Market Revenue (Million) Forecast, by Application 2019 & 2032
                                                              224. Table 224: United Arab Emirates Solar Energy Market Volume (Thousand) Forecast, by Application 2019 & 2032
                                                              225. Table 225: Egypt Solar Energy Market Revenue (Million) Forecast, by Application 2019 & 2032
                                                              226. Table 226: Egypt Solar Energy Market Volume (Thousand) Forecast, by Application 2019 & 2032
                                                              227. Table 227: Nigeria Solar Energy Market Revenue (Million) Forecast, by Application 2019 & 2032
                                                              228. Table 228: Nigeria Solar Energy Market Volume (Thousand) Forecast, by Application 2019 & 2032
                                                              229. Table 229: South Africa Solar Energy Market Revenue (Million) Forecast, by Application 2019 & 2032
                                                              230. Table 230: South Africa Solar Energy Market Volume (Thousand) Forecast, by Application 2019 & 2032
                                                              231. Table 231: Middle East and Africa Solar Energy Market Revenue (Million) Forecast, by Application 2019 & 2032
                                                              232. Table 232: Middle East and Africa Solar Energy Market Volume (Thousand) Forecast, by Application 2019 & 2032


                                                              Frequently Asked Questions

                                                              1. What is the projected Compound Annual Growth Rate (CAGR) of the Solar Energy Market?

                                                              The projected CAGR is approximately 31.85%.

                                                              2. Which companies are prominent players in the Solar Energy Market?

                                                              Key companies in the market include JinkoSolar Holding Co Ltd, Brightsource Energy Inc, First Solar Inc, LONGi Green Energy Technology Co Ltd, Hanwha Corporation*List Not Exhaustive 6 4 Market Ranking Analysi, Trina Solar Co Ltd, Engie SA, NextEra Energy Inc, SunPower Corporation, REC Solar Holdings AS, Canadian Solar Inc, Sharp Corporation, Abengoa SA, JA Solar Holding, Acciona SA, ACWA Power.

                                                              3. What are the main segments of the Solar Energy Market?

                                                              The market segments include Production Analysis, Consumption Analysis, Import Market Analysis (Value & Volume), Export Market Analysis (Value & Volume), Price Trend Analysis.

                                                              4. Can you provide details about the market size?

                                                              The market size is estimated to be USD XX Million as of 2022.

                                                              5. What are some drivers contributing to market growth?

                                                              4.; Government Incentives and Policies4.; Declining Price and Installation Cost of Solar PV Systems.

                                                              6. What are the notable trends driving market growth?

                                                              Solar Photovoltaic (PV) Segment Expected to Dominate the Market.

                                                              7. Are there any restraints impacting market growth?

                                                              4.; Rising Adoption of Alternate Clean Power Sources.

                                                              8. Can you provide examples of recent developments in the market?

                                                              February 2024: ReNew Energy Global PLC, an Indian decarbonization solutions company, collaborated with Singapore’s Sembcorp Industries Ltd to sell 350 MW of solar energy projects. The deal is estimated to be valued at around USD 241 million.

                                                              9. What pricing options are available for accessing the report?

                                                              Pricing options include single-user, multi-user, and enterprise licenses priced at USD 4750, USD 5250, and USD 8750 respectively.

                                                              10. Is the market size provided in terms of value or volume?

                                                              The market size is provided in terms of value, measured in Million and volume, measured in Thousand.

                                                              11. Are there any specific market keywords associated with the report?

                                                              Yes, the market keyword associated with the report is "Solar Energy Market," which aids in identifying and referencing the specific market segment covered.

                                                              12. How do I determine which pricing option suits my needs best?

                                                              The pricing options vary based on user requirements and access needs. Individual users may opt for single-user licenses, while businesses requiring broader access may choose multi-user or enterprise licenses for cost-effective access to the report.

                                                              13. Are there any additional resources or data provided in the Solar Energy Market report?

                                                              While the report offers comprehensive insights, it's advisable to review the specific contents or supplementary materials provided to ascertain if additional resources or data are available.

                                                              14. How can I stay updated on further developments or reports in the Solar Energy Market?

                                                              To stay informed about further developments, trends, and reports in the Solar Energy Market, consider subscribing to industry newsletters, following relevant companies and organizations, or regularly checking reputable industry news sources and publications.


                                                              Methodology

                                                              Step 1 - Identification of Relevant Samples Size from Population Database

                                                              Step Chart
                                                              Bar Chart
                                                              Method Chart

                                                              Step 2 - Approaches for Defining Global Market Size (Value, Volume* & Price*)

                                                              Approach Chart
                                                              Top-down and bottom-up approaches are used to validate the global market size and estimate the market size for manufactures, regional segments, product, and application.

                                                              Note*: In applicable scenarios

                                                              Step 3 - Data Sources

                                                              Primary Research

                                                              • Web Analytics
                                                              • Survey Reports
                                                              • Research Institute
                                                              • Latest Research Reports
                                                              • Opinion Leaders

                                                              Secondary Research

                                                              • Annual Reports
                                                              • White Paper
                                                              • Latest Press Release
                                                              • Industry Association
                                                              • Paid Database
                                                              • Investor Presentations
                                                              Analyst Chart

                                                              Step 4 - Data Triangulation

                                                              Involves using different sources of information in order to increase the validity of a study

                                                              These sources are likely to be stakeholders in a program - participants, other researchers, program staff, other community members, and so on.

                                                              Then we put all data in single framework & apply various statistical tools to find out the dynamic on the market.

                                                              During the analysis stage, feedback from the stakeholder groups would be compared to determine areas of agreement as well as areas of divergence

                                                              Additionally, after gathering mixed and scattered data from a wide range of sources, data is triangulated and correlated to come up with estimated figures which are further validated through primary mediums or industry experts, opinion leaders.

                                                              About Visionary Data Reports

                                                              Visionary Data Reports provides future-focused market research, advanced analytics, and strategic insights for technology, healthcare, green energy, and finance. Our reports help you anticipate trends, innovate, and lead in your industry. Our expert team combines primary research, data science, and industry knowledge to deliver actionable intelligence. We offer syndicated reports, custom analytics, and consulting services tailored to your business needs. At Visionary Data Reports, we are committed to quality, transparency, and client satisfaction. Every report is rigorously validated to ensure accuracy and relevance. Our global perspective and forward-thinking approach help you understand both current and emerging market dynamics.

                                                              Stay ahead with Visionary Data Reports. Subscribe to our newsletter for the latest insights and research highlights, and follow us on social media for real-time updates. Visionary Data Reports – Your Guide to Tomorrow’s Opportunities.

                                                              artwork spiralartwork spiralRelated Reports
                                                              artwork underline

                                                              Algeria Power Market Market’s Consumer Insights and Trends

                                                              Discover the booming Algerian power market, projected to grow at a CAGR exceeding 8.5% until 2033. This in-depth analysis reveals key drivers, trends, and challenges, highlighting opportunities for investment in renewable energy and grid modernization. Explore market size, segmentation, and key players shaping this dynamic sector.

                                                              July 2025
                                                              Base Year: 2024
                                                              No Of Pages: 197
                                                              Price: $3800

                                                              Artificial Lift Software Industry Strategic Insights: Analysis 2025 and Forecasts 2033

                                                              The Artificial Lift Systems market is booming, projected to reach $XX million by 2033 with a CAGR exceeding 4.50%. Driven by increasing oil & gas production and technological advancements in ESP, PCP, and Rod Lift systems, key players like Baker Hughes and Schlumberger are shaping this lucrative sector. Explore market trends and regional analysis in our comprehensive report.

                                                              July 2025
                                                              Base Year: 2024
                                                              No Of Pages: 234
                                                              Price: $4750

                                                              US Fixed-tilt Solar PV Industry 2025-2033 Analysis: Trends, Competitor Dynamics, and Growth Opportunities

                                                              Discover the booming US fixed-tilt solar PV market! This comprehensive analysis reveals a CAGR exceeding 13.60%, driven by strong demand, government incentives, and technological advancements. Learn about key trends, regional variations, leading companies, and future growth projections for 2025-2033.

                                                              July 2025
                                                              Base Year: 2024
                                                              No Of Pages: 197
                                                              Price: $3800

                                                              Middle East and Africa Bunker Fuel Industry: Disruptive Technologies Driving Market Growth 2025-2033

                                                              Discover the booming Middle East & Africa Bunker Fuel market! This comprehensive analysis reveals a CAGR exceeding 12%, driven by increasing maritime trade and the shift towards cleaner fuels like LNG. Learn about market trends, key players (Shell, ExxonMobil, Uniper), and regional growth forecasts for 2025-2033.

                                                              July 2025
                                                              Base Year: 2024
                                                              No Of Pages: 234
                                                              Price: $4750

                                                              Gas Generator Rental Industry Unlocking Growth Potential: 2025-2033 Analysis and Forecasts

                                                              The gas generator rental market is booming, projected to exceed a CAGR of 5.20% through 2033. Discover key drivers, regional trends, and leading companies shaping this dynamic industry. Explore market size, segmentation (oil & gas, construction, data centers), and future growth projections in our comprehensive analysis.

                                                              July 2025
                                                              Base Year: 2024
                                                              No Of Pages: 234
                                                              Price: $4750

                                                              Unveiling Oil and Gas CAPEX Outlook Industry Trends

                                                              Discover the latest Oil & Gas CAPEX Outlook, projecting a 4.27% CAGR through 2033. Analyze market trends, regional breakdowns (North America, Europe, Asia-Pacific), key players (Shell, ExxonMobil, CNPC), and investment drivers shaping this dynamic sector. Get the data-driven insights you need for strategic decision-making.

                                                              July 2025
                                                              Base Year: 2024
                                                              No Of Pages: 234
                                                              Price: $4750

                                                              Oil and Gas Market in Malaysia Market’s Consumer Insights and Trends

                                                              Discover the booming Malaysian oil and gas market! This comprehensive analysis reveals key trends, drivers, and challenges impacting this $15B+ sector through 2033, profiling major players like Petronas and Royal Vopak. Learn about growth projections, market segmentation (transportation, storage, LNG terminals), and investment opportunities.

                                                              July 2025
                                                              Base Year: 2024
                                                              No Of Pages: 197
                                                              Price: $3800

                                                              Navigating Asia-Pacific Completion Equipment and Services Market Market Growth 2025-2033

                                                              Discover the booming Asia-Pacific completion equipment and services market! This in-depth analysis reveals key trends, growth drivers, and leading companies shaping this dynamic sector, projected to reach significant value by 2033. Explore market segments, regional breakdowns, and future growth potential.

                                                              July 2025
                                                              Base Year: 2024
                                                              No Of Pages: 234
                                                              Price: $4750

                                                              Exploring Consumer Shifts in Gas Generator Industry Market 2025-2033

                                                              The global gas generator market is booming, projected to reach $XX million by 2033 with a 4.95% CAGR. Driven by industrialization and unreliable grids, this report analyzes market trends, segments (industrial, commercial, residential, power rating), key players (Cummins, Generac, Caterpillar), and regional growth (North America, Europe, Asia-Pacific). Discover insights into this expanding market.

                                                              July 2025
                                                              Base Year: 2024
                                                              No Of Pages: 234
                                                              Price: $4750

                                                              Decoding Tunisia Power Industry Consumer Preferences 2025-2033

                                                              Discover the booming Tunisian power industry! This comprehensive market analysis reveals a CAGR of 7.70%, driven by renewable energy adoption and infrastructure modernization. Explore market size, key players (STEG, Seeraj Energy, more), and future growth projections (2025-2033) in this insightful report.

                                                              July 2025
                                                              Base Year: 2024
                                                              No Of Pages: 197
                                                              Price: $3800

                                                              High Voltage Switchgear Market Market Trends and Insights

                                                              The global high-voltage switchgear market is booming, projected to reach [insert projected 2033 value based on chart data] by 2033, driven by renewable energy integration and grid modernization. Explore market trends, key players (ABB, Siemens, Schneider Electric), and regional insights in this comprehensive analysis.

                                                              July 2025
                                                              Base Year: 2024
                                                              No Of Pages: 234
                                                              Price: $4750

                                                              Regional Trends and Opportunities for Excitation Systems Industry Market

                                                              Discover the booming Excitation Systems market! This in-depth analysis reveals a CAGR exceeding 4.35% through 2033, driven by renewable energy and industrial growth. Explore market size, key players (ABB, Siemens, GE), regional trends, and future projections for synchronous generators, motors, static & brushless systems.

                                                              July 2025
                                                              Base Year: 2024
                                                              No Of Pages: 234
                                                              Price: $4750

                                                              Comprehensive Review of Residential Combined Heat & Power System Market Growth Potential

                                                              Discover the booming Residential Combined Heat & Power (CHP) System market! Explore key trends, growth drivers, leading companies, and regional insights for 2025-2033. Learn about fuel cell and engine-based systems, and the impact of government policies on this sustainable energy solution.

                                                              July 2025
                                                              Base Year: 2024
                                                              No Of Pages: 234
                                                              Price: $4750

                                                              Opportunities in Emerging Indonesia Oil & Gas Downstream Market Industry Markets

                                                              Discover the booming Indonesia Oil & Gas Downstream Market analysis revealing a CAGR exceeding 4% through 2033. This in-depth report covers key players, segments (refined products, natural gas, petrochemicals), and regional trends, offering invaluable insights for investors and industry professionals. Explore growth drivers, restraints, and future projections for this dynamic market.

                                                              July 2025
                                                              Base Year: 2024
                                                              No Of Pages: 197
                                                              Price: $3800

                                                              Europe Nuclear Power Plant and Equipment Industry Market Trends and Strategic Roadmap

                                                              Discover the latest market analysis on the thriving European Nuclear Power Plant & Equipment industry. Explore growth drivers, market size (€20B in 2025), key players (Westinghouse, Rosatom, Framatome), and future trends impacting PWR, PHWR, and SMR technologies. Learn about the investment opportunities and challenges in this dynamic sector.

                                                              July 2025
                                                              Base Year: 2024
                                                              No Of Pages: 234
                                                              Price: $4750

                                                              Europe Hydraulic Fracturing Fluids Market Market Expansion: Growth Outlook 2025-2033

                                                              Discover the latest trends in the European hydraulic fracturing fluids market. Our in-depth analysis reveals a steady growth trajectory driven by natural gas demand, despite environmental regulations. Learn about market segmentation, key players (Schlumberger, Halliburton, Baker Hughes), and future projections for 2025-2033.

                                                              July 2025
                                                              Base Year: 2024
                                                              No Of Pages: 180
                                                              Price: $4750

                                                              Consumer Battery Industry Market’s Strategic Roadmap: Insights for 2025-2033

                                                              Discover the booming consumer battery market! This in-depth analysis reveals a CAGR of 7.47% through 2033, driven by consumer electronics, EVs, and industrial demand. Explore market size, key players (Samsung SDI, LG Chem, Panasonic), and regional trends. Learn about lithium-ion, alkaline, and other battery types.

                                                              July 2025
                                                              Base Year: 2024
                                                              No Of Pages: 234
                                                              Price: $4750

                                                              Kuwait Oil & Gas Market Market Predictions: Growth and Size Trends to 2033

                                                              Discover the booming Kuwait Oil & Gas market forecast to 2033! This in-depth analysis reveals market size, growth drivers (upstream, midstream, downstream), key players (Kuwait Petroleum Corporation, Chevron, Shell), and challenges. Learn about investment opportunities and future trends in this dynamic sector.

                                                              July 2025
                                                              Base Year: 2024
                                                              No Of Pages: 197
                                                              Price: $3800

                                                              France Tidal Power Market 2025-2033 Trends and Competitor Dynamics: Unlocking Growth Opportunities

                                                              Discover the booming France Tidal Power Market! Explore its €175-200 million (2025 est.) size, 4.54% CAGR, key drivers, restraints, and top companies. Learn about tidal barrage, floating platforms, and stream generation technologies shaping this renewable energy sector.

                                                              July 2025
                                                              Base Year: 2024
                                                              No Of Pages: 197
                                                              Price: $3800

                                                              Argentina's Solar Energy Industry Charting Growth Trajectories: Analysis and Forecasts 2025-2033

                                                              Discover the booming Argentina solar energy market! This in-depth analysis reveals a CAGR exceeding 10%, driven by government incentives and falling costs. Explore market size, key players (JinkoSolar, Canadian Solar, Genneia), and future growth projections through 2033. Invest in Argentina's solar future.

                                                              July 2025
                                                              Base Year: 2024
                                                              No Of Pages: 197
                                                              Price: $3800

                                                              Business Address

                                                              Head Office

                                                              Office no. A 5010, fifth floor, Solitaire Business Hub, Near Phoenix mall, Pune, Maharashtra 411014

                                                              Contact Information

                                                              Craig Francis

                                                              Business Development Head

                                                              +17162654855

                                                              [email protected]

                                                              Connect With Us

                                                              Secure Payment Partners

                                                              payment image
                                                              RetailLogisticsPackagingAutomotiveHealthcareAgricultureEnergy & PowerFood & BeverageAerospace & DefenseChemicals & MaterialsHospitality and TourismAnimal Nutrition & WellnessConsumer Goods and ServicesReal Estate and ConstructionHome and Property ImprovementTechnology, Media and TelecomManufacturing Products and ServicesFinancial Services and Investment Intelligence

                                                              © 2025 All rights reserved


                                                              Privacy Policy
                                                              Terms and Conditions
                                                              FAQ
                                                              • Home
                                                              • About Us
                                                              • Industries
                                                                • Aerospace & Defense
                                                                • Agriculture
                                                                • Animal Nutrition & Wellness
                                                                • Automotive
                                                                • Chemicals & Materials
                                                                • Consumer Goods and Services
                                                                • Energy & Power
                                                                • Financial Services and Investment Intelligence
                                                                • Food & Beverage
                                                                • Home and Property Improvement
                                                                • Hospitality and Tourism
                                                                • Logistics
                                                                • Manufacturing Products and Services
                                                                • Packaging
                                                                • Professional and Commercial Services
                                                                • Real Estate and Construction
                                                                • Retail
                                                                • Technology, Media and Telecom
                                                                • Healthcare
                                                              • Services
                                                              • Contact
                                                              Main Logo
                                                              • Home
                                                              • About Us
                                                              • Industries
                                                                • Aerospace & Defense
                                                                • Agriculture
                                                                • Animal Nutrition & Wellness
                                                                • Automotive
                                                                • Chemicals & Materials
                                                                • Consumer Goods and Services
                                                                • Energy & Power
                                                                • Financial Services and Investment Intelligence
                                                                • Food & Beverage
                                                                • Home and Property Improvement
                                                                • Hospitality and Tourism
                                                                • Logistics
                                                                • Manufacturing Products and Services
                                                                • Packaging
                                                                • Professional and Commercial Services
                                                                • Real Estate and Construction
                                                                • Retail
                                                                • Technology, Media and Telecom
                                                                • Healthcare
                                                              • Services
                                                              • Contact
                                                              +17162654855
                                                              [email protected]

                                                              +17162654855

                                                              [email protected]