
Key Insights
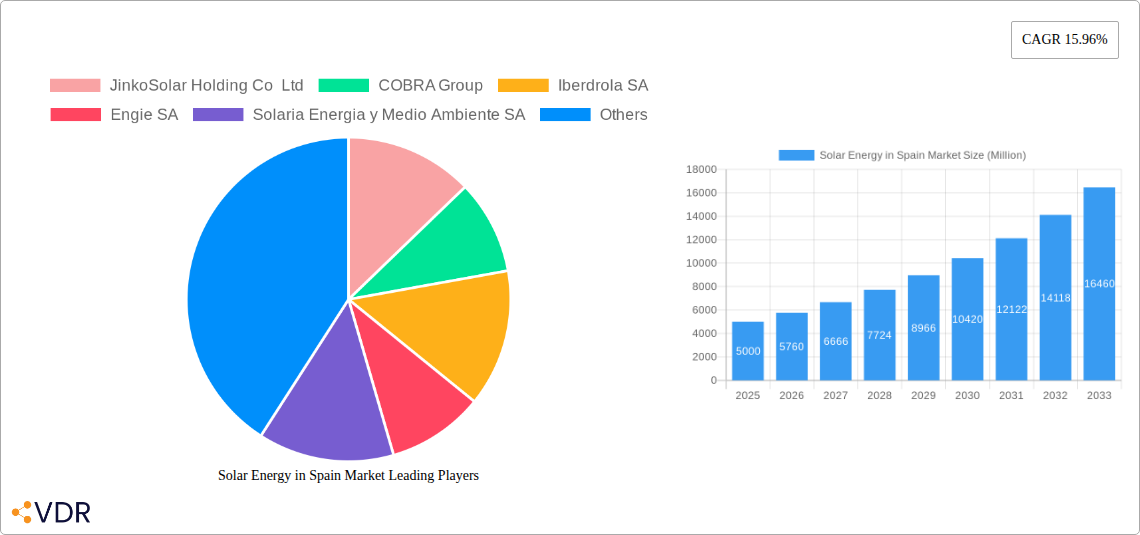
The Spanish solar energy market is experiencing robust growth, fueled by supportive government policies, increasing energy independence needs, and declining solar technology costs. With a Compound Annual Growth Rate (CAGR) of 15.96% from 2019-2033, the market is projected to reach significant size by 2033. The market is segmented by technology type (Solar Photovoltaic (PV) and Concentrated Solar Power (CSP)) and deployment type (rooftop and ground-mounted). While PV currently dominates the market, CSP is also seeing increasing adoption, particularly in large-scale projects. The rooftop segment is driven by residential and commercial installations, benefitting from readily available space and government incentives. Ground-mounted solar farms contribute significantly to the overall market size, leveraging Spain's abundant sunshine and available land. Key market drivers include the European Union's ambitious renewable energy targets, Spain's commitment to decarbonization, and the decreasing levelized cost of energy (LCOE) for solar. The growth is further facilitated by technological advancements, increased energy storage solutions, and improving grid infrastructure.
Despite the positive outlook, challenges remain. These include land acquisition constraints for large-scale projects, potential grid integration issues related to intermittent solar power generation, and the fluctuating cost of raw materials impacting project development timelines and budgets. However, ongoing technological innovation, coupled with government support and proactive industry strategies, are expected to mitigate these restraints. Leading players such as JinkoSolar, Cobra Group, Iberdrola, and others are actively shaping the market through strategic investments in project development, manufacturing capabilities, and innovative technologies. The Spanish solar energy market presents considerable opportunities for both established companies and new entrants, contributing significantly to Spain's broader renewable energy transition.
Solar Energy in Spain Market: A Comprehensive Report (2019-2033)
This comprehensive report provides an in-depth analysis of the dynamic Spanish solar energy market, encompassing market size, growth trends, key players, and future projections. Targeting industry professionals, investors, and policymakers, this report offers invaluable insights into the parent market (Renewable Energy in Spain) and its child market (Solar Energy in Spain), providing a granular understanding of the sector's evolution and future potential. The study period covers 2019-2033, with a base year of 2025 and a forecast period of 2025-2033. The market size is presented in Million units.
Solar Energy in Spain Market Dynamics & Structure
The Spanish solar energy market is characterized by increasing concentration among major players, driven by significant investments and mergers and acquisitions (M&A). Technological innovation, primarily in photovoltaic (PV) technology efficiency and cost reduction, is a key growth driver. The regulatory framework, while supportive of renewable energy, faces ongoing adjustments to optimize grid integration and streamline project approvals. Competitive substitutes include other renewable energy sources like wind power and hydropower. The end-user demographic is diverse, encompassing residential, commercial, and industrial sectors, with increasing participation from large-scale energy producers.
- Market Concentration: The top 5 players account for xx% of the market share in 2025 (estimated).
- M&A Activity: xx deals were recorded between 2019 and 2024, representing a total transaction value of xx Million.
- Technological Innovation: Focus on increasing efficiency of PV panels and reducing the cost of CSP technologies.
- Regulatory Landscape: Ongoing efforts to improve permitting processes and grid infrastructure.
- Innovation Barriers: High initial investment costs and access to financing remain challenges.
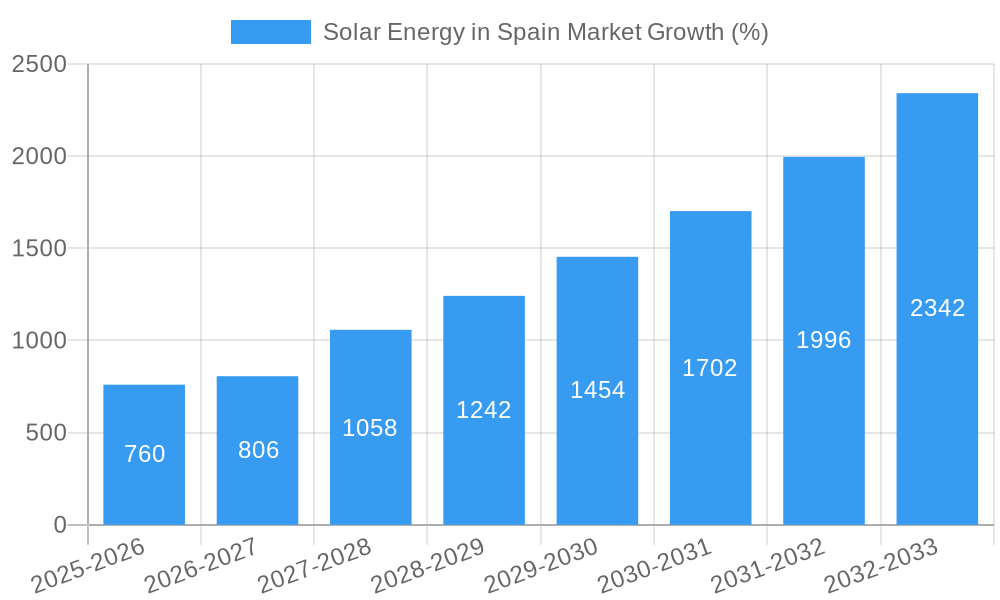
Solar Energy in Spain Market Growth Trends & Insights
The Spanish solar energy market has witnessed robust growth throughout the historical period (2019-2024), driven by supportive government policies, falling technology costs, and increasing energy security concerns. The market is projected to maintain a significant Compound Annual Growth Rate (CAGR) of xx% during the forecast period (2025-2033). This growth is fueled by rising electricity demand, ambitious renewable energy targets, and a growing awareness of climate change among consumers. Technological advancements, particularly in solar PV efficiency and storage solutions, are further enhancing market adoption. Consumer behavior shifts towards sustainability are also contributing to market expansion. Market penetration is expected to reach xx% by 2033.
Dominant Regions, Countries, or Segments in Solar Energy in Spain Market
Andalusia and Extremadura are currently the leading regions for solar energy deployment in Spain, owing to their abundant sunshine and favorable land availability. The Solar Photovoltaic (PV) segment dominates the market, accounting for xx% of the total installed capacity in 2025 (estimated), largely driven by the cost-effectiveness and scalability of PV technology. Ground-mounted installations comprise a larger share than rooftop installations due to economies of scale.
- Key Drivers for Andalusia and Extremadura: Abundant sunlight, available land, and supportive regional policies.
- PV Segment Dominance: Cost-effectiveness, technological maturity, and ease of installation.
- Ground-Mounted Dominance: Economies of scale and suitability for large-scale projects.
- Growth Potential: Continued expansion in other regions with high solar irradiance and increasing rooftop installations.
Solar Energy in Spain Market Product Landscape
The Spanish solar energy market showcases a diverse range of products, from high-efficiency monocrystalline PV modules to advanced CSP technologies with thermal energy storage. Manufacturers focus on optimizing panel efficiency, enhancing durability, and reducing balance-of-system costs. Technological advancements include bifacial panels that capture light from both sides and advancements in tracking systems to maximize energy generation. Unique selling propositions often center on performance guarantees, long-term warranties, and customized solutions for various applications.
Key Drivers, Barriers & Challenges in Solar Energy in Spain Market
Key Drivers:
- Supportive government policies and incentives for renewable energy adoption.
- Decreasing technology costs, making solar energy more competitive.
- Increasing energy security concerns and diversification needs.
Challenges:
- Grid integration challenges related to intermittency of solar energy.
- Land use constraints and permitting processes.
- Competition from other renewable energy technologies.
- Supply chain disruptions impacting the availability of raw materials. This caused a xx% increase in prices in 2023.
Emerging Opportunities in Solar Energy in Spain Market
- Energy storage solutions: Pairing solar PV with battery storage to address intermittency.
- Agrivoltaics: Integrating solar panels with agricultural activities to optimize land use.
- Floating solar farms: Utilizing water bodies for large-scale solar installations.
- Solar-powered water desalination: Addressing water scarcity challenges in arid regions.
Growth Accelerators in the Solar Energy in Spain Market Industry
Technological advancements in PV cell efficiency and energy storage are significant growth catalysts. Strategic partnerships between solar developers, utilities, and technology providers are accelerating project deployment. Market expansion strategies are focusing on underpenetrated regions and sectors, fostering sustainable growth. Government initiatives to simplify permitting processes and improve grid infrastructure are further enhancing market attractiveness.
Key Players Shaping the Solar Energy in Spain Market Market
- JinkoSolar Holding Co Ltd
- COBRA Group
- Iberdrola SA
- Engie SA
- Solaria Energia y Medio Ambiente SA
- Gransolar Group
- Soltec Energias Renovables SL
- The Red Electrica Group
- Acciona SA
- Repsol SA
Notable Milestones in Solar Energy in Spain Market Sector
- December 2023: MET Group commenced commercial operations for its first solar projects in Spain (Puerto Real 3, 50 MW).
- February 2024: TotalEnergies SE acquired the 59 MW Dehesa Nueva del Rey solar PV project.
In-Depth Solar Energy in Spain Market Market Outlook
The Spanish solar energy market is poised for sustained growth over the forecast period, driven by strong policy support, falling technology costs, and a growing focus on renewable energy. Strategic investments in grid infrastructure and energy storage solutions will be key to unlocking the full potential of the market. Opportunities abound for innovative technologies, strategic partnerships, and expansion into new market segments. The market is expected to reach xx Million units by 2033, signifying significant growth and market maturity.
Solar Energy in Spain Market Segmentation
-
1. Type
- 1.1. Solar Photovoltaic (PV)
- 1.2. Concentrated Solar Power (CSP)
-
2. Deployment Type
- 2.1. Rooftop
- 2.2. Ground-mounted
Solar Energy in Spain Market Segmentation By Geography
-
1. North America
- 1.1. United States
- 1.2. Canada
- 1.3. Mexico
-
2. South America
- 2.1. Brazil
- 2.2. Argentina
- 2.3. Rest of South America
-
3. Europe
- 3.1. United Kingdom
- 3.2. Germany
- 3.3. France
- 3.4. Italy
- 3.5. Spain
- 3.6. Russia
- 3.7. Benelux
- 3.8. Nordics
- 3.9. Rest of Europe
-
4. Middle East & Africa
- 4.1. Turkey
- 4.2. Israel
- 4.3. GCC
- 4.4. North Africa
- 4.5. South Africa
- 4.6. Rest of Middle East & Africa
-
5. Asia Pacific
- 5.1. China
- 5.2. India
- 5.3. Japan
- 5.4. South Korea
- 5.5. ASEAN
- 5.6. Oceania
- 5.7. Rest of Asia Pacific
Solar Energy in Spain Market REPORT HIGHLIGHTS
| Aspects | Details |
|---|---|
| Study Period | 2019-2033 |
| Base Year | 2024 |
| Estimated Year | 2025 |
| Forecast Period | 2025-2033 |
| Historical Period | 2019-2024 |
| Growth Rate | CAGR of 15.96% from 2019-2033 |
| Segmentation |
|
Table of Contents
- 1. Introduction
- 1.1. Research Scope
- 1.2. Market Segmentation
- 1.3. Research Methodology
- 1.4. Definitions and Assumptions
- 2. Executive Summary
- 2.1. Introduction
- 3. Market Dynamics
- 3.1. Introduction
- 3.2. Market Drivers
- 3.2.1. Declining Cost of Solar PV Installations4.; Supportive Government Policies for Renewable Energy
- 3.3. Market Restrains
- 3.3.1. Penetration of Other Energy Sources
- 3.4. Market Trends
- 3.4.1. Solar Photovoltaic (PV) Type to Dominate the Market
- 4. Market Factor Analysis
- 4.1. Porters Five Forces
- 4.2. Supply/Value Chain
- 4.3. PESTEL analysis
- 4.4. Market Entropy
- 4.5. Patent/Trademark Analysis
- 5. Global Solar Energy in Spain Market Analysis, Insights and Forecast, 2019-2031
- 5.1. Market Analysis, Insights and Forecast - by Type
- 5.1.1. Solar Photovoltaic (PV)
- 5.1.2. Concentrated Solar Power (CSP)
- 5.2. Market Analysis, Insights and Forecast - by Deployment Type
- 5.2.1. Rooftop
- 5.2.2. Ground-mounted
- 5.3. Market Analysis, Insights and Forecast - by Region
- 5.3.1. North America
- 5.3.2. South America
- 5.3.3. Europe
- 5.3.4. Middle East & Africa
- 5.3.5. Asia Pacific
- 5.1. Market Analysis, Insights and Forecast - by Type
- 6. North America Solar Energy in Spain Market Analysis, Insights and Forecast, 2019-2031
- 6.1. Market Analysis, Insights and Forecast - by Type
- 6.1.1. Solar Photovoltaic (PV)
- 6.1.2. Concentrated Solar Power (CSP)
- 6.2. Market Analysis, Insights and Forecast - by Deployment Type
- 6.2.1. Rooftop
- 6.2.2. Ground-mounted
- 6.1. Market Analysis, Insights and Forecast - by Type
- 7. South America Solar Energy in Spain Market Analysis, Insights and Forecast, 2019-2031
- 7.1. Market Analysis, Insights and Forecast - by Type
- 7.1.1. Solar Photovoltaic (PV)
- 7.1.2. Concentrated Solar Power (CSP)
- 7.2. Market Analysis, Insights and Forecast - by Deployment Type
- 7.2.1. Rooftop
- 7.2.2. Ground-mounted
- 7.1. Market Analysis, Insights and Forecast - by Type
- 8. Europe Solar Energy in Spain Market Analysis, Insights and Forecast, 2019-2031
- 8.1. Market Analysis, Insights and Forecast - by Type
- 8.1.1. Solar Photovoltaic (PV)
- 8.1.2. Concentrated Solar Power (CSP)
- 8.2. Market Analysis, Insights and Forecast - by Deployment Type
- 8.2.1. Rooftop
- 8.2.2. Ground-mounted
- 8.1. Market Analysis, Insights and Forecast - by Type
- 9. Middle East & Africa Solar Energy in Spain Market Analysis, Insights and Forecast, 2019-2031
- 9.1. Market Analysis, Insights and Forecast - by Type
- 9.1.1. Solar Photovoltaic (PV)
- 9.1.2. Concentrated Solar Power (CSP)
- 9.2. Market Analysis, Insights and Forecast - by Deployment Type
- 9.2.1. Rooftop
- 9.2.2. Ground-mounted
- 9.1. Market Analysis, Insights and Forecast - by Type
- 10. Asia Pacific Solar Energy in Spain Market Analysis, Insights and Forecast, 2019-2031
- 10.1. Market Analysis, Insights and Forecast - by Type
- 10.1.1. Solar Photovoltaic (PV)
- 10.1.2. Concentrated Solar Power (CSP)
- 10.2. Market Analysis, Insights and Forecast - by Deployment Type
- 10.2.1. Rooftop
- 10.2.2. Ground-mounted
- 10.1. Market Analysis, Insights and Forecast - by Type
- 11. Competitive Analysis
- 11.1. Global Market Share Analysis 2024
- 11.2. Company Profiles
- 11.2.1 JinkoSolar Holding Co Ltd
- 11.2.1.1. Overview
- 11.2.1.2. Products
- 11.2.1.3. SWOT Analysis
- 11.2.1.4. Recent Developments
- 11.2.1.5. Financials (Based on Availability)
- 11.2.2 COBRA Group
- 11.2.2.1. Overview
- 11.2.2.2. Products
- 11.2.2.3. SWOT Analysis
- 11.2.2.4. Recent Developments
- 11.2.2.5. Financials (Based on Availability)
- 11.2.3 Iberdrola SA
- 11.2.3.1. Overview
- 11.2.3.2. Products
- 11.2.3.3. SWOT Analysis
- 11.2.3.4. Recent Developments
- 11.2.3.5. Financials (Based on Availability)
- 11.2.4 Engie SA
- 11.2.4.1. Overview
- 11.2.4.2. Products
- 11.2.4.3. SWOT Analysis
- 11.2.4.4. Recent Developments
- 11.2.4.5. Financials (Based on Availability)
- 11.2.5 Solaria Energia y Medio Ambiente SA
- 11.2.5.1. Overview
- 11.2.5.2. Products
- 11.2.5.3. SWOT Analysis
- 11.2.5.4. Recent Developments
- 11.2.5.5. Financials (Based on Availability)
- 11.2.6 Gransolar Group
- 11.2.6.1. Overview
- 11.2.6.2. Products
- 11.2.6.3. SWOT Analysis
- 11.2.6.4. Recent Developments
- 11.2.6.5. Financials (Based on Availability)
- 11.2.7 Soltec Energias Renovables SL
- 11.2.7.1. Overview
- 11.2.7.2. Products
- 11.2.7.3. SWOT Analysis
- 11.2.7.4. Recent Developments
- 11.2.7.5. Financials (Based on Availability)
- 11.2.8 The Red Electrica Group
- 11.2.8.1. Overview
- 11.2.8.2. Products
- 11.2.8.3. SWOT Analysis
- 11.2.8.4. Recent Developments
- 11.2.8.5. Financials (Based on Availability)
- 11.2.9 Acciona SA
- 11.2.9.1. Overview
- 11.2.9.2. Products
- 11.2.9.3. SWOT Analysis
- 11.2.9.4. Recent Developments
- 11.2.9.5. Financials (Based on Availability)
- 11.2.10 Repsol SA
- 11.2.10.1. Overview
- 11.2.10.2. Products
- 11.2.10.3. SWOT Analysis
- 11.2.10.4. Recent Developments
- 11.2.10.5. Financials (Based on Availability)
- 11.2.1 JinkoSolar Holding Co Ltd
List of Figures
- Figure 1: Global Solar Energy in Spain Market Revenue Breakdown (Million, %) by Region 2024 & 2032
- Figure 2: Global Solar Energy in Spain Market Volume Breakdown (gigawatt, %) by Region 2024 & 2032
- Figure 3: Spain Solar Energy in Spain Market Revenue (Million), by Country 2024 & 2032
- Figure 4: Spain Solar Energy in Spain Market Volume (gigawatt), by Country 2024 & 2032
- Figure 5: Spain Solar Energy in Spain Market Revenue Share (%), by Country 2024 & 2032
- Figure 6: Spain Solar Energy in Spain Market Volume Share (%), by Country 2024 & 2032
- Figure 7: North America Solar Energy in Spain Market Revenue (Million), by Type 2024 & 2032
- Figure 8: North America Solar Energy in Spain Market Volume (gigawatt), by Type 2024 & 2032
- Figure 9: North America Solar Energy in Spain Market Revenue Share (%), by Type 2024 & 2032
- Figure 10: North America Solar Energy in Spain Market Volume Share (%), by Type 2024 & 2032
- Figure 11: North America Solar Energy in Spain Market Revenue (Million), by Deployment Type 2024 & 2032
- Figure 12: North America Solar Energy in Spain Market Volume (gigawatt), by Deployment Type 2024 & 2032
- Figure 13: North America Solar Energy in Spain Market Revenue Share (%), by Deployment Type 2024 & 2032
- Figure 14: North America Solar Energy in Spain Market Volume Share (%), by Deployment Type 2024 & 2032
- Figure 15: North America Solar Energy in Spain Market Revenue (Million), by Country 2024 & 2032
- Figure 16: North America Solar Energy in Spain Market Volume (gigawatt), by Country 2024 & 2032
- Figure 17: North America Solar Energy in Spain Market Revenue Share (%), by Country 2024 & 2032
- Figure 18: North America Solar Energy in Spain Market Volume Share (%), by Country 2024 & 2032
- Figure 19: South America Solar Energy in Spain Market Revenue (Million), by Type 2024 & 2032
- Figure 20: South America Solar Energy in Spain Market Volume (gigawatt), by Type 2024 & 2032
- Figure 21: South America Solar Energy in Spain Market Revenue Share (%), by Type 2024 & 2032
- Figure 22: South America Solar Energy in Spain Market Volume Share (%), by Type 2024 & 2032
- Figure 23: South America Solar Energy in Spain Market Revenue (Million), by Deployment Type 2024 & 2032
- Figure 24: South America Solar Energy in Spain Market Volume (gigawatt), by Deployment Type 2024 & 2032
- Figure 25: South America Solar Energy in Spain Market Revenue Share (%), by Deployment Type 2024 & 2032
- Figure 26: South America Solar Energy in Spain Market Volume Share (%), by Deployment Type 2024 & 2032
- Figure 27: South America Solar Energy in Spain Market Revenue (Million), by Country 2024 & 2032
- Figure 28: South America Solar Energy in Spain Market Volume (gigawatt), by Country 2024 & 2032
- Figure 29: South America Solar Energy in Spain Market Revenue Share (%), by Country 2024 & 2032
- Figure 30: South America Solar Energy in Spain Market Volume Share (%), by Country 2024 & 2032
- Figure 31: Europe Solar Energy in Spain Market Revenue (Million), by Type 2024 & 2032
- Figure 32: Europe Solar Energy in Spain Market Volume (gigawatt), by Type 2024 & 2032
- Figure 33: Europe Solar Energy in Spain Market Revenue Share (%), by Type 2024 & 2032
- Figure 34: Europe Solar Energy in Spain Market Volume Share (%), by Type 2024 & 2032
- Figure 35: Europe Solar Energy in Spain Market Revenue (Million), by Deployment Type 2024 & 2032
- Figure 36: Europe Solar Energy in Spain Market Volume (gigawatt), by Deployment Type 2024 & 2032
- Figure 37: Europe Solar Energy in Spain Market Revenue Share (%), by Deployment Type 2024 & 2032
- Figure 38: Europe Solar Energy in Spain Market Volume Share (%), by Deployment Type 2024 & 2032
- Figure 39: Europe Solar Energy in Spain Market Revenue (Million), by Country 2024 & 2032
- Figure 40: Europe Solar Energy in Spain Market Volume (gigawatt), by Country 2024 & 2032
- Figure 41: Europe Solar Energy in Spain Market Revenue Share (%), by Country 2024 & 2032
- Figure 42: Europe Solar Energy in Spain Market Volume Share (%), by Country 2024 & 2032
- Figure 43: Middle East & Africa Solar Energy in Spain Market Revenue (Million), by Type 2024 & 2032
- Figure 44: Middle East & Africa Solar Energy in Spain Market Volume (gigawatt), by Type 2024 & 2032
- Figure 45: Middle East & Africa Solar Energy in Spain Market Revenue Share (%), by Type 2024 & 2032
- Figure 46: Middle East & Africa Solar Energy in Spain Market Volume Share (%), by Type 2024 & 2032
- Figure 47: Middle East & Africa Solar Energy in Spain Market Revenue (Million), by Deployment Type 2024 & 2032
- Figure 48: Middle East & Africa Solar Energy in Spain Market Volume (gigawatt), by Deployment Type 2024 & 2032
- Figure 49: Middle East & Africa Solar Energy in Spain Market Revenue Share (%), by Deployment Type 2024 & 2032
- Figure 50: Middle East & Africa Solar Energy in Spain Market Volume Share (%), by Deployment Type 2024 & 2032
- Figure 51: Middle East & Africa Solar Energy in Spain Market Revenue (Million), by Country 2024 & 2032
- Figure 52: Middle East & Africa Solar Energy in Spain Market Volume (gigawatt), by Country 2024 & 2032
- Figure 53: Middle East & Africa Solar Energy in Spain Market Revenue Share (%), by Country 2024 & 2032
- Figure 54: Middle East & Africa Solar Energy in Spain Market Volume Share (%), by Country 2024 & 2032
- Figure 55: Asia Pacific Solar Energy in Spain Market Revenue (Million), by Type 2024 & 2032
- Figure 56: Asia Pacific Solar Energy in Spain Market Volume (gigawatt), by Type 2024 & 2032
- Figure 57: Asia Pacific Solar Energy in Spain Market Revenue Share (%), by Type 2024 & 2032
- Figure 58: Asia Pacific Solar Energy in Spain Market Volume Share (%), by Type 2024 & 2032
- Figure 59: Asia Pacific Solar Energy in Spain Market Revenue (Million), by Deployment Type 2024 & 2032
- Figure 60: Asia Pacific Solar Energy in Spain Market Volume (gigawatt), by Deployment Type 2024 & 2032
- Figure 61: Asia Pacific Solar Energy in Spain Market Revenue Share (%), by Deployment Type 2024 & 2032
- Figure 62: Asia Pacific Solar Energy in Spain Market Volume Share (%), by Deployment Type 2024 & 2032
- Figure 63: Asia Pacific Solar Energy in Spain Market Revenue (Million), by Country 2024 & 2032
- Figure 64: Asia Pacific Solar Energy in Spain Market Volume (gigawatt), by Country 2024 & 2032
- Figure 65: Asia Pacific Solar Energy in Spain Market Revenue Share (%), by Country 2024 & 2032
- Figure 66: Asia Pacific Solar Energy in Spain Market Volume Share (%), by Country 2024 & 2032
List of Tables
- Table 1: Global Solar Energy in Spain Market Revenue Million Forecast, by Region 2019 & 2032
- Table 2: Global Solar Energy in Spain Market Volume gigawatt Forecast, by Region 2019 & 2032
- Table 3: Global Solar Energy in Spain Market Revenue Million Forecast, by Type 2019 & 2032
- Table 4: Global Solar Energy in Spain Market Volume gigawatt Forecast, by Type 2019 & 2032
- Table 5: Global Solar Energy in Spain Market Revenue Million Forecast, by Deployment Type 2019 & 2032
- Table 6: Global Solar Energy in Spain Market Volume gigawatt Forecast, by Deployment Type 2019 & 2032
- Table 7: Global Solar Energy in Spain Market Revenue Million Forecast, by Region 2019 & 2032
- Table 8: Global Solar Energy in Spain Market Volume gigawatt Forecast, by Region 2019 & 2032
- Table 9: Global Solar Energy in Spain Market Revenue Million Forecast, by Country 2019 & 2032
- Table 10: Global Solar Energy in Spain Market Volume gigawatt Forecast, by Country 2019 & 2032
- Table 11: Global Solar Energy in Spain Market Revenue Million Forecast, by Type 2019 & 2032
- Table 12: Global Solar Energy in Spain Market Volume gigawatt Forecast, by Type 2019 & 2032
- Table 13: Global Solar Energy in Spain Market Revenue Million Forecast, by Deployment Type 2019 & 2032
- Table 14: Global Solar Energy in Spain Market Volume gigawatt Forecast, by Deployment Type 2019 & 2032
- Table 15: Global Solar Energy in Spain Market Revenue Million Forecast, by Country 2019 & 2032
- Table 16: Global Solar Energy in Spain Market Volume gigawatt Forecast, by Country 2019 & 2032
- Table 17: United States Solar Energy in Spain Market Revenue (Million) Forecast, by Application 2019 & 2032
- Table 18: United States Solar Energy in Spain Market Volume (gigawatt) Forecast, by Application 2019 & 2032
- Table 19: Canada Solar Energy in Spain Market Revenue (Million) Forecast, by Application 2019 & 2032
- Table 20: Canada Solar Energy in Spain Market Volume (gigawatt) Forecast, by Application 2019 & 2032
- Table 21: Mexico Solar Energy in Spain Market Revenue (Million) Forecast, by Application 2019 & 2032
- Table 22: Mexico Solar Energy in Spain Market Volume (gigawatt) Forecast, by Application 2019 & 2032
- Table 23: Global Solar Energy in Spain Market Revenue Million Forecast, by Type 2019 & 2032
- Table 24: Global Solar Energy in Spain Market Volume gigawatt Forecast, by Type 2019 & 2032
- Table 25: Global Solar Energy in Spain Market Revenue Million Forecast, by Deployment Type 2019 & 2032
- Table 26: Global Solar Energy in Spain Market Volume gigawatt Forecast, by Deployment Type 2019 & 2032
- Table 27: Global Solar Energy in Spain Market Revenue Million Forecast, by Country 2019 & 2032
- Table 28: Global Solar Energy in Spain Market Volume gigawatt Forecast, by Country 2019 & 2032
- Table 29: Brazil Solar Energy in Spain Market Revenue (Million) Forecast, by Application 2019 & 2032
- Table 30: Brazil Solar Energy in Spain Market Volume (gigawatt) Forecast, by Application 2019 & 2032
- Table 31: Argentina Solar Energy in Spain Market Revenue (Million) Forecast, by Application 2019 & 2032
- Table 32: Argentina Solar Energy in Spain Market Volume (gigawatt) Forecast, by Application 2019 & 2032
- Table 33: Rest of South America Solar Energy in Spain Market Revenue (Million) Forecast, by Application 2019 & 2032
- Table 34: Rest of South America Solar Energy in Spain Market Volume (gigawatt) Forecast, by Application 2019 & 2032
- Table 35: Global Solar Energy in Spain Market Revenue Million Forecast, by Type 2019 & 2032
- Table 36: Global Solar Energy in Spain Market Volume gigawatt Forecast, by Type 2019 & 2032
- Table 37: Global Solar Energy in Spain Market Revenue Million Forecast, by Deployment Type 2019 & 2032
- Table 38: Global Solar Energy in Spain Market Volume gigawatt Forecast, by Deployment Type 2019 & 2032
- Table 39: Global Solar Energy in Spain Market Revenue Million Forecast, by Country 2019 & 2032
- Table 40: Global Solar Energy in Spain Market Volume gigawatt Forecast, by Country 2019 & 2032
- Table 41: United Kingdom Solar Energy in Spain Market Revenue (Million) Forecast, by Application 2019 & 2032
- Table 42: United Kingdom Solar Energy in Spain Market Volume (gigawatt) Forecast, by Application 2019 & 2032
- Table 43: Germany Solar Energy in Spain Market Revenue (Million) Forecast, by Application 2019 & 2032
- Table 44: Germany Solar Energy in Spain Market Volume (gigawatt) Forecast, by Application 2019 & 2032
- Table 45: France Solar Energy in Spain Market Revenue (Million) Forecast, by Application 2019 & 2032
- Table 46: France Solar Energy in Spain Market Volume (gigawatt) Forecast, by Application 2019 & 2032
- Table 47: Italy Solar Energy in Spain Market Revenue (Million) Forecast, by Application 2019 & 2032
- Table 48: Italy Solar Energy in Spain Market Volume (gigawatt) Forecast, by Application 2019 & 2032
- Table 49: Spain Solar Energy in Spain Market Revenue (Million) Forecast, by Application 2019 & 2032
- Table 50: Spain Solar Energy in Spain Market Volume (gigawatt) Forecast, by Application 2019 & 2032
- Table 51: Russia Solar Energy in Spain Market Revenue (Million) Forecast, by Application 2019 & 2032
- Table 52: Russia Solar Energy in Spain Market Volume (gigawatt) Forecast, by Application 2019 & 2032
- Table 53: Benelux Solar Energy in Spain Market Revenue (Million) Forecast, by Application 2019 & 2032
- Table 54: Benelux Solar Energy in Spain Market Volume (gigawatt) Forecast, by Application 2019 & 2032
- Table 55: Nordics Solar Energy in Spain Market Revenue (Million) Forecast, by Application 2019 & 2032
- Table 56: Nordics Solar Energy in Spain Market Volume (gigawatt) Forecast, by Application 2019 & 2032
- Table 57: Rest of Europe Solar Energy in Spain Market Revenue (Million) Forecast, by Application 2019 & 2032
- Table 58: Rest of Europe Solar Energy in Spain Market Volume (gigawatt) Forecast, by Application 2019 & 2032
- Table 59: Global Solar Energy in Spain Market Revenue Million Forecast, by Type 2019 & 2032
- Table 60: Global Solar Energy in Spain Market Volume gigawatt Forecast, by Type 2019 & 2032
- Table 61: Global Solar Energy in Spain Market Revenue Million Forecast, by Deployment Type 2019 & 2032
- Table 62: Global Solar Energy in Spain Market Volume gigawatt Forecast, by Deployment Type 2019 & 2032
- Table 63: Global Solar Energy in Spain Market Revenue Million Forecast, by Country 2019 & 2032
- Table 64: Global Solar Energy in Spain Market Volume gigawatt Forecast, by Country 2019 & 2032
- Table 65: Turkey Solar Energy in Spain Market Revenue (Million) Forecast, by Application 2019 & 2032
- Table 66: Turkey Solar Energy in Spain Market Volume (gigawatt) Forecast, by Application 2019 & 2032
- Table 67: Israel Solar Energy in Spain Market Revenue (Million) Forecast, by Application 2019 & 2032
- Table 68: Israel Solar Energy in Spain Market Volume (gigawatt) Forecast, by Application 2019 & 2032
- Table 69: GCC Solar Energy in Spain Market Revenue (Million) Forecast, by Application 2019 & 2032
- Table 70: GCC Solar Energy in Spain Market Volume (gigawatt) Forecast, by Application 2019 & 2032
- Table 71: North Africa Solar Energy in Spain Market Revenue (Million) Forecast, by Application 2019 & 2032
- Table 72: North Africa Solar Energy in Spain Market Volume (gigawatt) Forecast, by Application 2019 & 2032
- Table 73: South Africa Solar Energy in Spain Market Revenue (Million) Forecast, by Application 2019 & 2032
- Table 74: South Africa Solar Energy in Spain Market Volume (gigawatt) Forecast, by Application 2019 & 2032
- Table 75: Rest of Middle East & Africa Solar Energy in Spain Market Revenue (Million) Forecast, by Application 2019 & 2032
- Table 76: Rest of Middle East & Africa Solar Energy in Spain Market Volume (gigawatt) Forecast, by Application 2019 & 2032
- Table 77: Global Solar Energy in Spain Market Revenue Million Forecast, by Type 2019 & 2032
- Table 78: Global Solar Energy in Spain Market Volume gigawatt Forecast, by Type 2019 & 2032
- Table 79: Global Solar Energy in Spain Market Revenue Million Forecast, by Deployment Type 2019 & 2032
- Table 80: Global Solar Energy in Spain Market Volume gigawatt Forecast, by Deployment Type 2019 & 2032
- Table 81: Global Solar Energy in Spain Market Revenue Million Forecast, by Country 2019 & 2032
- Table 82: Global Solar Energy in Spain Market Volume gigawatt Forecast, by Country 2019 & 2032
- Table 83: China Solar Energy in Spain Market Revenue (Million) Forecast, by Application 2019 & 2032
- Table 84: China Solar Energy in Spain Market Volume (gigawatt) Forecast, by Application 2019 & 2032
- Table 85: India Solar Energy in Spain Market Revenue (Million) Forecast, by Application 2019 & 2032
- Table 86: India Solar Energy in Spain Market Volume (gigawatt) Forecast, by Application 2019 & 2032
- Table 87: Japan Solar Energy in Spain Market Revenue (Million) Forecast, by Application 2019 & 2032
- Table 88: Japan Solar Energy in Spain Market Volume (gigawatt) Forecast, by Application 2019 & 2032
- Table 89: South Korea Solar Energy in Spain Market Revenue (Million) Forecast, by Application 2019 & 2032
- Table 90: South Korea Solar Energy in Spain Market Volume (gigawatt) Forecast, by Application 2019 & 2032
- Table 91: ASEAN Solar Energy in Spain Market Revenue (Million) Forecast, by Application 2019 & 2032
- Table 92: ASEAN Solar Energy in Spain Market Volume (gigawatt) Forecast, by Application 2019 & 2032
- Table 93: Oceania Solar Energy in Spain Market Revenue (Million) Forecast, by Application 2019 & 2032
- Table 94: Oceania Solar Energy in Spain Market Volume (gigawatt) Forecast, by Application 2019 & 2032
- Table 95: Rest of Asia Pacific Solar Energy in Spain Market Revenue (Million) Forecast, by Application 2019 & 2032
- Table 96: Rest of Asia Pacific Solar Energy in Spain Market Volume (gigawatt) Forecast, by Application 2019 & 2032
Frequently Asked Questions
1. What is the projected Compound Annual Growth Rate (CAGR) of the Solar Energy in Spain Market?
The projected CAGR is approximately 15.96%.
2. Which companies are prominent players in the Solar Energy in Spain Market?
Key companies in the market include JinkoSolar Holding Co Ltd, COBRA Group, Iberdrola SA, Engie SA, Solaria Energia y Medio Ambiente SA, Gransolar Group, Soltec Energias Renovables SL, The Red Electrica Group, Acciona SA, Repsol SA.
3. What are the main segments of the Solar Energy in Spain Market?
The market segments include Type, Deployment Type.
4. Can you provide details about the market size?
The market size is estimated to be USD XX Million as of 2022.
5. What are some drivers contributing to market growth?
Declining Cost of Solar PV Installations4.; Supportive Government Policies for Renewable Energy.
6. What are the notable trends driving market growth?
Solar Photovoltaic (PV) Type to Dominate the Market.
7. Are there any restraints impacting market growth?
Penetration of Other Energy Sources.
8. Can you provide examples of recent developments in the market?
February 2024: TotalEnergies SE concluded a deal with Synergia to acquire the 59 MW Dehesa Nueva del Rey solar PV project in Toledo province. Located in the town of Sesena, the project consists of over 95,000 solar PV panels and will be capable of meeting the energy demand of over 33,000 homes annually.
9. What pricing options are available for accessing the report?
Pricing options include single-user, multi-user, and enterprise licenses priced at USD 3800, USD 4500, and USD 5800 respectively.
10. Is the market size provided in terms of value or volume?
The market size is provided in terms of value, measured in Million and volume, measured in gigawatt.
11. Are there any specific market keywords associated with the report?
Yes, the market keyword associated with the report is "Solar Energy in Spain Market," which aids in identifying and referencing the specific market segment covered.
12. How do I determine which pricing option suits my needs best?
The pricing options vary based on user requirements and access needs. Individual users may opt for single-user licenses, while businesses requiring broader access may choose multi-user or enterprise licenses for cost-effective access to the report.
13. Are there any additional resources or data provided in the Solar Energy in Spain Market report?
While the report offers comprehensive insights, it's advisable to review the specific contents or supplementary materials provided to ascertain if additional resources or data are available.
14. How can I stay updated on further developments or reports in the Solar Energy in Spain Market?
To stay informed about further developments, trends, and reports in the Solar Energy in Spain Market, consider subscribing to industry newsletters, following relevant companies and organizations, or regularly checking reputable industry news sources and publications.
Methodology
Step 1 - Identification of Relevant Samples Size from Population Database


Step 2 - Approaches for Defining Global Market Size (Value, Volume* & Price*)

Note*: In applicable scenarios
Step 3 - Data Sources
Primary Research
- Web Analytics
- Survey Reports
- Research Institute
- Latest Research Reports
- Opinion Leaders
Secondary Research
- Annual Reports
- White Paper
- Latest Press Release
- Industry Association
- Paid Database
- Investor Presentations

Step 4 - Data Triangulation
Involves using different sources of information in order to increase the validity of a study
These sources are likely to be stakeholders in a program - participants, other researchers, program staff, other community members, and so on.
Then we put all data in single framework & apply various statistical tools to find out the dynamic on the market.
During the analysis stage, feedback from the stakeholder groups would be compared to determine areas of agreement as well as areas of divergence


