


Key Insights
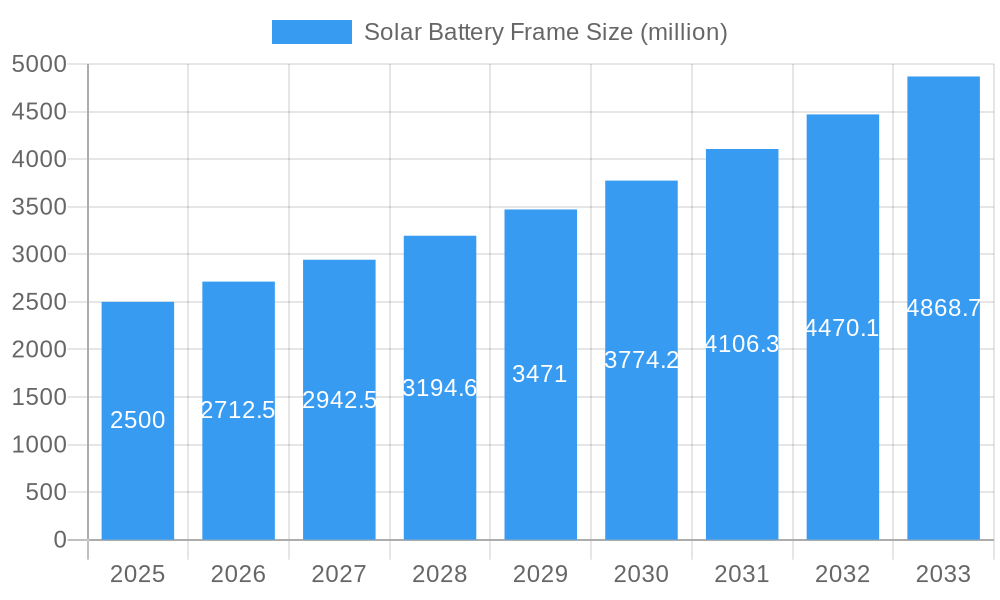
The global Solar Battery Frame market is poised for significant expansion, projected to reach a substantial market size of approximately \$2,500 million by 2025, with a robust Compound Annual Growth Rate (CAGR) of around 8.5% anticipated through 2033. This upward trajectory is primarily fueled by the escalating global demand for renewable energy solutions, particularly solar power. The photovoltaic sector stands out as the dominant application, driven by substantial investments in solar energy infrastructure worldwide. Growth in this segment is further propelled by advancements in solar panel technology, leading to increased adoption of more efficient and durable battery systems requiring robust framing. The construction sector also presents a growing opportunity, as solar energy integration becomes a standard practice in new building developments, demanding reliable and aesthetically pleasing solar battery frames.
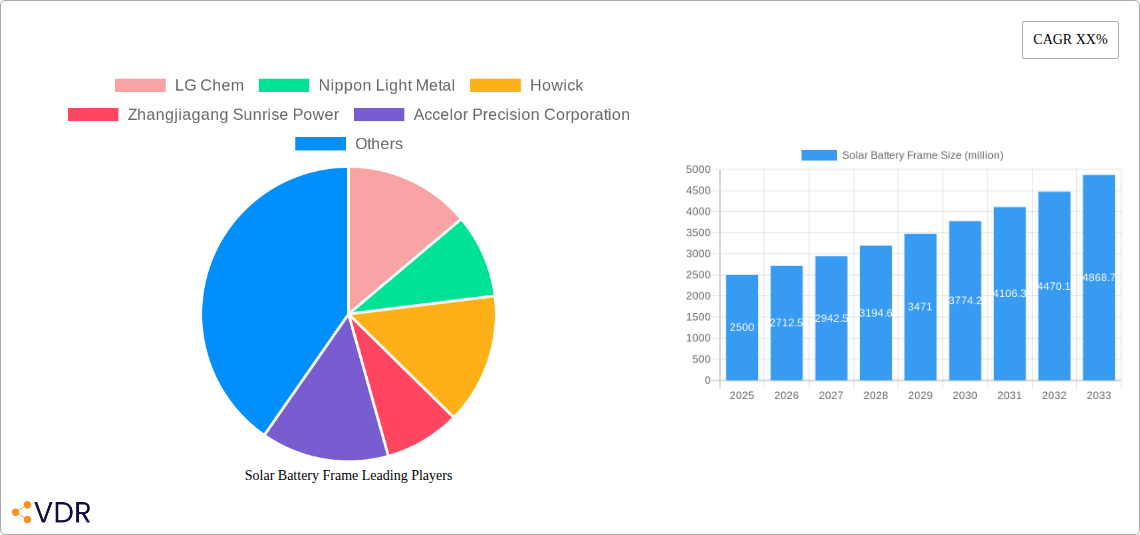
Solar Battery Frame Market Size (In Billion)

Key drivers for this market growth include supportive government policies and incentives aimed at promoting solar energy adoption, coupled with the declining costs of solar technology, making it increasingly competitive with traditional energy sources. The market is characterized by a strong emphasis on material innovation and product development. Aluminum frames are expected to dominate due to their favorable strength-to-weight ratio, corrosion resistance, and recyclability. However, stainless steel frames will maintain a significant share, particularly in applications demanding extreme durability and longevity. Emerging markets in Asia Pacific, led by China and India, are expected to be major growth engines, owing to large-scale solar projects and favorable manufacturing ecosystems. Restraints, such as fluctuating raw material prices and intense competition, will necessitate strategic sourcing and efficient manufacturing processes for market players.
Solar Battery Frame Company Market Share
Solar Battery Frame Market Dynamics & Structure
The global solar battery frame market is characterized by moderate concentration, with key players investing heavily in technological advancements and capacity expansion. Driven by the burgeoning demand for renewable energy solutions, innovation is primarily focused on enhancing frame durability, cost-effectiveness, and ease of installation. Regulatory frameworks, particularly government incentives for solar adoption and stringent environmental standards, play a crucial role in shaping market trajectories. Competitive product substitutes, such as alternative mounting systems, pose a secondary threat, yet the inherent advantages of robust battery frames in safeguarding energy storage systems maintain their dominance. End-user demographics are increasingly dominated by residential and utility-scale solar project developers, with a growing interest from the industrial and construction sectors seeking reliable energy storage integration. Mergers and acquisitions (M&A) are observed as companies aim to consolidate market share, acquire new technologies, and expand their geographical reach.
- Market Concentration: Dominated by a mix of established aluminum extruders and specialized solar component manufacturers.
- Technological Innovation Drivers: Focus on lightweight materials, enhanced corrosion resistance, and modular design for faster deployment.
- Regulatory Frameworks: Government subsidies for solar energy, building codes for renewable integration, and carbon emission reduction targets.
- Competitive Product Substitutes: Advanced mounting systems, integrated solar panel-battery solutions.
- End-User Demographics: Residential solar owners, utility-scale solar farm developers, industrial facilities, and commercial buildings.
- M&A Trends: Strategic acquisitions for technological integration and market expansion; estimated M&A deal volume of approximately 5 deals per year in the historical period.
Solar Battery Frame Growth Trends & Insights
The solar battery frame market is poised for substantial growth, propelled by the global imperative to transition towards sustainable energy. The market size is projected to witness a significant upward trajectory throughout the study period, driven by increasing installations of solar photovoltaic systems and the parallel rise in demand for reliable energy storage solutions. Adoption rates for solar battery systems, and consequently their protective frames, are accelerating as energy prices fluctuate and grid reliability becomes a paramount concern for both consumers and industries. Technological disruptions are continuously reshaping the landscape, with advancements in material science leading to lighter, stronger, and more eco-friendly frame designs. This includes the exploration of advanced alloys and composite materials that offer superior performance and a reduced environmental footprint. Consumer behavior is shifting towards a greater preference for integrated and aesthetically pleasing energy solutions, influencing the design and functionality of solar battery frames. The market penetration of battery storage within new solar installations is a key metric, projected to grow from approximately 15% in the historical period to an estimated 40% by 2033. The Compound Annual Growth Rate (CAGR) for the solar battery frame market is anticipated to be around 12.5% during the forecast period (2025–2033), reflecting robust expansion. Factors such as decreasing battery costs, increasing electricity prices, and government mandates for energy independence are further fueling this growth. The base year, 2025, is expected to see a market size of approximately $5.2 billion in value and 150 million units in volume. The forecast period will witness this market expand significantly, with the volume of solar battery frames sold reaching an estimated 350 million units by 2033. This growth is underpinned by both the expansion of existing solar markets and the emergence of new ones, particularly in developing economies seeking to leapfrog traditional energy infrastructure. The evolving consumer demand for energy resilience, coupled with corporate sustainability goals, is creating a consistent and escalating need for secure and durable battery storage solutions, for which the frame is an indispensable component.
Dominant Regions, Countries, or Segments in Solar Battery Frame
The Photovoltaic application segment, particularly within the Aluminum Frame type, is unequivocally the dominant force driving growth in the global solar battery frame market. This dominance is a direct consequence of the widespread adoption of solar energy systems, where photovoltaic panels are the primary energy generation source, and batteries are essential for energy storage and grid stability.
Key Drivers of Dominance (Photovoltaic Application, Aluminum Frame Type):
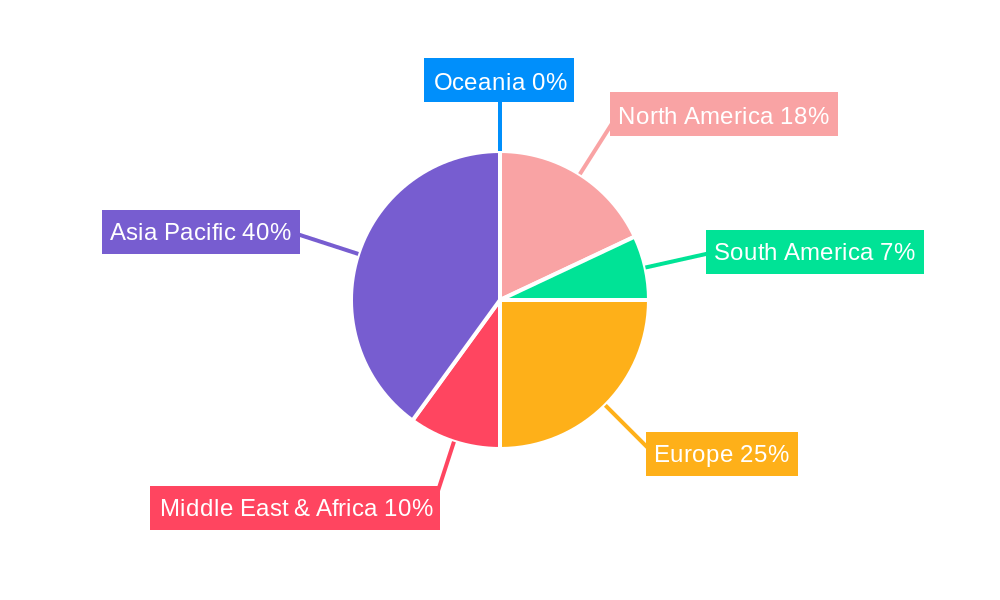
- Global Solar Energy Expansion: The exponential growth of solar photovoltaic installations worldwide, driven by declining costs, government incentives, and environmental concerns, directly translates to a massive demand for solar battery frames. Regions with strong solar policies and high solar irradiance, such as Asia-Pacific, North America, and Europe, are leading this charge. The photovoltaic segment is estimated to account for over 80% of the total solar battery frame market volume in 2025.
- Energy Storage Integration: As solar power becomes more intermittent, the need for efficient energy storage solutions, including battery systems, is paramount. Solar battery frames are crucial for the safe and reliable operation of these battery banks, ensuring their protection from environmental factors and physical damage. The increasing integration of battery storage with solar PV systems is a major catalyst.
- Aluminum's Superior Properties: Aluminum frames are the preferred choice due to their lightweight nature, excellent corrosion resistance, high strength-to-weight ratio, and recyclability. These properties are ideal for outdoor solar installations, where durability and longevity are critical. Aluminum frames are estimated to hold over 90% market share within the types segment.
- Cost-Effectiveness and Scalability: Aluminum extrusion processes allow for cost-effective mass production, meeting the high-volume demands of the solar industry. Manufacturers like Nippon Light Metal and Wellste Aluminum have established robust supply chains to cater to this need.
- Technological Advancements: Continuous innovation in aluminum alloys and manufacturing techniques further enhances the performance and applicability of aluminum frames for various solar battery configurations.
- Supporting Infrastructure and Policy: Favorable government policies promoting renewable energy adoption, coupled with the development of robust manufacturing and installation infrastructure, further bolster the dominance of aluminum frames in the photovoltaic sector. Countries like China, a manufacturing powerhouse, with companies like Akcome and Donghua Aluminum, are major contributors to this segment's growth, producing an estimated 120 million units of aluminum solar battery frames in 2025.
While other applications like industrial energy storage and construction sector integration are growing, they currently represent a smaller portion of the market compared to the pervasive need for frames in photovoltaic systems. The base year, 2025, anticipates the Photovoltaic application to contribute approximately $4.16 billion in revenue and 120 million units in volume, with the Aluminum Frame type constituting the lion's share within this.
Solar Battery Frame Product Landscape
The solar battery frame market is characterized by a landscape of increasingly sophisticated and optimized products. Innovation centers on enhancing durability, safety, and cost-efficiency. Aluminum frames remain dominant due to their superior corrosion resistance, lightweight properties, and recyclability, with advanced alloys offering enhanced structural integrity and weatherproofing. Stainless steel frames are also present, favored for their exceptional strength and longevity in demanding environments, albeit at a higher cost. Product development focuses on modular designs for simplified installation and maintenance, improved thermal management to optimize battery performance, and robust sealing mechanisms to protect against dust and moisture ingress. Unique selling propositions often revolve around extended warranty periods, compliance with stringent international safety standards, and customized solutions for diverse battery chemistries and configurations. Technological advancements include integrated grounding points, seismic resistance features, and aesthetically pleasing finishes for residential applications.
Key Drivers, Barriers & Challenges in Solar Battery Frame
Key Drivers:
- Surging Demand for Renewable Energy: The global push for clean energy sources, driven by climate change concerns and government mandates, is the primary accelerator for solar battery adoption and, consequently, frame demand.
- Energy Independence and Grid Stability: Increasing concerns about energy security and grid reliability are fueling the demand for distributed energy storage solutions, making solar battery systems and their frames indispensable.
- Declining Battery Costs: As battery technology matures and costs decrease, solar battery systems become more economically viable for a wider range of applications, further boosting frame sales.
- Technological Advancements: Innovations in frame materials and design, leading to lighter, stronger, and more cost-effective solutions, are driving market adoption.
Key Barriers & Challenges:
- Supply Chain Volatility: Disruptions in the supply of raw materials like aluminum and steel, coupled with geopolitical uncertainties, can lead to price fluctuations and production delays, impacting the overall cost and availability of frames.
- Intense Competition and Price Pressure: The market is highly competitive, with numerous manufacturers, leading to significant price pressure and potentially impacting profit margins.
- Stringent Quality and Safety Standards: Meeting evolving and stringent international quality and safety certifications for battery enclosures can be a barrier for smaller manufacturers.
- Logistical Complexities: The global nature of the solar industry presents logistical challenges in terms of transportation and distribution of large and sometimes heavy frame components.
Emerging Opportunities in Solar Battery Frame
Emerging opportunities in the solar battery frame market lie in catering to the growing demand for integrated energy storage systems, particularly for residential and small commercial applications. The development of smart, modular frames that facilitate easier integration with existing solar infrastructure and smart home technologies presents a significant avenue. Furthermore, the expansion into emerging markets with less developed grid infrastructure offers substantial potential for off-grid and microgrid solutions that rely heavily on battery storage. Innovations in sustainable and recycled materials for frame manufacturing are also gaining traction, aligning with the broader environmental ethos of the solar industry. The increasing focus on electric vehicle (EV) charging infrastructure, which often incorporates battery storage, could also open new application areas for specialized battery frames.
Growth Accelerators in the Solar Battery Frame Industry
The solar battery frame industry is propelled by several key growth accelerators. Technological breakthroughs in material science, leading to lighter, more durable, and cost-effective frame materials, are critical. Strategic partnerships between frame manufacturers, battery producers, and solar developers are essential for creating integrated solutions and streamlining the supply chain. Market expansion strategies, including entering new geographical regions and targeting emerging applications such as floating solar farms and building-integrated photovoltaics (BIPV), will also drive long-term growth. Furthermore, the continuous development of innovative manufacturing processes that enhance efficiency and reduce production costs will be pivotal in sustaining market expansion.
Key Players Shaping the Solar Battery Frame Market
- LG Chem
- Nippon Light Metal
- Howick
- Zhangjiagang Sunrise Power
- Accelor Precision Corporation
- Wellste Aluminum
- Fujian Fenan Aluminum
- Chuangjia Aluminium
- Donghua Aluminum
- Sentong Photovoltaic
- Akcome
Notable Milestones in Solar Battery Frame Sector
- 2019: Increased adoption of advanced aluminum alloys for enhanced corrosion resistance in solar battery frames.
- 2020: Rise in demand for frames designed for higher energy density battery chemistries.
- 2021: Introduction of modular and customizable frame solutions to cater to diverse project needs.
- 2022: Growing emphasis on sustainable manufacturing practices and the use of recycled materials in frame production.
- 2023: Development of frames with integrated thermal management features to optimize battery performance and lifespan.
- 2024: Increased M&A activity as larger companies acquire specialized frame manufacturers to expand their product portfolios.
In-Depth Solar Battery Frame Market Outlook
The future outlook for the solar battery frame market is exceptionally robust, driven by the unyielding global transition towards renewable energy. Growth accelerators such as continuous material science innovations, the increasing integration of battery storage in photovoltaic systems, and strategic collaborations among industry stakeholders will pave the way for sustained expansion. The market is poised to witness significant growth in its capacity to support reliable and resilient energy solutions. Companies that focus on developing advanced, cost-effective, and sustainable frame designs will be well-positioned to capitalize on emerging opportunities, particularly in expanding markets and niche applications. The estimated market volume in 2033 is projected to reach 350 million units, indicating a substantial increase from the base year of 150 million units.
Solar Battery Frame Segmentation
-
1. Application
- 1.1. Photovoltaic
- 1.2. Industrial
- 1.3. Construction Sector
- 1.4. Others
-
2. Types
- 2.1. Stainless Steel Frame
- 2.2. Aluminum Frame
- 2.3. Rubber Frame
- 2.4. Plastic Frame
- 2.5. Others
Solar Battery Frame Segmentation By Geography
-
1. North America
- 1.1. United States
- 1.2. Canada
- 1.3. Mexico
-
2. South America
- 2.1. Brazil
- 2.2. Argentina
- 2.3. Rest of South America
-
3. Europe
- 3.1. United Kingdom
- 3.2. Germany
- 3.3. France
- 3.4. Italy
- 3.5. Spain
- 3.6. Russia
- 3.7. Benelux
- 3.8. Nordics
- 3.9. Rest of Europe
-
4. Middle East & Africa
- 4.1. Turkey
- 4.2. Israel
- 4.3. GCC
- 4.4. North Africa
- 4.5. South Africa
- 4.6. Rest of Middle East & Africa
-
5. Asia Pacific
- 5.1. China
- 5.2. India
- 5.3. Japan
- 5.4. South Korea
- 5.5. ASEAN
- 5.6. Oceania
- 5.7. Rest of Asia Pacific
Solar Battery Frame Regional Market Share
Geographic Coverage of Solar Battery Frame
Solar Battery Frame REPORT HIGHLIGHTS
| Aspects | Details |
|---|---|
| Study Period | 2020-2034 |
| Base Year | 2025 |
| Estimated Year | 2026 |
| Forecast Period | 2026-2034 |
| Historical Period | 2020-2025 |
| Growth Rate | CAGR of 8% from 2020-2034 |
| Segmentation |
|
Table of Contents
- 1. Introduction
- 1.1. Research Scope
- 1.2. Market Segmentation
- 1.3. Research Methodology
- 1.4. Definitions and Assumptions
- 2. Executive Summary
- 2.1. Introduction
- 3. Market Dynamics
- 3.1. Introduction
- 3.2. Market Drivers
- 3.3. Market Restrains
- 3.4. Market Trends
- 4. Market Factor Analysis
- 4.1. Porters Five Forces
- 4.2. Supply/Value Chain
- 4.3. PESTEL analysis
- 4.4. Market Entropy
- 4.5. Patent/Trademark Analysis
- 5. Global Solar Battery Frame Analysis, Insights and Forecast, 2020-2032
- 5.1. Market Analysis, Insights and Forecast - by Application
- 5.1.1. Photovoltaic
- 5.1.2. Industrial
- 5.1.3. Construction Sector
- 5.1.4. Others
- 5.2. Market Analysis, Insights and Forecast - by Types
- 5.2.1. Stainless Steel Frame
- 5.2.2. Aluminum Frame
- 5.2.3. Rubber Frame
- 5.2.4. Plastic Frame
- 5.2.5. Others
- 5.3. Market Analysis, Insights and Forecast - by Region
- 5.3.1. North America
- 5.3.2. South America
- 5.3.3. Europe
- 5.3.4. Middle East & Africa
- 5.3.5. Asia Pacific
- 5.1. Market Analysis, Insights and Forecast - by Application
- 6. North America Solar Battery Frame Analysis, Insights and Forecast, 2020-2032
- 6.1. Market Analysis, Insights and Forecast - by Application
- 6.1.1. Photovoltaic
- 6.1.2. Industrial
- 6.1.3. Construction Sector
- 6.1.4. Others
- 6.2. Market Analysis, Insights and Forecast - by Types
- 6.2.1. Stainless Steel Frame
- 6.2.2. Aluminum Frame
- 6.2.3. Rubber Frame
- 6.2.4. Plastic Frame
- 6.2.5. Others
- 6.1. Market Analysis, Insights and Forecast - by Application
- 7. South America Solar Battery Frame Analysis, Insights and Forecast, 2020-2032
- 7.1. Market Analysis, Insights and Forecast - by Application
- 7.1.1. Photovoltaic
- 7.1.2. Industrial
- 7.1.3. Construction Sector
- 7.1.4. Others
- 7.2. Market Analysis, Insights and Forecast - by Types
- 7.2.1. Stainless Steel Frame
- 7.2.2. Aluminum Frame
- 7.2.3. Rubber Frame
- 7.2.4. Plastic Frame
- 7.2.5. Others
- 7.1. Market Analysis, Insights and Forecast - by Application
- 8. Europe Solar Battery Frame Analysis, Insights and Forecast, 2020-2032
- 8.1. Market Analysis, Insights and Forecast - by Application
- 8.1.1. Photovoltaic
- 8.1.2. Industrial
- 8.1.3. Construction Sector
- 8.1.4. Others
- 8.2. Market Analysis, Insights and Forecast - by Types
- 8.2.1. Stainless Steel Frame
- 8.2.2. Aluminum Frame
- 8.2.3. Rubber Frame
- 8.2.4. Plastic Frame
- 8.2.5. Others
- 8.1. Market Analysis, Insights and Forecast - by Application
- 9. Middle East & Africa Solar Battery Frame Analysis, Insights and Forecast, 2020-2032
- 9.1. Market Analysis, Insights and Forecast - by Application
- 9.1.1. Photovoltaic
- 9.1.2. Industrial
- 9.1.3. Construction Sector
- 9.1.4. Others
- 9.2. Market Analysis, Insights and Forecast - by Types
- 9.2.1. Stainless Steel Frame
- 9.2.2. Aluminum Frame
- 9.2.3. Rubber Frame
- 9.2.4. Plastic Frame
- 9.2.5. Others
- 9.1. Market Analysis, Insights and Forecast - by Application
- 10. Asia Pacific Solar Battery Frame Analysis, Insights and Forecast, 2020-2032
- 10.1. Market Analysis, Insights and Forecast - by Application
- 10.1.1. Photovoltaic
- 10.1.2. Industrial
- 10.1.3. Construction Sector
- 10.1.4. Others
- 10.2. Market Analysis, Insights and Forecast - by Types
- 10.2.1. Stainless Steel Frame
- 10.2.2. Aluminum Frame
- 10.2.3. Rubber Frame
- 10.2.4. Plastic Frame
- 10.2.5. Others
- 10.1. Market Analysis, Insights and Forecast - by Application
- 11. Competitive Analysis
- 11.1. Global Market Share Analysis 2025
- 11.2. Company Profiles
- 11.2.1 LG Chem
- 11.2.1.1. Overview
- 11.2.1.2. Products
- 11.2.1.3. SWOT Analysis
- 11.2.1.4. Recent Developments
- 11.2.1.5. Financials (Based on Availability)
- 11.2.2 Nippon Light Metal
- 11.2.2.1. Overview
- 11.2.2.2. Products
- 11.2.2.3. SWOT Analysis
- 11.2.2.4. Recent Developments
- 11.2.2.5. Financials (Based on Availability)
- 11.2.3 Howick
- 11.2.3.1. Overview
- 11.2.3.2. Products
- 11.2.3.3. SWOT Analysis
- 11.2.3.4. Recent Developments
- 11.2.3.5. Financials (Based on Availability)
- 11.2.4 Zhangjiagang Sunrise Power
- 11.2.4.1. Overview
- 11.2.4.2. Products
- 11.2.4.3. SWOT Analysis
- 11.2.4.4. Recent Developments
- 11.2.4.5. Financials (Based on Availability)
- 11.2.5 Accelor Precision Corporation
- 11.2.5.1. Overview
- 11.2.5.2. Products
- 11.2.5.3. SWOT Analysis
- 11.2.5.4. Recent Developments
- 11.2.5.5. Financials (Based on Availability)
- 11.2.6 Wellste Aluminum
- 11.2.6.1. Overview
- 11.2.6.2. Products
- 11.2.6.3. SWOT Analysis
- 11.2.6.4. Recent Developments
- 11.2.6.5. Financials (Based on Availability)
- 11.2.7 Fujian Fenan Aluminum
- 11.2.7.1. Overview
- 11.2.7.2. Products
- 11.2.7.3. SWOT Analysis
- 11.2.7.4. Recent Developments
- 11.2.7.5. Financials (Based on Availability)
- 11.2.8 Chuangjia Aluminium
- 11.2.8.1. Overview
- 11.2.8.2. Products
- 11.2.8.3. SWOT Analysis
- 11.2.8.4. Recent Developments
- 11.2.8.5. Financials (Based on Availability)
- 11.2.9 Donghua Aluminum
- 11.2.9.1. Overview
- 11.2.9.2. Products
- 11.2.9.3. SWOT Analysis
- 11.2.9.4. Recent Developments
- 11.2.9.5. Financials (Based on Availability)
- 11.2.10 Sentong Photovoltaic
- 11.2.10.1. Overview
- 11.2.10.2. Products
- 11.2.10.3. SWOT Analysis
- 11.2.10.4. Recent Developments
- 11.2.10.5. Financials (Based on Availability)
- 11.2.11 Akcome
- 11.2.11.1. Overview
- 11.2.11.2. Products
- 11.2.11.3. SWOT Analysis
- 11.2.11.4. Recent Developments
- 11.2.11.5. Financials (Based on Availability)
- 11.2.1 LG Chem
List of Figures
- Figure 1: Global Solar Battery Frame Revenue Breakdown (undefined, %) by Region 2025 & 2033
- Figure 2: Global Solar Battery Frame Volume Breakdown (K, %) by Region 2025 & 2033
- Figure 3: North America Solar Battery Frame Revenue (undefined), by Application 2025 & 2033
- Figure 4: North America Solar Battery Frame Volume (K), by Application 2025 & 2033
- Figure 5: North America Solar Battery Frame Revenue Share (%), by Application 2025 & 2033
- Figure 6: North America Solar Battery Frame Volume Share (%), by Application 2025 & 2033
- Figure 7: North America Solar Battery Frame Revenue (undefined), by Types 2025 & 2033
- Figure 8: North America Solar Battery Frame Volume (K), by Types 2025 & 2033
- Figure 9: North America Solar Battery Frame Revenue Share (%), by Types 2025 & 2033
- Figure 10: North America Solar Battery Frame Volume Share (%), by Types 2025 & 2033
- Figure 11: North America Solar Battery Frame Revenue (undefined), by Country 2025 & 2033
- Figure 12: North America Solar Battery Frame Volume (K), by Country 2025 & 2033
- Figure 13: North America Solar Battery Frame Revenue Share (%), by Country 2025 & 2033
- Figure 14: North America Solar Battery Frame Volume Share (%), by Country 2025 & 2033
- Figure 15: South America Solar Battery Frame Revenue (undefined), by Application 2025 & 2033
- Figure 16: South America Solar Battery Frame Volume (K), by Application 2025 & 2033
- Figure 17: South America Solar Battery Frame Revenue Share (%), by Application 2025 & 2033
- Figure 18: South America Solar Battery Frame Volume Share (%), by Application 2025 & 2033
- Figure 19: South America Solar Battery Frame Revenue (undefined), by Types 2025 & 2033
- Figure 20: South America Solar Battery Frame Volume (K), by Types 2025 & 2033
- Figure 21: South America Solar Battery Frame Revenue Share (%), by Types 2025 & 2033
- Figure 22: South America Solar Battery Frame Volume Share (%), by Types 2025 & 2033
- Figure 23: South America Solar Battery Frame Revenue (undefined), by Country 2025 & 2033
- Figure 24: South America Solar Battery Frame Volume (K), by Country 2025 & 2033
- Figure 25: South America Solar Battery Frame Revenue Share (%), by Country 2025 & 2033
- Figure 26: South America Solar Battery Frame Volume Share (%), by Country 2025 & 2033
- Figure 27: Europe Solar Battery Frame Revenue (undefined), by Application 2025 & 2033
- Figure 28: Europe Solar Battery Frame Volume (K), by Application 2025 & 2033
- Figure 29: Europe Solar Battery Frame Revenue Share (%), by Application 2025 & 2033
- Figure 30: Europe Solar Battery Frame Volume Share (%), by Application 2025 & 2033
- Figure 31: Europe Solar Battery Frame Revenue (undefined), by Types 2025 & 2033
- Figure 32: Europe Solar Battery Frame Volume (K), by Types 2025 & 2033
- Figure 33: Europe Solar Battery Frame Revenue Share (%), by Types 2025 & 2033
- Figure 34: Europe Solar Battery Frame Volume Share (%), by Types 2025 & 2033
- Figure 35: Europe Solar Battery Frame Revenue (undefined), by Country 2025 & 2033
- Figure 36: Europe Solar Battery Frame Volume (K), by Country 2025 & 2033
- Figure 37: Europe Solar Battery Frame Revenue Share (%), by Country 2025 & 2033
- Figure 38: Europe Solar Battery Frame Volume Share (%), by Country 2025 & 2033
- Figure 39: Middle East & Africa Solar Battery Frame Revenue (undefined), by Application 2025 & 2033
- Figure 40: Middle East & Africa Solar Battery Frame Volume (K), by Application 2025 & 2033
- Figure 41: Middle East & Africa Solar Battery Frame Revenue Share (%), by Application 2025 & 2033
- Figure 42: Middle East & Africa Solar Battery Frame Volume Share (%), by Application 2025 & 2033
- Figure 43: Middle East & Africa Solar Battery Frame Revenue (undefined), by Types 2025 & 2033
- Figure 44: Middle East & Africa Solar Battery Frame Volume (K), by Types 2025 & 2033
- Figure 45: Middle East & Africa Solar Battery Frame Revenue Share (%), by Types 2025 & 2033
- Figure 46: Middle East & Africa Solar Battery Frame Volume Share (%), by Types 2025 & 2033
- Figure 47: Middle East & Africa Solar Battery Frame Revenue (undefined), by Country 2025 & 2033
- Figure 48: Middle East & Africa Solar Battery Frame Volume (K), by Country 2025 & 2033
- Figure 49: Middle East & Africa Solar Battery Frame Revenue Share (%), by Country 2025 & 2033
- Figure 50: Middle East & Africa Solar Battery Frame Volume Share (%), by Country 2025 & 2033
- Figure 51: Asia Pacific Solar Battery Frame Revenue (undefined), by Application 2025 & 2033
- Figure 52: Asia Pacific Solar Battery Frame Volume (K), by Application 2025 & 2033
- Figure 53: Asia Pacific Solar Battery Frame Revenue Share (%), by Application 2025 & 2033
- Figure 54: Asia Pacific Solar Battery Frame Volume Share (%), by Application 2025 & 2033
- Figure 55: Asia Pacific Solar Battery Frame Revenue (undefined), by Types 2025 & 2033
- Figure 56: Asia Pacific Solar Battery Frame Volume (K), by Types 2025 & 2033
- Figure 57: Asia Pacific Solar Battery Frame Revenue Share (%), by Types 2025 & 2033
- Figure 58: Asia Pacific Solar Battery Frame Volume Share (%), by Types 2025 & 2033
- Figure 59: Asia Pacific Solar Battery Frame Revenue (undefined), by Country 2025 & 2033
- Figure 60: Asia Pacific Solar Battery Frame Volume (K), by Country 2025 & 2033
- Figure 61: Asia Pacific Solar Battery Frame Revenue Share (%), by Country 2025 & 2033
- Figure 62: Asia Pacific Solar Battery Frame Volume Share (%), by Country 2025 & 2033
List of Tables
- Table 1: Global Solar Battery Frame Revenue undefined Forecast, by Application 2020 & 2033
- Table 2: Global Solar Battery Frame Volume K Forecast, by Application 2020 & 2033
- Table 3: Global Solar Battery Frame Revenue undefined Forecast, by Types 2020 & 2033
- Table 4: Global Solar Battery Frame Volume K Forecast, by Types 2020 & 2033
- Table 5: Global Solar Battery Frame Revenue undefined Forecast, by Region 2020 & 2033
- Table 6: Global Solar Battery Frame Volume K Forecast, by Region 2020 & 2033
- Table 7: Global Solar Battery Frame Revenue undefined Forecast, by Application 2020 & 2033
- Table 8: Global Solar Battery Frame Volume K Forecast, by Application 2020 & 2033
- Table 9: Global Solar Battery Frame Revenue undefined Forecast, by Types 2020 & 2033
- Table 10: Global Solar Battery Frame Volume K Forecast, by Types 2020 & 2033
- Table 11: Global Solar Battery Frame Revenue undefined Forecast, by Country 2020 & 2033
- Table 12: Global Solar Battery Frame Volume K Forecast, by Country 2020 & 2033
- Table 13: United States Solar Battery Frame Revenue (undefined) Forecast, by Application 2020 & 2033
- Table 14: United States Solar Battery Frame Volume (K) Forecast, by Application 2020 & 2033
- Table 15: Canada Solar Battery Frame Revenue (undefined) Forecast, by Application 2020 & 2033
- Table 16: Canada Solar Battery Frame Volume (K) Forecast, by Application 2020 & 2033
- Table 17: Mexico Solar Battery Frame Revenue (undefined) Forecast, by Application 2020 & 2033
- Table 18: Mexico Solar Battery Frame Volume (K) Forecast, by Application 2020 & 2033
- Table 19: Global Solar Battery Frame Revenue undefined Forecast, by Application 2020 & 2033
- Table 20: Global Solar Battery Frame Volume K Forecast, by Application 2020 & 2033
- Table 21: Global Solar Battery Frame Revenue undefined Forecast, by Types 2020 & 2033
- Table 22: Global Solar Battery Frame Volume K Forecast, by Types 2020 & 2033
- Table 23: Global Solar Battery Frame Revenue undefined Forecast, by Country 2020 & 2033
- Table 24: Global Solar Battery Frame Volume K Forecast, by Country 2020 & 2033
- Table 25: Brazil Solar Battery Frame Revenue (undefined) Forecast, by Application 2020 & 2033
- Table 26: Brazil Solar Battery Frame Volume (K) Forecast, by Application 2020 & 2033
- Table 27: Argentina Solar Battery Frame Revenue (undefined) Forecast, by Application 2020 & 2033
- Table 28: Argentina Solar Battery Frame Volume (K) Forecast, by Application 2020 & 2033
- Table 29: Rest of South America Solar Battery Frame Revenue (undefined) Forecast, by Application 2020 & 2033
- Table 30: Rest of South America Solar Battery Frame Volume (K) Forecast, by Application 2020 & 2033
- Table 31: Global Solar Battery Frame Revenue undefined Forecast, by Application 2020 & 2033
- Table 32: Global Solar Battery Frame Volume K Forecast, by Application 2020 & 2033
- Table 33: Global Solar Battery Frame Revenue undefined Forecast, by Types 2020 & 2033
- Table 34: Global Solar Battery Frame Volume K Forecast, by Types 2020 & 2033
- Table 35: Global Solar Battery Frame Revenue undefined Forecast, by Country 2020 & 2033
- Table 36: Global Solar Battery Frame Volume K Forecast, by Country 2020 & 2033
- Table 37: United Kingdom Solar Battery Frame Revenue (undefined) Forecast, by Application 2020 & 2033
- Table 38: United Kingdom Solar Battery Frame Volume (K) Forecast, by Application 2020 & 2033
- Table 39: Germany Solar Battery Frame Revenue (undefined) Forecast, by Application 2020 & 2033
- Table 40: Germany Solar Battery Frame Volume (K) Forecast, by Application 2020 & 2033
- Table 41: France Solar Battery Frame Revenue (undefined) Forecast, by Application 2020 & 2033
- Table 42: France Solar Battery Frame Volume (K) Forecast, by Application 2020 & 2033
- Table 43: Italy Solar Battery Frame Revenue (undefined) Forecast, by Application 2020 & 2033
- Table 44: Italy Solar Battery Frame Volume (K) Forecast, by Application 2020 & 2033
- Table 45: Spain Solar Battery Frame Revenue (undefined) Forecast, by Application 2020 & 2033
- Table 46: Spain Solar Battery Frame Volume (K) Forecast, by Application 2020 & 2033
- Table 47: Russia Solar Battery Frame Revenue (undefined) Forecast, by Application 2020 & 2033
- Table 48: Russia Solar Battery Frame Volume (K) Forecast, by Application 2020 & 2033
- Table 49: Benelux Solar Battery Frame Revenue (undefined) Forecast, by Application 2020 & 2033
- Table 50: Benelux Solar Battery Frame Volume (K) Forecast, by Application 2020 & 2033
- Table 51: Nordics Solar Battery Frame Revenue (undefined) Forecast, by Application 2020 & 2033
- Table 52: Nordics Solar Battery Frame Volume (K) Forecast, by Application 2020 & 2033
- Table 53: Rest of Europe Solar Battery Frame Revenue (undefined) Forecast, by Application 2020 & 2033
- Table 54: Rest of Europe Solar Battery Frame Volume (K) Forecast, by Application 2020 & 2033
- Table 55: Global Solar Battery Frame Revenue undefined Forecast, by Application 2020 & 2033
- Table 56: Global Solar Battery Frame Volume K Forecast, by Application 2020 & 2033
- Table 57: Global Solar Battery Frame Revenue undefined Forecast, by Types 2020 & 2033
- Table 58: Global Solar Battery Frame Volume K Forecast, by Types 2020 & 2033
- Table 59: Global Solar Battery Frame Revenue undefined Forecast, by Country 2020 & 2033
- Table 60: Global Solar Battery Frame Volume K Forecast, by Country 2020 & 2033
- Table 61: Turkey Solar Battery Frame Revenue (undefined) Forecast, by Application 2020 & 2033
- Table 62: Turkey Solar Battery Frame Volume (K) Forecast, by Application 2020 & 2033
- Table 63: Israel Solar Battery Frame Revenue (undefined) Forecast, by Application 2020 & 2033
- Table 64: Israel Solar Battery Frame Volume (K) Forecast, by Application 2020 & 2033
- Table 65: GCC Solar Battery Frame Revenue (undefined) Forecast, by Application 2020 & 2033
- Table 66: GCC Solar Battery Frame Volume (K) Forecast, by Application 2020 & 2033
- Table 67: North Africa Solar Battery Frame Revenue (undefined) Forecast, by Application 2020 & 2033
- Table 68: North Africa Solar Battery Frame Volume (K) Forecast, by Application 2020 & 2033
- Table 69: South Africa Solar Battery Frame Revenue (undefined) Forecast, by Application 2020 & 2033
- Table 70: South Africa Solar Battery Frame Volume (K) Forecast, by Application 2020 & 2033
- Table 71: Rest of Middle East & Africa Solar Battery Frame Revenue (undefined) Forecast, by Application 2020 & 2033
- Table 72: Rest of Middle East & Africa Solar Battery Frame Volume (K) Forecast, by Application 2020 & 2033
- Table 73: Global Solar Battery Frame Revenue undefined Forecast, by Application 2020 & 2033
- Table 74: Global Solar Battery Frame Volume K Forecast, by Application 2020 & 2033
- Table 75: Global Solar Battery Frame Revenue undefined Forecast, by Types 2020 & 2033
- Table 76: Global Solar Battery Frame Volume K Forecast, by Types 2020 & 2033
- Table 77: Global Solar Battery Frame Revenue undefined Forecast, by Country 2020 & 2033
- Table 78: Global Solar Battery Frame Volume K Forecast, by Country 2020 & 2033
- Table 79: China Solar Battery Frame Revenue (undefined) Forecast, by Application 2020 & 2033
- Table 80: China Solar Battery Frame Volume (K) Forecast, by Application 2020 & 2033
- Table 81: India Solar Battery Frame Revenue (undefined) Forecast, by Application 2020 & 2033
- Table 82: India Solar Battery Frame Volume (K) Forecast, by Application 2020 & 2033
- Table 83: Japan Solar Battery Frame Revenue (undefined) Forecast, by Application 2020 & 2033
- Table 84: Japan Solar Battery Frame Volume (K) Forecast, by Application 2020 & 2033
- Table 85: South Korea Solar Battery Frame Revenue (undefined) Forecast, by Application 2020 & 2033
- Table 86: South Korea Solar Battery Frame Volume (K) Forecast, by Application 2020 & 2033
- Table 87: ASEAN Solar Battery Frame Revenue (undefined) Forecast, by Application 2020 & 2033
- Table 88: ASEAN Solar Battery Frame Volume (K) Forecast, by Application 2020 & 2033
- Table 89: Oceania Solar Battery Frame Revenue (undefined) Forecast, by Application 2020 & 2033
- Table 90: Oceania Solar Battery Frame Volume (K) Forecast, by Application 2020 & 2033
- Table 91: Rest of Asia Pacific Solar Battery Frame Revenue (undefined) Forecast, by Application 2020 & 2033
- Table 92: Rest of Asia Pacific Solar Battery Frame Volume (K) Forecast, by Application 2020 & 2033
Frequently Asked Questions
1. What is the projected Compound Annual Growth Rate (CAGR) of the Solar Battery Frame?
The projected CAGR is approximately 8%.
2. Which companies are prominent players in the Solar Battery Frame?
Key companies in the market include LG Chem, Nippon Light Metal, Howick, Zhangjiagang Sunrise Power, Accelor Precision Corporation, Wellste Aluminum, Fujian Fenan Aluminum, Chuangjia Aluminium, Donghua Aluminum, Sentong Photovoltaic, Akcome.
3. What are the main segments of the Solar Battery Frame?
The market segments include Application, Types.
4. Can you provide details about the market size?
The market size is estimated to be USD XXX N/A as of 2022.
5. What are some drivers contributing to market growth?
N/A
6. What are the notable trends driving market growth?
N/A
7. Are there any restraints impacting market growth?
N/A
8. Can you provide examples of recent developments in the market?
N/A
9. What pricing options are available for accessing the report?
Pricing options include single-user, multi-user, and enterprise licenses priced at USD 3950.00, USD 5925.00, and USD 7900.00 respectively.
10. Is the market size provided in terms of value or volume?
The market size is provided in terms of value, measured in N/A and volume, measured in K.
11. Are there any specific market keywords associated with the report?
Yes, the market keyword associated with the report is "Solar Battery Frame," which aids in identifying and referencing the specific market segment covered.
12. How do I determine which pricing option suits my needs best?
The pricing options vary based on user requirements and access needs. Individual users may opt for single-user licenses, while businesses requiring broader access may choose multi-user or enterprise licenses for cost-effective access to the report.
13. Are there any additional resources or data provided in the Solar Battery Frame report?
While the report offers comprehensive insights, it's advisable to review the specific contents or supplementary materials provided to ascertain if additional resources or data are available.
14. How can I stay updated on further developments or reports in the Solar Battery Frame?
To stay informed about further developments, trends, and reports in the Solar Battery Frame, consider subscribing to industry newsletters, following relevant companies and organizations, or regularly checking reputable industry news sources and publications.
Methodology
Step 1 - Identification of Relevant Samples Size from Population Database


Step 2 - Approaches for Defining Global Market Size (Value, Volume* & Price*)

Note*: In applicable scenarios
Step 3 - Data Sources
Primary Research
- Web Analytics
- Survey Reports
- Research Institute
- Latest Research Reports
- Opinion Leaders
Secondary Research
- Annual Reports
- White Paper
- Latest Press Release
- Industry Association
- Paid Database
- Investor Presentations

Step 4 - Data Triangulation
Involves using different sources of information in order to increase the validity of a study
These sources are likely to be stakeholders in a program - participants, other researchers, program staff, other community members, and so on.
Then we put all data in single framework & apply various statistical tools to find out the dynamic on the market.
During the analysis stage, feedback from the stakeholder groups would be compared to determine areas of agreement as well as areas of divergence