
Key Insights
The global smart water metering market is experiencing robust growth, driven by increasing urbanization, rising water scarcity concerns, and the need for efficient water resource management. A compound annual growth rate (CAGR) of 11.01% from 2019 to 2024 indicates a significant upward trajectory. This growth is fueled by several key factors. Firstly, the adoption of advanced metering infrastructure (AMI) and automatic meter reading (AMR) technologies is streamlining water billing processes, reducing non-revenue water (NRW) losses, and enhancing operational efficiency for water utilities. Secondly, the growing emphasis on water conservation and sustainability initiatives at both governmental and consumer levels is propelling demand for smart water meters. Residential, commercial, and industrial sectors are all contributing to market expansion, with the residential segment expected to maintain a considerable share owing to the increasing number of households globally. Furthermore, technological advancements, such as the integration of smart meters with IoT platforms and data analytics capabilities, are enhancing the value proposition for water utilities and consumers alike.
Despite these positive trends, challenges remain. High initial investment costs associated with smart meter deployment and integration can be a barrier for some water utilities, particularly in developing regions. The complexity of implementing and maintaining AMI systems also presents a hurdle. However, the long-term benefits of reduced NRW, improved billing accuracy, and enhanced water resource management are expected to outweigh these initial costs, leading to continued market expansion. The market is witnessing intense competition among established players like Itron, Badger Meter, and Honeywell, as well as emerging technology providers. Geographical variations in adoption rates are anticipated, with North America and Europe maintaining leading positions due to advanced infrastructure and higher awareness, while Asia Pacific is expected to witness substantial growth in the coming years driven by increasing urbanization and government support for smart city initiatives. The market's future is bright, promising a significant increase in the number of smart water meters deployed globally. We estimate the market size to have been approximately $8 billion in 2024, indicating substantial potential for future growth.

Smart Water Metering Market: A Comprehensive Report (2019-2033)
This comprehensive report provides a detailed analysis of the Smart Water Metering Market, encompassing market dynamics, growth trends, regional dominance, product landscape, and key players. The study period covers 2019-2033, with 2025 as the base and estimated year. The forecast period is 2025-2033, and the historical period is 2019-2024. This report is essential for industry professionals, investors, and strategists seeking to understand and capitalize on opportunities within this rapidly evolving market. The market size is projected to reach xx Million units by 2033.
Smart Water Metering Market Dynamics & Structure
The Smart Water Metering Market is characterized by a moderately concentrated landscape with several major players and numerous smaller niche competitors. Technological innovation, particularly in Advanced Metering Infrastructure (AMI) and data analytics, is a key driver. Stringent government regulations promoting water conservation and efficiency, coupled with increasing urbanization and the need for improved water management, are further accelerating market growth. The market faces competitive pressure from traditional mechanical meters, but the benefits of smart metering in terms of leak detection, reduced water loss, and improved billing accuracy are driving adoption. Mergers and acquisitions (M&A) activity within the sector has been moderate, with larger players consolidating their market share. Approximately xx M&A deals were recorded in the past five years, resulting in a xx% increase in market concentration.
- Market Concentration: Moderately concentrated, with top 5 players holding xx% market share (2024).
- Technological Innovation: AMI and IoT-enabled solutions are primary drivers.
- Regulatory Landscape: Favorable government policies supporting water efficiency are boosting adoption.
- Competitive Substitutes: Traditional mechanical meters pose a competitive challenge.
- End-User Demographics: Growth is driven by increasing urbanization and water scarcity concerns.
- M&A Trends: Moderate M&A activity, leading to consolidation amongst major players.
Smart Water Metering Market Growth Trends & Insights
The Smart Water Metering Market has exhibited robust growth over the past few years, driven by several key factors. The market size grew from xx Million units in 2019 to xx Million units in 2024, with a Compound Annual Growth Rate (CAGR) of xx%. This growth is projected to continue, with a forecasted CAGR of xx% during 2025-2033. Increased adoption of AMI systems, coupled with the rising demand for real-time data analytics for improved water management, is a major contributor to this growth. Furthermore, technological advancements such as the integration of IoT and AI are driving greater efficiency and providing new insights into water consumption patterns. Consumer behavior is also shifting towards a greater acceptance of smart technology and a willingness to pay for improved water management solutions. Market penetration for smart water meters is expected to reach xx% by 2033. This penetration is influenced by various factors including pricing, technological advancements and government incentives.

Dominant Regions, Countries, or Segments in Smart Water Metering Market
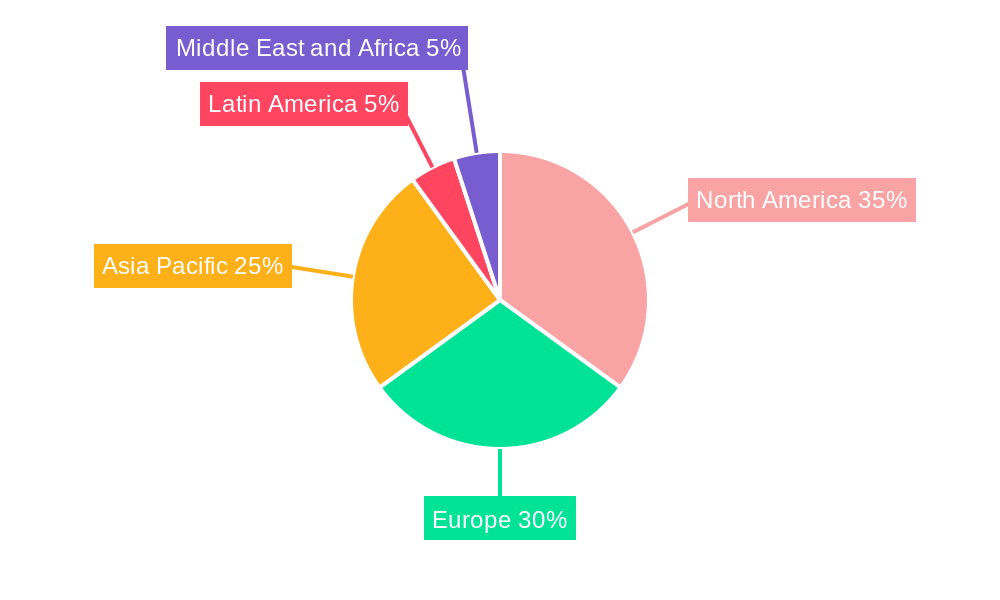
North America currently holds the largest market share in the smart water metering market, followed by Europe and Asia-Pacific. This dominance is attributed to early adoption of smart technologies, robust infrastructure, and supportive government policies. Within the segments, Advanced Metering Infrastructure (AMI) holds a larger market share compared to Automatic Meter Reading (AMR) due to its advanced features and data analytics capabilities. The residential segment shows the highest growth potential, driven by the increasing penetration of smart homes and rising awareness among consumers about water conservation.
- Key Drivers (North America): Robust infrastructure, early adoption of smart technologies, supportive regulations, and high consumer awareness.
- Key Drivers (Europe): Stringent water management policies, increasing water scarcity concerns, and focus on sustainable solutions.
- Key Drivers (Asia-Pacific): Rapid urbanization, rising disposable incomes, and increasing government investments in water infrastructure.
- By Technology: Advanced Metering Infrastructure (AMI) dominates due to enhanced data analytics and management capabilities.
- By Application: Residential sector shows highest growth potential due to increased smart home adoption and water conservation concerns.
Smart Water Metering Market Product Landscape
The smart water metering market offers a range of products with varying features and functionalities. These include AMI systems with advanced data analytics capabilities, AMR solutions for basic remote reading, and smart meters with integrated leak detection and pressure monitoring. Key features include improved accuracy, remote monitoring, and real-time data visualization. Product innovation focuses on enhanced communication technologies, improved security measures, and the integration of AI for predictive maintenance and water loss reduction. Unique selling propositions include cost savings through reduced water loss, enhanced operational efficiency, and improved customer engagement.
Key Drivers, Barriers & Challenges in Smart Water Metering Market
Key Drivers:
- Increasing water scarcity and the need for efficient water management.
- Growing demand for real-time data analytics to improve operational efficiency.
- Favorable government policies and incentives promoting smart water metering.
- Technological advancements, including the integration of IoT and AI, are improving the capabilities of smart water meters.
Key Challenges and Restraints:
- High initial investment costs associated with smart meter deployments can be a significant barrier for some municipalities.
- Data security and privacy concerns associated with the collection and storage of customer data may slow market penetration.
- Supply chain disruptions, especially the shortage of semiconductor components, can impact production volumes.
- Regulatory complexities and lack of standardization across different regions can create challenges for market expansion.
Emerging Opportunities in Smart Water Metering Market
- Untapped markets in developing countries with significant water management challenges present substantial growth potential.
- Innovative applications, such as integrating smart water meters with smart irrigation systems, offer new revenue streams.
- Growing demand for predictive maintenance and advanced analytics creates opportunities for software and service providers.
- Increasing consumer preference for smart home technologies will further drive the adoption of smart water meters.
Growth Accelerators in the Smart Water Metering Market Industry
Technological breakthroughs in communication technologies, such as NB-IoT and LoRaWAN, enable more efficient and cost-effective data transmission. Strategic partnerships between smart meter manufacturers, data analytics providers, and utilities facilitate comprehensive water management solutions. Market expansion strategies targeting underserved regions and promoting public-private partnerships are essential for driving long-term growth. These combined factors create a positive feedback loop encouraging wider adoption and fostering innovation within the sector.
Key Players Shaping the Smart Water Metering Market Market
- Integra Metering AG
- Itron Inc
- Badger Meter Inc
- Honeywell International Inc
- Maddalena SPA
- Mom Zrt
- Watertech S P A (Arad Group)
- Suntront tech Co Ltd
- Kamstrup A/S
- Apator SA
- Waviot
- Arad Group
- Diehl Stiftung & Co KG
- Sensus Usa Inc (Xylem Inc)
- BETAR Company
- Axioma Metering
- Landis+GYR Group AG
- G Gioanola Srl
- Zenner International Gmbh & Co KG
Notable Milestones in Smart Water Metering Market Sector
- September 2023: Honeywell announced the integration of quantum computing hardware encryption keys on smart utility meters to enhance data security.
- June 2023: Badger Meter partnered with the city of Savannah to implement 10,000 AMI water meters.
In-Depth Smart Water Metering Market Outlook
The future of the smart water metering market is bright, with continued growth driven by technological advancements, increasing urbanization, and a growing focus on water conservation. Strategic opportunities exist for companies that can offer innovative solutions, expand into new markets, and build strong partnerships within the industry. The market's long-term potential is significant, with the potential to transform water management practices globally.
Smart Water Metering Market Segmentation
-
1. Technology
- 1.1. Automatic Meter Reading
- 1.2. Advanced Metering Infrastructure
-
2. Application
- 2.1. Residential
- 2.2. Commercial
- 2.3. Industrial
Smart Water Metering Market Segmentation By Geography
- 1. North America
- 2. Europe
- 3. Asia
- 4. Australia and New Zealand
- 5. Latin America
- 6. Middle East and Africa
Smart Water Metering Market REPORT HIGHLIGHTS
| Aspects | Details |
|---|---|
| Study Period | 2019-2033 |
| Base Year | 2024 |
| Estimated Year | 2025 |
| Forecast Period | 2025-2033 |
| Historical Period | 2019-2024 |
| Growth Rate | CAGR of 11.01% from 2019-2033 |
| Segmentation |
|
Table of Contents
- 1. Introduction
- 1.1. Research Scope
- 1.2. Market Segmentation
- 1.3. Research Methodology
- 1.4. Definitions and Assumptions
- 2. Executive Summary
- 2.1. Introduction
- 3. Market Dynamics
- 3.1. Introduction
- 3.2. Market Drivers
- 3.2.1. Supportive Government Regulations; Need for Improvement in Water Utility Usage and Efficiency; Increasing Demand to Reduce Non-revenue Water Losses
- 3.3. Market Restrains
- 3.3.1. High Costs and Security Concerns; Integration Difficulties with Smart Meters; Utility Supplier Switching Costs
- 3.4. Market Trends
- 3.4.1. Residential Application Segment is Expected Hold Significant Market Share
- 4. Market Factor Analysis
- 4.1. Porters Five Forces
- 4.2. Supply/Value Chain
- 4.3. PESTEL analysis
- 4.4. Market Entropy
- 4.5. Patent/Trademark Analysis
- 5. Global Smart Water Metering Market Analysis, Insights and Forecast, 2019-2031
- 5.1. Market Analysis, Insights and Forecast - by Technology
- 5.1.1. Automatic Meter Reading
- 5.1.2. Advanced Metering Infrastructure
- 5.2. Market Analysis, Insights and Forecast - by Application
- 5.2.1. Residential
- 5.2.2. Commercial
- 5.2.3. Industrial
- 5.3. Market Analysis, Insights and Forecast - by Region
- 5.3.1. North America
- 5.3.2. Europe
- 5.3.3. Asia
- 5.3.4. Australia and New Zealand
- 5.3.5. Latin America
- 5.3.6. Middle East and Africa
- 5.1. Market Analysis, Insights and Forecast - by Technology
- 6. North America Smart Water Metering Market Analysis, Insights and Forecast, 2019-2031
- 6.1. Market Analysis, Insights and Forecast - by Technology
- 6.1.1. Automatic Meter Reading
- 6.1.2. Advanced Metering Infrastructure
- 6.2. Market Analysis, Insights and Forecast - by Application
- 6.2.1. Residential
- 6.2.2. Commercial
- 6.2.3. Industrial
- 6.1. Market Analysis, Insights and Forecast - by Technology
- 7. Europe Smart Water Metering Market Analysis, Insights and Forecast, 2019-2031
- 7.1. Market Analysis, Insights and Forecast - by Technology
- 7.1.1. Automatic Meter Reading
- 7.1.2. Advanced Metering Infrastructure
- 7.2. Market Analysis, Insights and Forecast - by Application
- 7.2.1. Residential
- 7.2.2. Commercial
- 7.2.3. Industrial
- 7.1. Market Analysis, Insights and Forecast - by Technology
- 8. Asia Smart Water Metering Market Analysis, Insights and Forecast, 2019-2031
- 8.1. Market Analysis, Insights and Forecast - by Technology
- 8.1.1. Automatic Meter Reading
- 8.1.2. Advanced Metering Infrastructure
- 8.2. Market Analysis, Insights and Forecast - by Application
- 8.2.1. Residential
- 8.2.2. Commercial
- 8.2.3. Industrial
- 8.1. Market Analysis, Insights and Forecast - by Technology
- 9. Australia and New Zealand Smart Water Metering Market Analysis, Insights and Forecast, 2019-2031
- 9.1. Market Analysis, Insights and Forecast - by Technology
- 9.1.1. Automatic Meter Reading
- 9.1.2. Advanced Metering Infrastructure
- 9.2. Market Analysis, Insights and Forecast - by Application
- 9.2.1. Residential
- 9.2.2. Commercial
- 9.2.3. Industrial
- 9.1. Market Analysis, Insights and Forecast - by Technology
- 10. Latin America Smart Water Metering Market Analysis, Insights and Forecast, 2019-2031
- 10.1. Market Analysis, Insights and Forecast - by Technology
- 10.1.1. Automatic Meter Reading
- 10.1.2. Advanced Metering Infrastructure
- 10.2. Market Analysis, Insights and Forecast - by Application
- 10.2.1. Residential
- 10.2.2. Commercial
- 10.2.3. Industrial
- 10.1. Market Analysis, Insights and Forecast - by Technology
- 11. Middle East and Africa Smart Water Metering Market Analysis, Insights and Forecast, 2019-2031
- 11.1. Market Analysis, Insights and Forecast - by Technology
- 11.1.1. Automatic Meter Reading
- 11.1.2. Advanced Metering Infrastructure
- 11.2. Market Analysis, Insights and Forecast - by Application
- 11.2.1. Residential
- 11.2.2. Commercial
- 11.2.3. Industrial
- 11.1. Market Analysis, Insights and Forecast - by Technology
- 12. North America Smart Water Metering Market Analysis, Insights and Forecast, 2019-2031
- 12.1. Market Analysis, Insights and Forecast - By Country/Sub-region
- 12.1.1.
- 13. Europe Smart Water Metering Market Analysis, Insights and Forecast, 2019-2031
- 13.1. Market Analysis, Insights and Forecast - By Country/Sub-region
- 13.1.1.
- 14. Asia Pacific Smart Water Metering Market Analysis, Insights and Forecast, 2019-2031
- 14.1. Market Analysis, Insights and Forecast - By Country/Sub-region
- 14.1.1.
- 15. Latin America Smart Water Metering Market Analysis, Insights and Forecast, 2019-2031
- 15.1. Market Analysis, Insights and Forecast - By Country/Sub-region
- 15.1.1.
- 16. Middle East and Africa Smart Water Metering Market Analysis, Insights and Forecast, 2019-2031
- 16.1. Market Analysis, Insights and Forecast - By Country/Sub-region
- 16.1.1.
- 17. Competitive Analysis
- 17.1. Global Market Share Analysis 2024
- 17.2. Company Profiles
- 17.2.1 Integra Metering AG
- 17.2.1.1. Overview
- 17.2.1.2. Products
- 17.2.1.3. SWOT Analysis
- 17.2.1.4. Recent Developments
- 17.2.1.5. Financials (Based on Availability)
- 17.2.2 Itron Inc
- 17.2.2.1. Overview
- 17.2.2.2. Products
- 17.2.2.3. SWOT Analysis
- 17.2.2.4. Recent Developments
- 17.2.2.5. Financials (Based on Availability)
- 17.2.3 Badger Meter Inc
- 17.2.3.1. Overview
- 17.2.3.2. Products
- 17.2.3.3. SWOT Analysis
- 17.2.3.4. Recent Developments
- 17.2.3.5. Financials (Based on Availability)
- 17.2.4 Honeywell International Inc
- 17.2.4.1. Overview
- 17.2.4.2. Products
- 17.2.4.3. SWOT Analysis
- 17.2.4.4. Recent Developments
- 17.2.4.5. Financials (Based on Availability)
- 17.2.5 Maddalena SPA
- 17.2.5.1. Overview
- 17.2.5.2. Products
- 17.2.5.3. SWOT Analysis
- 17.2.5.4. Recent Developments
- 17.2.5.5. Financials (Based on Availability)
- 17.2.6 Mom Zrt
- 17.2.6.1. Overview
- 17.2.6.2. Products
- 17.2.6.3. SWOT Analysis
- 17.2.6.4. Recent Developments
- 17.2.6.5. Financials (Based on Availability)
- 17.2.7 Watertech S P A (Arad Group)
- 17.2.7.1. Overview
- 17.2.7.2. Products
- 17.2.7.3. SWOT Analysis
- 17.2.7.4. Recent Developments
- 17.2.7.5. Financials (Based on Availability)
- 17.2.8 Suntront tech Co Ltd
- 17.2.8.1. Overview
- 17.2.8.2. Products
- 17.2.8.3. SWOT Analysis
- 17.2.8.4. Recent Developments
- 17.2.8.5. Financials (Based on Availability)
- 17.2.9 Kamstrup A/S
- 17.2.9.1. Overview
- 17.2.9.2. Products
- 17.2.9.3. SWOT Analysis
- 17.2.9.4. Recent Developments
- 17.2.9.5. Financials (Based on Availability)
- 17.2.10 Apator SA
- 17.2.10.1. Overview
- 17.2.10.2. Products
- 17.2.10.3. SWOT Analysis
- 17.2.10.4. Recent Developments
- 17.2.10.5. Financials (Based on Availability)
- 17.2.11 Waviot
- 17.2.11.1. Overview
- 17.2.11.2. Products
- 17.2.11.3. SWOT Analysis
- 17.2.11.4. Recent Developments
- 17.2.11.5. Financials (Based on Availability)
- 17.2.12 Arad Group
- 17.2.12.1. Overview
- 17.2.12.2. Products
- 17.2.12.3. SWOT Analysis
- 17.2.12.4. Recent Developments
- 17.2.12.5. Financials (Based on Availability)
- 17.2.13 Diehl Stiftung & Co KG
- 17.2.13.1. Overview
- 17.2.13.2. Products
- 17.2.13.3. SWOT Analysis
- 17.2.13.4. Recent Developments
- 17.2.13.5. Financials (Based on Availability)
- 17.2.14 Sensus Usa Inc (Xylem Inc )
- 17.2.14.1. Overview
- 17.2.14.2. Products
- 17.2.14.3. SWOT Analysis
- 17.2.14.4. Recent Developments
- 17.2.14.5. Financials (Based on Availability)
- 17.2.15 BETAR Company
- 17.2.15.1. Overview
- 17.2.15.2. Products
- 17.2.15.3. SWOT Analysis
- 17.2.15.4. Recent Developments
- 17.2.15.5. Financials (Based on Availability)
- 17.2.16 Axioma Metering
- 17.2.16.1. Overview
- 17.2.16.2. Products
- 17.2.16.3. SWOT Analysis
- 17.2.16.4. Recent Developments
- 17.2.16.5. Financials (Based on Availability)
- 17.2.17 Landis+GYR Group AG
- 17.2.17.1. Overview
- 17.2.17.2. Products
- 17.2.17.3. SWOT Analysis
- 17.2.17.4. Recent Developments
- 17.2.17.5. Financials (Based on Availability)
- 17.2.18 G Gioanola Srl
- 17.2.18.1. Overview
- 17.2.18.2. Products
- 17.2.18.3. SWOT Analysis
- 17.2.18.4. Recent Developments
- 17.2.18.5. Financials (Based on Availability)
- 17.2.19 Zenner International Gmbh & Co KG*List Not Exhaustive
- 17.2.19.1. Overview
- 17.2.19.2. Products
- 17.2.19.3. SWOT Analysis
- 17.2.19.4. Recent Developments
- 17.2.19.5. Financials (Based on Availability)
- 17.2.1 Integra Metering AG
List of Figures
- Figure 1: Global Smart Water Metering Market Revenue Breakdown (Million, %) by Region 2024 & 2032
- Figure 2: Global Smart Water Metering Market Volume Breakdown (Million, %) by Region 2024 & 2032
- Figure 3: North America Smart Water Metering Market Revenue (Million), by Country 2024 & 2032
- Figure 4: North America Smart Water Metering Market Volume (Million), by Country 2024 & 2032
- Figure 5: North America Smart Water Metering Market Revenue Share (%), by Country 2024 & 2032
- Figure 6: North America Smart Water Metering Market Volume Share (%), by Country 2024 & 2032
- Figure 7: Europe Smart Water Metering Market Revenue (Million), by Country 2024 & 2032
- Figure 8: Europe Smart Water Metering Market Volume (Million), by Country 2024 & 2032
- Figure 9: Europe Smart Water Metering Market Revenue Share (%), by Country 2024 & 2032
- Figure 10: Europe Smart Water Metering Market Volume Share (%), by Country 2024 & 2032
- Figure 11: Asia Pacific Smart Water Metering Market Revenue (Million), by Country 2024 & 2032
- Figure 12: Asia Pacific Smart Water Metering Market Volume (Million), by Country 2024 & 2032
- Figure 13: Asia Pacific Smart Water Metering Market Revenue Share (%), by Country 2024 & 2032
- Figure 14: Asia Pacific Smart Water Metering Market Volume Share (%), by Country 2024 & 2032
- Figure 15: Latin America Smart Water Metering Market Revenue (Million), by Country 2024 & 2032
- Figure 16: Latin America Smart Water Metering Market Volume (Million), by Country 2024 & 2032
- Figure 17: Latin America Smart Water Metering Market Revenue Share (%), by Country 2024 & 2032
- Figure 18: Latin America Smart Water Metering Market Volume Share (%), by Country 2024 & 2032
- Figure 19: Middle East and Africa Smart Water Metering Market Revenue (Million), by Country 2024 & 2032
- Figure 20: Middle East and Africa Smart Water Metering Market Volume (Million), by Country 2024 & 2032
- Figure 21: Middle East and Africa Smart Water Metering Market Revenue Share (%), by Country 2024 & 2032
- Figure 22: Middle East and Africa Smart Water Metering Market Volume Share (%), by Country 2024 & 2032
- Figure 23: North America Smart Water Metering Market Revenue (Million), by Technology 2024 & 2032
- Figure 24: North America Smart Water Metering Market Volume (Million), by Technology 2024 & 2032
- Figure 25: North America Smart Water Metering Market Revenue Share (%), by Technology 2024 & 2032
- Figure 26: North America Smart Water Metering Market Volume Share (%), by Technology 2024 & 2032
- Figure 27: North America Smart Water Metering Market Revenue (Million), by Application 2024 & 2032
- Figure 28: North America Smart Water Metering Market Volume (Million), by Application 2024 & 2032
- Figure 29: North America Smart Water Metering Market Revenue Share (%), by Application 2024 & 2032
- Figure 30: North America Smart Water Metering Market Volume Share (%), by Application 2024 & 2032
- Figure 31: North America Smart Water Metering Market Revenue (Million), by Country 2024 & 2032
- Figure 32: North America Smart Water Metering Market Volume (Million), by Country 2024 & 2032
- Figure 33: North America Smart Water Metering Market Revenue Share (%), by Country 2024 & 2032
- Figure 34: North America Smart Water Metering Market Volume Share (%), by Country 2024 & 2032
- Figure 35: Europe Smart Water Metering Market Revenue (Million), by Technology 2024 & 2032
- Figure 36: Europe Smart Water Metering Market Volume (Million), by Technology 2024 & 2032
- Figure 37: Europe Smart Water Metering Market Revenue Share (%), by Technology 2024 & 2032
- Figure 38: Europe Smart Water Metering Market Volume Share (%), by Technology 2024 & 2032
- Figure 39: Europe Smart Water Metering Market Revenue (Million), by Application 2024 & 2032
- Figure 40: Europe Smart Water Metering Market Volume (Million), by Application 2024 & 2032
- Figure 41: Europe Smart Water Metering Market Revenue Share (%), by Application 2024 & 2032
- Figure 42: Europe Smart Water Metering Market Volume Share (%), by Application 2024 & 2032
- Figure 43: Europe Smart Water Metering Market Revenue (Million), by Country 2024 & 2032
- Figure 44: Europe Smart Water Metering Market Volume (Million), by Country 2024 & 2032
- Figure 45: Europe Smart Water Metering Market Revenue Share (%), by Country 2024 & 2032
- Figure 46: Europe Smart Water Metering Market Volume Share (%), by Country 2024 & 2032
- Figure 47: Asia Smart Water Metering Market Revenue (Million), by Technology 2024 & 2032
- Figure 48: Asia Smart Water Metering Market Volume (Million), by Technology 2024 & 2032
- Figure 49: Asia Smart Water Metering Market Revenue Share (%), by Technology 2024 & 2032
- Figure 50: Asia Smart Water Metering Market Volume Share (%), by Technology 2024 & 2032
- Figure 51: Asia Smart Water Metering Market Revenue (Million), by Application 2024 & 2032
- Figure 52: Asia Smart Water Metering Market Volume (Million), by Application 2024 & 2032
- Figure 53: Asia Smart Water Metering Market Revenue Share (%), by Application 2024 & 2032
- Figure 54: Asia Smart Water Metering Market Volume Share (%), by Application 2024 & 2032
- Figure 55: Asia Smart Water Metering Market Revenue (Million), by Country 2024 & 2032
- Figure 56: Asia Smart Water Metering Market Volume (Million), by Country 2024 & 2032
- Figure 57: Asia Smart Water Metering Market Revenue Share (%), by Country 2024 & 2032
- Figure 58: Asia Smart Water Metering Market Volume Share (%), by Country 2024 & 2032
- Figure 59: Australia and New Zealand Smart Water Metering Market Revenue (Million), by Technology 2024 & 2032
- Figure 60: Australia and New Zealand Smart Water Metering Market Volume (Million), by Technology 2024 & 2032
- Figure 61: Australia and New Zealand Smart Water Metering Market Revenue Share (%), by Technology 2024 & 2032
- Figure 62: Australia and New Zealand Smart Water Metering Market Volume Share (%), by Technology 2024 & 2032
- Figure 63: Australia and New Zealand Smart Water Metering Market Revenue (Million), by Application 2024 & 2032
- Figure 64: Australia and New Zealand Smart Water Metering Market Volume (Million), by Application 2024 & 2032
- Figure 65: Australia and New Zealand Smart Water Metering Market Revenue Share (%), by Application 2024 & 2032
- Figure 66: Australia and New Zealand Smart Water Metering Market Volume Share (%), by Application 2024 & 2032
- Figure 67: Australia and New Zealand Smart Water Metering Market Revenue (Million), by Country 2024 & 2032
- Figure 68: Australia and New Zealand Smart Water Metering Market Volume (Million), by Country 2024 & 2032
- Figure 69: Australia and New Zealand Smart Water Metering Market Revenue Share (%), by Country 2024 & 2032
- Figure 70: Australia and New Zealand Smart Water Metering Market Volume Share (%), by Country 2024 & 2032
- Figure 71: Latin America Smart Water Metering Market Revenue (Million), by Technology 2024 & 2032
- Figure 72: Latin America Smart Water Metering Market Volume (Million), by Technology 2024 & 2032
- Figure 73: Latin America Smart Water Metering Market Revenue Share (%), by Technology 2024 & 2032
- Figure 74: Latin America Smart Water Metering Market Volume Share (%), by Technology 2024 & 2032
- Figure 75: Latin America Smart Water Metering Market Revenue (Million), by Application 2024 & 2032
- Figure 76: Latin America Smart Water Metering Market Volume (Million), by Application 2024 & 2032
- Figure 77: Latin America Smart Water Metering Market Revenue Share (%), by Application 2024 & 2032
- Figure 78: Latin America Smart Water Metering Market Volume Share (%), by Application 2024 & 2032
- Figure 79: Latin America Smart Water Metering Market Revenue (Million), by Country 2024 & 2032
- Figure 80: Latin America Smart Water Metering Market Volume (Million), by Country 2024 & 2032
- Figure 81: Latin America Smart Water Metering Market Revenue Share (%), by Country 2024 & 2032
- Figure 82: Latin America Smart Water Metering Market Volume Share (%), by Country 2024 & 2032
- Figure 83: Middle East and Africa Smart Water Metering Market Revenue (Million), by Technology 2024 & 2032
- Figure 84: Middle East and Africa Smart Water Metering Market Volume (Million), by Technology 2024 & 2032
- Figure 85: Middle East and Africa Smart Water Metering Market Revenue Share (%), by Technology 2024 & 2032
- Figure 86: Middle East and Africa Smart Water Metering Market Volume Share (%), by Technology 2024 & 2032
- Figure 87: Middle East and Africa Smart Water Metering Market Revenue (Million), by Application 2024 & 2032
- Figure 88: Middle East and Africa Smart Water Metering Market Volume (Million), by Application 2024 & 2032
- Figure 89: Middle East and Africa Smart Water Metering Market Revenue Share (%), by Application 2024 & 2032
- Figure 90: Middle East and Africa Smart Water Metering Market Volume Share (%), by Application 2024 & 2032
- Figure 91: Middle East and Africa Smart Water Metering Market Revenue (Million), by Country 2024 & 2032
- Figure 92: Middle East and Africa Smart Water Metering Market Volume (Million), by Country 2024 & 2032
- Figure 93: Middle East and Africa Smart Water Metering Market Revenue Share (%), by Country 2024 & 2032
- Figure 94: Middle East and Africa Smart Water Metering Market Volume Share (%), by Country 2024 & 2032
List of Tables
- Table 1: Global Smart Water Metering Market Revenue Million Forecast, by Region 2019 & 2032
- Table 2: Global Smart Water Metering Market Volume Million Forecast, by Region 2019 & 2032
- Table 3: Global Smart Water Metering Market Revenue Million Forecast, by Technology 2019 & 2032
- Table 4: Global Smart Water Metering Market Volume Million Forecast, by Technology 2019 & 2032
- Table 5: Global Smart Water Metering Market Revenue Million Forecast, by Application 2019 & 2032
- Table 6: Global Smart Water Metering Market Volume Million Forecast, by Application 2019 & 2032
- Table 7: Global Smart Water Metering Market Revenue Million Forecast, by Region 2019 & 2032
- Table 8: Global Smart Water Metering Market Volume Million Forecast, by Region 2019 & 2032
- Table 9: Global Smart Water Metering Market Revenue Million Forecast, by Country 2019 & 2032
- Table 10: Global Smart Water Metering Market Volume Million Forecast, by Country 2019 & 2032
- Table 11: Smart Water Metering Market Revenue (Million) Forecast, by Application 2019 & 2032
- Table 12: Smart Water Metering Market Volume (Million) Forecast, by Application 2019 & 2032
- Table 13: Global Smart Water Metering Market Revenue Million Forecast, by Country 2019 & 2032
- Table 14: Global Smart Water Metering Market Volume Million Forecast, by Country 2019 & 2032
- Table 15: Smart Water Metering Market Revenue (Million) Forecast, by Application 2019 & 2032
- Table 16: Smart Water Metering Market Volume (Million) Forecast, by Application 2019 & 2032
- Table 17: Global Smart Water Metering Market Revenue Million Forecast, by Country 2019 & 2032
- Table 18: Global Smart Water Metering Market Volume Million Forecast, by Country 2019 & 2032
- Table 19: Smart Water Metering Market Revenue (Million) Forecast, by Application 2019 & 2032
- Table 20: Smart Water Metering Market Volume (Million) Forecast, by Application 2019 & 2032
- Table 21: Global Smart Water Metering Market Revenue Million Forecast, by Country 2019 & 2032
- Table 22: Global Smart Water Metering Market Volume Million Forecast, by Country 2019 & 2032
- Table 23: Smart Water Metering Market Revenue (Million) Forecast, by Application 2019 & 2032
- Table 24: Smart Water Metering Market Volume (Million) Forecast, by Application 2019 & 2032
- Table 25: Global Smart Water Metering Market Revenue Million Forecast, by Country 2019 & 2032
- Table 26: Global Smart Water Metering Market Volume Million Forecast, by Country 2019 & 2032
- Table 27: Smart Water Metering Market Revenue (Million) Forecast, by Application 2019 & 2032
- Table 28: Smart Water Metering Market Volume (Million) Forecast, by Application 2019 & 2032
- Table 29: Global Smart Water Metering Market Revenue Million Forecast, by Technology 2019 & 2032
- Table 30: Global Smart Water Metering Market Volume Million Forecast, by Technology 2019 & 2032
- Table 31: Global Smart Water Metering Market Revenue Million Forecast, by Application 2019 & 2032
- Table 32: Global Smart Water Metering Market Volume Million Forecast, by Application 2019 & 2032
- Table 33: Global Smart Water Metering Market Revenue Million Forecast, by Country 2019 & 2032
- Table 34: Global Smart Water Metering Market Volume Million Forecast, by Country 2019 & 2032
- Table 35: Global Smart Water Metering Market Revenue Million Forecast, by Technology 2019 & 2032
- Table 36: Global Smart Water Metering Market Volume Million Forecast, by Technology 2019 & 2032
- Table 37: Global Smart Water Metering Market Revenue Million Forecast, by Application 2019 & 2032
- Table 38: Global Smart Water Metering Market Volume Million Forecast, by Application 2019 & 2032
- Table 39: Global Smart Water Metering Market Revenue Million Forecast, by Country 2019 & 2032
- Table 40: Global Smart Water Metering Market Volume Million Forecast, by Country 2019 & 2032
- Table 41: Global Smart Water Metering Market Revenue Million Forecast, by Technology 2019 & 2032
- Table 42: Global Smart Water Metering Market Volume Million Forecast, by Technology 2019 & 2032
- Table 43: Global Smart Water Metering Market Revenue Million Forecast, by Application 2019 & 2032
- Table 44: Global Smart Water Metering Market Volume Million Forecast, by Application 2019 & 2032
- Table 45: Global Smart Water Metering Market Revenue Million Forecast, by Country 2019 & 2032
- Table 46: Global Smart Water Metering Market Volume Million Forecast, by Country 2019 & 2032
- Table 47: Global Smart Water Metering Market Revenue Million Forecast, by Technology 2019 & 2032
- Table 48: Global Smart Water Metering Market Volume Million Forecast, by Technology 2019 & 2032
- Table 49: Global Smart Water Metering Market Revenue Million Forecast, by Application 2019 & 2032
- Table 50: Global Smart Water Metering Market Volume Million Forecast, by Application 2019 & 2032
- Table 51: Global Smart Water Metering Market Revenue Million Forecast, by Country 2019 & 2032
- Table 52: Global Smart Water Metering Market Volume Million Forecast, by Country 2019 & 2032
- Table 53: Global Smart Water Metering Market Revenue Million Forecast, by Technology 2019 & 2032
- Table 54: Global Smart Water Metering Market Volume Million Forecast, by Technology 2019 & 2032
- Table 55: Global Smart Water Metering Market Revenue Million Forecast, by Application 2019 & 2032
- Table 56: Global Smart Water Metering Market Volume Million Forecast, by Application 2019 & 2032
- Table 57: Global Smart Water Metering Market Revenue Million Forecast, by Country 2019 & 2032
- Table 58: Global Smart Water Metering Market Volume Million Forecast, by Country 2019 & 2032
- Table 59: Global Smart Water Metering Market Revenue Million Forecast, by Technology 2019 & 2032
- Table 60: Global Smart Water Metering Market Volume Million Forecast, by Technology 2019 & 2032
- Table 61: Global Smart Water Metering Market Revenue Million Forecast, by Application 2019 & 2032
- Table 62: Global Smart Water Metering Market Volume Million Forecast, by Application 2019 & 2032
- Table 63: Global Smart Water Metering Market Revenue Million Forecast, by Country 2019 & 2032
- Table 64: Global Smart Water Metering Market Volume Million Forecast, by Country 2019 & 2032
Frequently Asked Questions
1. What is the projected Compound Annual Growth Rate (CAGR) of the Smart Water Metering Market?
The projected CAGR is approximately 11.01%.
2. Which companies are prominent players in the Smart Water Metering Market?
Key companies in the market include Integra Metering AG, Itron Inc, Badger Meter Inc, Honeywell International Inc, Maddalena SPA, Mom Zrt, Watertech S P A (Arad Group), Suntront tech Co Ltd, Kamstrup A/S, Apator SA, Waviot, Arad Group, Diehl Stiftung & Co KG, Sensus Usa Inc (Xylem Inc ), BETAR Company, Axioma Metering, Landis+GYR Group AG, G Gioanola Srl, Zenner International Gmbh & Co KG*List Not Exhaustive.
3. What are the main segments of the Smart Water Metering Market?
The market segments include Technology, Application.
4. Can you provide details about the market size?
The market size is estimated to be USD XX Million as of 2022.
5. What are some drivers contributing to market growth?
Supportive Government Regulations; Need for Improvement in Water Utility Usage and Efficiency; Increasing Demand to Reduce Non-revenue Water Losses.
6. What are the notable trends driving market growth?
Residential Application Segment is Expected Hold Significant Market Share.
7. Are there any restraints impacting market growth?
High Costs and Security Concerns; Integration Difficulties with Smart Meters; Utility Supplier Switching Costs.
8. Can you provide examples of recent developments in the market?
September 2023 - Honeywell announced the integration of quantum computing hardware encryption Keys on smart utility meters to protect the end user's data from increasing cyber threats. To help strengthen reliability and trust in a digitalized energy sector, the company will use the Quantum Origin technology of Quantinuum. To ensure that natural gas, water, and electricity infrastructures are maintained for residential and commercial purposes, the enhanced security utility meter establishes a new benchmark that protects against data breaches.
9. What pricing options are available for accessing the report?
Pricing options include single-user, multi-user, and enterprise licenses priced at USD 4750, USD 5250, and USD 8750 respectively.
10. Is the market size provided in terms of value or volume?
The market size is provided in terms of value, measured in Million and volume, measured in Million.
11. Are there any specific market keywords associated with the report?
Yes, the market keyword associated with the report is "Smart Water Metering Market," which aids in identifying and referencing the specific market segment covered.
12. How do I determine which pricing option suits my needs best?
The pricing options vary based on user requirements and access needs. Individual users may opt for single-user licenses, while businesses requiring broader access may choose multi-user or enterprise licenses for cost-effective access to the report.
13. Are there any additional resources or data provided in the Smart Water Metering Market report?
While the report offers comprehensive insights, it's advisable to review the specific contents or supplementary materials provided to ascertain if additional resources or data are available.
14. How can I stay updated on further developments or reports in the Smart Water Metering Market?
To stay informed about further developments, trends, and reports in the Smart Water Metering Market, consider subscribing to industry newsletters, following relevant companies and organizations, or regularly checking reputable industry news sources and publications.
Methodology
Step 1 - Identification of Relevant Samples Size from Population Database


Step 2 - Approaches for Defining Global Market Size (Value, Volume* & Price*)

Note*: In applicable scenarios
Step 3 - Data Sources
Primary Research
- Web Analytics
- Survey Reports
- Research Institute
- Latest Research Reports
- Opinion Leaders
Secondary Research
- Annual Reports
- White Paper
- Latest Press Release
- Industry Association
- Paid Database
- Investor Presentations

Step 4 - Data Triangulation
Involves using different sources of information in order to increase the validity of a study
These sources are likely to be stakeholders in a program - participants, other researchers, program staff, other community members, and so on.
Then we put all data in single framework & apply various statistical tools to find out the dynamic on the market.
During the analysis stage, feedback from the stakeholder groups would be compared to determine areas of agreement as well as areas of divergence


