

Key Insights
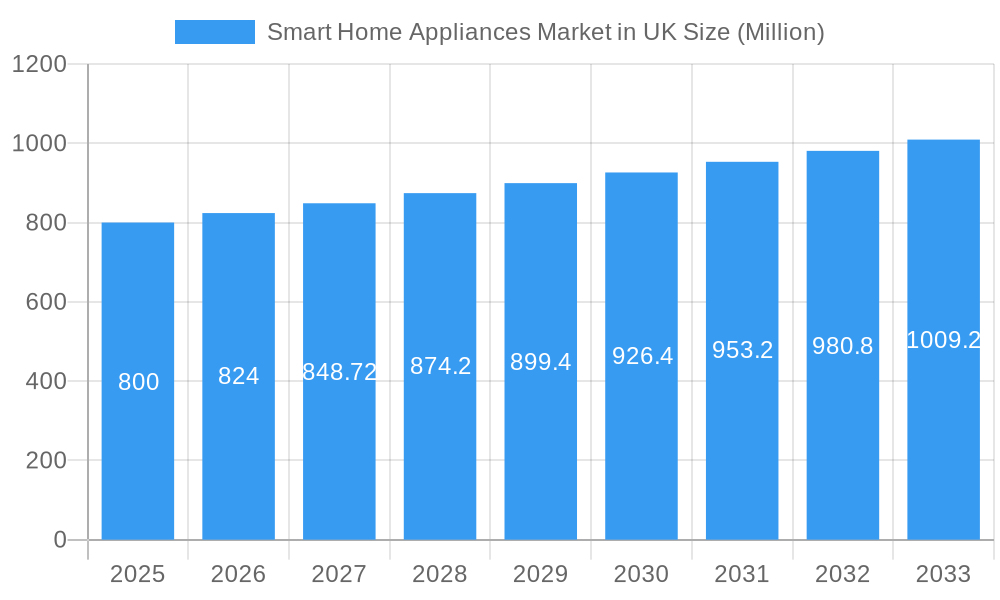
The UK smart home appliance market, featuring a range of products including vacuum cleaners, coffee machines, and food processors, is projected for sustained expansion. Based on an estimated 8.04% CAGR and a market size of 20.53 billion (in a specified timeframe, 2019-2033), the market value is anticipated to reach approximately £800 million by 2025. Key growth drivers include rising disposable incomes, increasing consumer demand for automation and convenience, and the widespread adoption of smart home technologies. The e-commerce channel significantly contributes to market growth by enhancing product accessibility and selection. However, market penetration is tempered by the higher initial investment for smart appliances and persistent concerns surrounding data privacy and security. The market is segmented by product type (vacuum cleaners, coffee machines, food processors, irons, toasters, grills & roasters, hair dryers, and others) and distribution channels (supermarkets & hypermarkets, specialty stores, e-commerce, and others). Leading brands such as Electrolux, Dyson, and Philips are actively engaged in innovation to enhance features and user experience. Future growth will be propelled by advancements like voice assistant integration and improved energy efficiency, aligning with the demand for sustainable and technologically sophisticated home appliances.
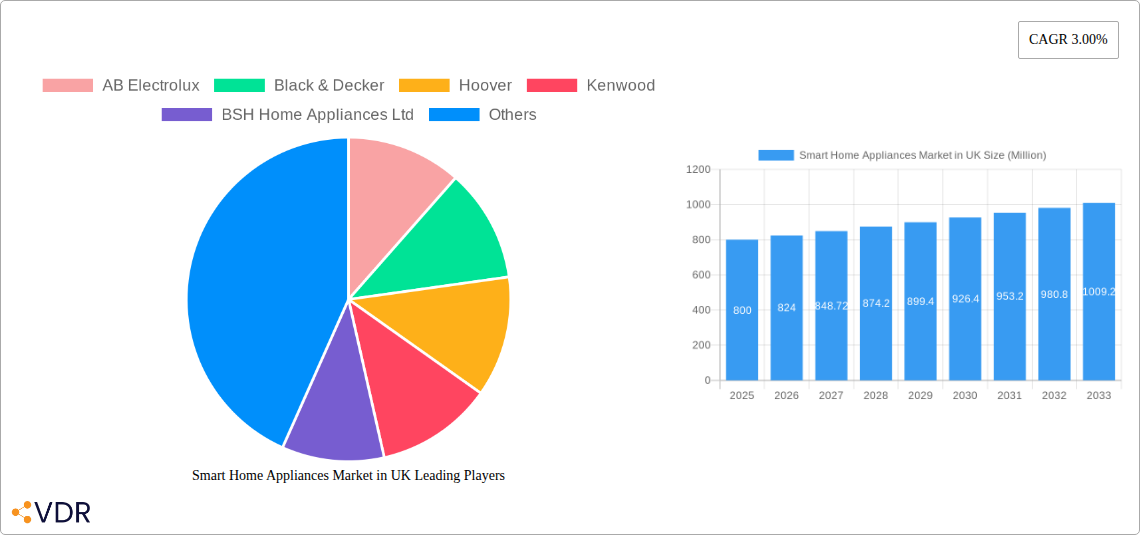
Smart Home Appliances Market in UK Market Size (In Billion)
The forecast period (2025-2033) indicates continued market growth, driven by technological innovations such as AI-powered cleaning functionalities and intuitive user interfaces. The increasing availability of high-speed internet across the UK further facilitates the connectivity essential for smart appliances. Potential market restraints include economic volatility impacting discretionary spending and competitive pressures from established brands emphasizing feature differentiation and value. Market segmentation analysis suggests that vacuum cleaners and coffee machines are likely to capture substantial market share due to robust demand and ongoing technological advancements in these categories. Growth patterns in the smart appliance market are expected to vary geographically within the UK, with urban centers exhibiting higher adoption rates.
Smart Home Appliances Market in UK Company Market Share
Smart Home Appliances Market in UK: A Comprehensive Report (2019-2033)
This in-depth report provides a comprehensive analysis of the Smart Home Appliances Market in the UK, covering market dynamics, growth trends, key players, and future outlook. The study period spans from 2019 to 2033, with a focus on the forecast period from 2025 to 2033. The base year for analysis is 2025. This report is essential for industry professionals, investors, and anyone seeking a thorough understanding of this rapidly evolving market. The report delves into both parent and child markets to offer a granular perspective. Market values are presented in Million units.
Smart Home Appliances Market in UK Market Dynamics & Structure
This section analyzes the UK smart home appliance market's competitive landscape, technological advancements, regulatory environment, and market trends. The report examines market concentration, identifying key players and their market share. It explores the impact of technological innovations, such as AI and IoT integration, on product development and consumer adoption. Regulatory frameworks influencing the market, including energy efficiency standards and data privacy regulations, are also discussed. Furthermore, the report assesses the competitive pressures from substitute products and analyzes the impact of mergers and acquisitions (M&A) activities on market consolidation. The analysis considers end-user demographics to understand market segmentation and demand drivers.
- Market Concentration: The UK smart home appliance market exhibits a moderately concentrated structure, with xx% market share held by the top 5 players.
- Technological Innovation: Significant advancements in AI, IoT, and connectivity are driving product innovation and feature enhancements.
- Regulatory Framework: Stringent energy efficiency regulations and data privacy laws are shaping product design and marketing strategies.
- M&A Activity: The number of M&A deals in the UK smart home appliance sector averaged xx per year during the historical period (2019-2024).
- Competitive Substitutes: Traditional appliances pose a significant competitive threat, particularly in price-sensitive segments.
Smart Home Appliances Market in UK Growth Trends & Insights
This section provides a detailed analysis of the UK smart home appliance market's growth trajectory, encompassing historical performance and future projections. It meticulously examines the market's evolution in terms of size from 2019 to 2024 and offers a comprehensive forecast extending to 2033. The report delves into adoption rates across a diverse spectrum of product categories, while critically assessing the influence of disruptive technological advancements and the dynamic shifts in consumer preferences on prevailing market trends. To quantify market performance and deliver profound growth insights, this analysis leverages key performance indicators such as the Compound Annual Growth Rate (CAGR) and market penetration. Furthermore, it offers specific details on significant consumer behaviour shifts, the increasing preference for integrated smart functionalities, and the impact of socio-economic factors, including rising disposable incomes and evolving lifestyle paradigms.
- Market Size (Million units): 2019: [Insert Value], 2024: [Insert Value], 2025 (Estimated): [Insert Value], 2033 (Forecast): [Insert Value]
- CAGR (2025-2033): [Insert Value]%
- Market Penetration: [Insert Value]% in 2024, projected to reach [Insert Value]% by 2033.
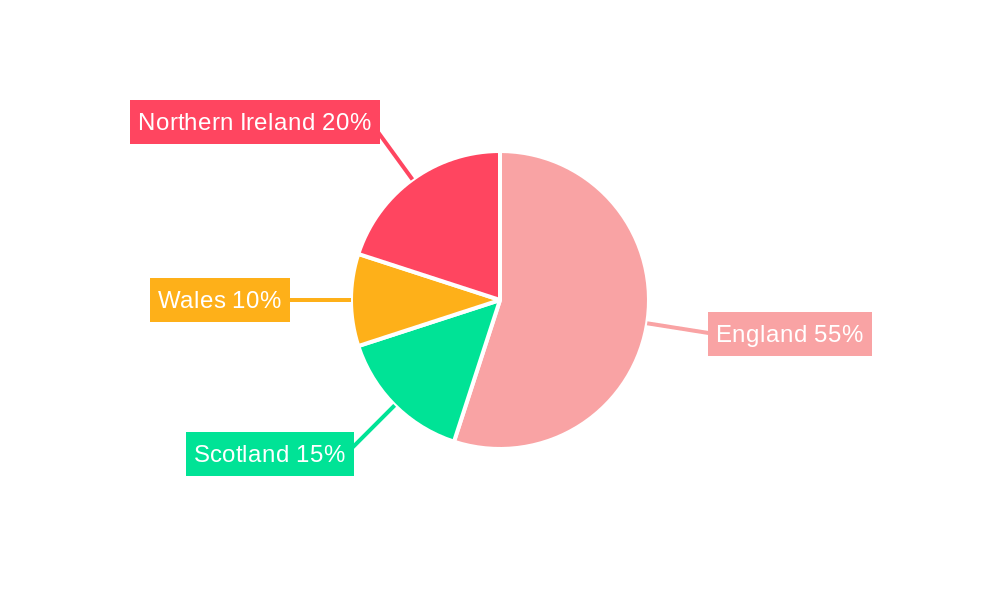
Dominant Regions, Countries, or Segments in Smart Home Appliances Market in UK
This section identifies the principal regions, countries, and product/distribution segments that are currently propelling market expansion within the United Kingdom. It provides an in-depth examination of regional disparities in adoption rates, the nuances of local consumer preferences, and the impact of distinct economic conditions. The analysis specifically highlights the factors contributing to the dominance of leading segments – categorized by product type (e.g., advanced vacuum cleaners, intelligent coffee machines) and by distribution channel (e.g., thriving e-commerce platforms, established supermarkets & hypermarkets) – in terms of their market share and future growth potential. Crucial growth drivers, such as supportive economic policies and the continuous development of digital infrastructure, are identified and analyzed to offer a holistic understanding of regional and segmental dynamics.
- Leading Segment (By Product): Vacuum Cleaners, commanding a significant market share of [Insert Value]% in 2024, propelled by an escalating consumer demand for enhanced convenience and superior hygiene standards in their homes.
- Leading Segment (By Distribution Channel): E-commerce stands out as the most rapidly expanding channel, capturing a substantial [Insert Value]% of the market share in 2024, a growth strongly influenced by pervasive online shopping trends and evolving consumer purchasing habits.
- Key Regional Drivers: Regions such as London and the South East are at the forefront of adoption, primarily due to their affluent populations characterized by high disposable incomes and a demonstrated receptiveness to technological innovations.
Smart Home Appliances Market in UK Product Landscape
This section provides a comprehensive overview of product innovation, diverse applications, and key performance metrics characterizing the smart home appliance market in the UK. The report spotlights the distinctive selling propositions (USPs) of leading products and elaborates on the technological advancements that are driving product differentiation and fostering enhanced user experiences. Significant emphasis is placed on the seamless integration of sophisticated smart features, versatile connectivity options, and quantifiable improvements in energy efficiency.
The UK market is dynamically characterized by an extensive array of smart appliances, distinguished by their advanced connectivity capabilities, superior energy efficiency, and intuitive user interfaces. Key technological breakthroughs, including sophisticated voice control integration and seamless app-based control, are identified as pivotal drivers of sustained market growth. Products such as intelligent vacuum cleaners equipped with advanced navigation and spatial mapping functionalities, and smart coffee machines offering highly personalized brewing experiences, are witnessing particularly strong consumer demand and market traction.
Key Drivers, Barriers & Challenges in Smart Home Appliances Market in UK
This section presents a detailed analysis of the forces propelling market expansion alongside the obstacles that present challenges to its growth. Primary growth drivers include continuous technological innovation, a consistent rise in consumer disposable incomes, and the implementation of supportive government policies aimed at promoting energy efficiency and smart technology adoption. Conversely, significant challenges encompass consumer concerns regarding data privacy and security, the substantial initial investment costs associated with smart appliances, and the competitive pressures exerted by both established market incumbents and agile new entrants.
Key Drivers:
- Technological Advancements: The rapid evolution and integration of Artificial Intelligence (AI), the Internet of Things (IoT), and enhanced wireless connectivity are fundamentally transforming the capabilities and appeal of smart home appliances.
- Rising Disposable Incomes: Increased household wealth is directly contributing to a greater consumer capacity and willingness to invest in premium, feature-rich smart home appliances, thus stimulating demand.
- Government Initiatives: Proactive government policies and incentives designed to encourage the adoption of energy-efficient appliances and promote the smart home sector are playing a crucial role in market development.
Key Challenges:
- Data Privacy and Security Concerns: Lingering anxieties among consumers about the security of their personal data and privacy are acting as a significant deterrent, potentially limiting widespread adoption among more cautious segments of the population.
- High Initial Investment Costs: The upfront cost associated with purchasing smart home appliances can be a substantial barrier, particularly for price-sensitive consumers, thereby restricting broader market accessibility.
- Intense Competition: The market is characterized by a highly competitive landscape, with both established manufacturers and innovative new companies vying for market share, necessitating continuous product development and competitive pricing strategies.
Emerging Opportunities in Smart Home Appliances Market in UK
This section illuminates the burgeoning trends and prospective opportunities within the UK smart home appliance market. Notable opportunities include the escalating popularity of intelligent kitchen appliances, a consistently growing demand for highly energy-efficient models driven by environmental consciousness, and the increasing adoption of integrated smart home ecosystems that enable seamless device interaction. The report also explores the significant growth potential in currently underserved market segments and the ongoing development of novel applications for existing smart appliance technologies.
- Growth in Smart Kitchen Appliances: A rapid expansion is being observed in the adoption of smart ovens, refrigerators, and dishwashers, reflecting a growing consumer interest in kitchen automation and enhanced functionality.
- Demand for Energy-Efficient Models: The increasing consumer awareness and concern for environmental sustainability are directly fueling a higher demand for smart appliances that offer superior energy efficiency and reduced ecological impact.
- Smart Home Ecosystem Integration: There is a discernible and growing demand for seamless interoperability and integration across a wide array of smart devices within a unified home ecosystem, enhancing convenience and user experience.
Growth Accelerators in the Smart Home Appliances Market in UK Industry
Technological breakthroughs, strategic partnerships, and market expansion strategies are key growth accelerators in the UK smart home appliance market. Continuous innovation, focused on improving functionality, energy efficiency, and user experience, is essential for market leadership. Strategic partnerships, including collaborations between appliance manufacturers and software developers, enhance product offerings and market reach. Expansion into new markets and product categories offers substantial growth potential.
Key Players Shaping the Smart Home Appliances Market in UK Market
- AB Electrolux
- Black & Decker
- Hoover
- Kenwood
- BSH Home Appliances Ltd
- Philips
- Murphy Richards
- Dyson
- Russell Hobbs
- Hotpoint
Notable Milestones in Smart Home Appliances Market in UK Sector
- March 2021: Samsung launched the Baker Series microwaves with steaming, grilling, and frying capabilities. This expansion into multi-functional kitchen appliances broadened product offerings and heightened consumer interest.
- February 2022: LG Electronics showcased its 2022 HVAC solutions at the AHR Expo, demonstrating advancements in energy efficiency and smart home integration within the broader home appliance ecosystem. This highlights the increasing convergence of smart technologies across different home appliance categories.
In-Depth Smart Home Appliances Market in UK Market Outlook
The UK smart home appliance market is poised for continued growth, driven by technological advancements, evolving consumer preferences, and supportive government policies. Opportunities exist in developing innovative products, expanding into underserved markets, and creating seamless integrations within smart home ecosystems. Strategic partnerships and investments in research and development will be crucial for companies seeking to capitalize on future market potential. The market's future hinges on addressing consumer concerns regarding data privacy and security while maintaining affordability and providing user-friendly experiences.
Smart Home Appliances Market in UK Segmentation
-
1. Product
- 1.1. Vacuum Cleaners
- 1.2. Coffee Machines
- 1.3. Food processor
- 1.4. Irons
- 1.5. Toasters
- 1.6. Grills & Roasters
- 1.7. Hair Dryers
- 1.8. Others
-
2. Distribution Channels
- 2.1. Supermarkets & Hypermarkets
- 2.2. Specialty Stores
- 2.3. E-Commerce
- 2.4. Others
Smart Home Appliances Market in UK Segmentation By Geography
-
1. North America
- 1.1. United States
- 1.2. Canada
- 1.3. Mexico
-
2. South America
- 2.1. Brazil
- 2.2. Argentina
- 2.3. Rest of South America
-
3. Europe
- 3.1. United Kingdom
- 3.2. Germany
- 3.3. France
- 3.4. Italy
- 3.5. Spain
- 3.6. Russia
- 3.7. Benelux
- 3.8. Nordics
- 3.9. Rest of Europe
-
4. Middle East & Africa
- 4.1. Turkey
- 4.2. Israel
- 4.3. GCC
- 4.4. North Africa
- 4.5. South Africa
- 4.6. Rest of Middle East & Africa
-
5. Asia Pacific
- 5.1. China
- 5.2. India
- 5.3. Japan
- 5.4. South Korea
- 5.5. ASEAN
- 5.6. Oceania
- 5.7. Rest of Asia Pacific
Smart Home Appliances Market in UK Regional Market Share
Geographic Coverage of Smart Home Appliances Market in UK
Smart Home Appliances Market in UK REPORT HIGHLIGHTS
| Aspects | Details |
|---|---|
| Study Period | 2020-2034 |
| Base Year | 2025 |
| Estimated Year | 2026 |
| Forecast Period | 2026-2034 |
| Historical Period | 2020-2025 |
| Growth Rate | CAGR of 8.04% from 2020-2034 |
| Segmentation |
|
Table of Contents
- 1. Introduction
- 1.1. Research Scope
- 1.2. Market Segmentation
- 1.3. Research Methodology
- 1.4. Definitions and Assumptions
- 2. Executive Summary
- 2.1. Introduction
- 3. Market Dynamics
- 3.1. Introduction
- 3.2. Market Drivers
- 3.2.1. Advancements in Materials or Designs that Enhance Durability Which Led to Increase the Drum Liner Market
- 3.3. Market Restrains
- 3.3.1. Higher Production Costs or Expensive Raw Materials can Limit Market Accessibility
- 3.4. Market Trends
- 3.4.1. Rising Urbanization Augmenting Demand for Small Appliances in United Kingdom
- 4. Market Factor Analysis
- 4.1. Porters Five Forces
- 4.2. Supply/Value Chain
- 4.3. PESTEL analysis
- 4.4. Market Entropy
- 4.5. Patent/Trademark Analysis
- 5. Global Smart Home Appliances Market in UK Analysis, Insights and Forecast, 2020-2032
- 5.1. Market Analysis, Insights and Forecast - by Product
- 5.1.1. Vacuum Cleaners
- 5.1.2. Coffee Machines
- 5.1.3. Food processor
- 5.1.4. Irons
- 5.1.5. Toasters
- 5.1.6. Grills & Roasters
- 5.1.7. Hair Dryers
- 5.1.8. Others
- 5.2. Market Analysis, Insights and Forecast - by Distribution Channels
- 5.2.1. Supermarkets & Hypermarkets
- 5.2.2. Specialty Stores
- 5.2.3. E-Commerce
- 5.2.4. Others
- 5.3. Market Analysis, Insights and Forecast - by Region
- 5.3.1. North America
- 5.3.2. South America
- 5.3.3. Europe
- 5.3.4. Middle East & Africa
- 5.3.5. Asia Pacific
- 5.1. Market Analysis, Insights and Forecast - by Product
- 6. North America Smart Home Appliances Market in UK Analysis, Insights and Forecast, 2020-2032
- 6.1. Market Analysis, Insights and Forecast - by Product
- 6.1.1. Vacuum Cleaners
- 6.1.2. Coffee Machines
- 6.1.3. Food processor
- 6.1.4. Irons
- 6.1.5. Toasters
- 6.1.6. Grills & Roasters
- 6.1.7. Hair Dryers
- 6.1.8. Others
- 6.2. Market Analysis, Insights and Forecast - by Distribution Channels
- 6.2.1. Supermarkets & Hypermarkets
- 6.2.2. Specialty Stores
- 6.2.3. E-Commerce
- 6.2.4. Others
- 6.1. Market Analysis, Insights and Forecast - by Product
- 7. South America Smart Home Appliances Market in UK Analysis, Insights and Forecast, 2020-2032
- 7.1. Market Analysis, Insights and Forecast - by Product
- 7.1.1. Vacuum Cleaners
- 7.1.2. Coffee Machines
- 7.1.3. Food processor
- 7.1.4. Irons
- 7.1.5. Toasters
- 7.1.6. Grills & Roasters
- 7.1.7. Hair Dryers
- 7.1.8. Others
- 7.2. Market Analysis, Insights and Forecast - by Distribution Channels
- 7.2.1. Supermarkets & Hypermarkets
- 7.2.2. Specialty Stores
- 7.2.3. E-Commerce
- 7.2.4. Others
- 7.1. Market Analysis, Insights and Forecast - by Product
- 8. Europe Smart Home Appliances Market in UK Analysis, Insights and Forecast, 2020-2032
- 8.1. Market Analysis, Insights and Forecast - by Product
- 8.1.1. Vacuum Cleaners
- 8.1.2. Coffee Machines
- 8.1.3. Food processor
- 8.1.4. Irons
- 8.1.5. Toasters
- 8.1.6. Grills & Roasters
- 8.1.7. Hair Dryers
- 8.1.8. Others
- 8.2. Market Analysis, Insights and Forecast - by Distribution Channels
- 8.2.1. Supermarkets & Hypermarkets
- 8.2.2. Specialty Stores
- 8.2.3. E-Commerce
- 8.2.4. Others
- 8.1. Market Analysis, Insights and Forecast - by Product
- 9. Middle East & Africa Smart Home Appliances Market in UK Analysis, Insights and Forecast, 2020-2032
- 9.1. Market Analysis, Insights and Forecast - by Product
- 9.1.1. Vacuum Cleaners
- 9.1.2. Coffee Machines
- 9.1.3. Food processor
- 9.1.4. Irons
- 9.1.5. Toasters
- 9.1.6. Grills & Roasters
- 9.1.7. Hair Dryers
- 9.1.8. Others
- 9.2. Market Analysis, Insights and Forecast - by Distribution Channels
- 9.2.1. Supermarkets & Hypermarkets
- 9.2.2. Specialty Stores
- 9.2.3. E-Commerce
- 9.2.4. Others
- 9.1. Market Analysis, Insights and Forecast - by Product
- 10. Asia Pacific Smart Home Appliances Market in UK Analysis, Insights and Forecast, 2020-2032
- 10.1. Market Analysis, Insights and Forecast - by Product
- 10.1.1. Vacuum Cleaners
- 10.1.2. Coffee Machines
- 10.1.3. Food processor
- 10.1.4. Irons
- 10.1.5. Toasters
- 10.1.6. Grills & Roasters
- 10.1.7. Hair Dryers
- 10.1.8. Others
- 10.2. Market Analysis, Insights and Forecast - by Distribution Channels
- 10.2.1. Supermarkets & Hypermarkets
- 10.2.2. Specialty Stores
- 10.2.3. E-Commerce
- 10.2.4. Others
- 10.1. Market Analysis, Insights and Forecast - by Product
- 11. Competitive Analysis
- 11.1. Global Market Share Analysis 2025
- 11.2. Company Profiles
- 11.2.1 AB Electrolux
- 11.2.1.1. Overview
- 11.2.1.2. Products
- 11.2.1.3. SWOT Analysis
- 11.2.1.4. Recent Developments
- 11.2.1.5. Financials (Based on Availability)
- 11.2.2 Black & Decker
- 11.2.2.1. Overview
- 11.2.2.2. Products
- 11.2.2.3. SWOT Analysis
- 11.2.2.4. Recent Developments
- 11.2.2.5. Financials (Based on Availability)
- 11.2.3 Hoover
- 11.2.3.1. Overview
- 11.2.3.2. Products
- 11.2.3.3. SWOT Analysis
- 11.2.3.4. Recent Developments
- 11.2.3.5. Financials (Based on Availability)
- 11.2.4 Kenwood
- 11.2.4.1. Overview
- 11.2.4.2. Products
- 11.2.4.3. SWOT Analysis
- 11.2.4.4. Recent Developments
- 11.2.4.5. Financials (Based on Availability)
- 11.2.5 BSH Home Appliances Ltd
- 11.2.5.1. Overview
- 11.2.5.2. Products
- 11.2.5.3. SWOT Analysis
- 11.2.5.4. Recent Developments
- 11.2.5.5. Financials (Based on Availability)
- 11.2.6 Philips
- 11.2.6.1. Overview
- 11.2.6.2. Products
- 11.2.6.3. SWOT Analysis
- 11.2.6.4. Recent Developments
- 11.2.6.5. Financials (Based on Availability)
- 11.2.7 Murphy Richards
- 11.2.7.1. Overview
- 11.2.7.2. Products
- 11.2.7.3. SWOT Analysis
- 11.2.7.4. Recent Developments
- 11.2.7.5. Financials (Based on Availability)
- 11.2.8 Dyson
- 11.2.8.1. Overview
- 11.2.8.2. Products
- 11.2.8.3. SWOT Analysis
- 11.2.8.4. Recent Developments
- 11.2.8.5. Financials (Based on Availability)
- 11.2.9 Russell Hobbs
- 11.2.9.1. Overview
- 11.2.9.2. Products
- 11.2.9.3. SWOT Analysis
- 11.2.9.4. Recent Developments
- 11.2.9.5. Financials (Based on Availability)
- 11.2.10 Hotpoint
- 11.2.10.1. Overview
- 11.2.10.2. Products
- 11.2.10.3. SWOT Analysis
- 11.2.10.4. Recent Developments
- 11.2.10.5. Financials (Based on Availability)
- 11.2.1 AB Electrolux
List of Figures
- Figure 1: Global Smart Home Appliances Market in UK Revenue Breakdown (billion, %) by Region 2025 & 2033
- Figure 2: Global Smart Home Appliances Market in UK Volume Breakdown (K Units, %) by Region 2025 & 2033
- Figure 3: North America Smart Home Appliances Market in UK Revenue (billion), by Product 2025 & 2033
- Figure 4: North America Smart Home Appliances Market in UK Volume (K Units), by Product 2025 & 2033
- Figure 5: North America Smart Home Appliances Market in UK Revenue Share (%), by Product 2025 & 2033
- Figure 6: North America Smart Home Appliances Market in UK Volume Share (%), by Product 2025 & 2033
- Figure 7: North America Smart Home Appliances Market in UK Revenue (billion), by Distribution Channels 2025 & 2033
- Figure 8: North America Smart Home Appliances Market in UK Volume (K Units), by Distribution Channels 2025 & 2033
- Figure 9: North America Smart Home Appliances Market in UK Revenue Share (%), by Distribution Channels 2025 & 2033
- Figure 10: North America Smart Home Appliances Market in UK Volume Share (%), by Distribution Channels 2025 & 2033
- Figure 11: North America Smart Home Appliances Market in UK Revenue (billion), by Country 2025 & 2033
- Figure 12: North America Smart Home Appliances Market in UK Volume (K Units), by Country 2025 & 2033
- Figure 13: North America Smart Home Appliances Market in UK Revenue Share (%), by Country 2025 & 2033
- Figure 14: North America Smart Home Appliances Market in UK Volume Share (%), by Country 2025 & 2033
- Figure 15: South America Smart Home Appliances Market in UK Revenue (billion), by Product 2025 & 2033
- Figure 16: South America Smart Home Appliances Market in UK Volume (K Units), by Product 2025 & 2033
- Figure 17: South America Smart Home Appliances Market in UK Revenue Share (%), by Product 2025 & 2033
- Figure 18: South America Smart Home Appliances Market in UK Volume Share (%), by Product 2025 & 2033
- Figure 19: South America Smart Home Appliances Market in UK Revenue (billion), by Distribution Channels 2025 & 2033
- Figure 20: South America Smart Home Appliances Market in UK Volume (K Units), by Distribution Channels 2025 & 2033
- Figure 21: South America Smart Home Appliances Market in UK Revenue Share (%), by Distribution Channels 2025 & 2033
- Figure 22: South America Smart Home Appliances Market in UK Volume Share (%), by Distribution Channels 2025 & 2033
- Figure 23: South America Smart Home Appliances Market in UK Revenue (billion), by Country 2025 & 2033
- Figure 24: South America Smart Home Appliances Market in UK Volume (K Units), by Country 2025 & 2033
- Figure 25: South America Smart Home Appliances Market in UK Revenue Share (%), by Country 2025 & 2033
- Figure 26: South America Smart Home Appliances Market in UK Volume Share (%), by Country 2025 & 2033
- Figure 27: Europe Smart Home Appliances Market in UK Revenue (billion), by Product 2025 & 2033
- Figure 28: Europe Smart Home Appliances Market in UK Volume (K Units), by Product 2025 & 2033
- Figure 29: Europe Smart Home Appliances Market in UK Revenue Share (%), by Product 2025 & 2033
- Figure 30: Europe Smart Home Appliances Market in UK Volume Share (%), by Product 2025 & 2033
- Figure 31: Europe Smart Home Appliances Market in UK Revenue (billion), by Distribution Channels 2025 & 2033
- Figure 32: Europe Smart Home Appliances Market in UK Volume (K Units), by Distribution Channels 2025 & 2033
- Figure 33: Europe Smart Home Appliances Market in UK Revenue Share (%), by Distribution Channels 2025 & 2033
- Figure 34: Europe Smart Home Appliances Market in UK Volume Share (%), by Distribution Channels 2025 & 2033
- Figure 35: Europe Smart Home Appliances Market in UK Revenue (billion), by Country 2025 & 2033
- Figure 36: Europe Smart Home Appliances Market in UK Volume (K Units), by Country 2025 & 2033
- Figure 37: Europe Smart Home Appliances Market in UK Revenue Share (%), by Country 2025 & 2033
- Figure 38: Europe Smart Home Appliances Market in UK Volume Share (%), by Country 2025 & 2033
- Figure 39: Middle East & Africa Smart Home Appliances Market in UK Revenue (billion), by Product 2025 & 2033
- Figure 40: Middle East & Africa Smart Home Appliances Market in UK Volume (K Units), by Product 2025 & 2033
- Figure 41: Middle East & Africa Smart Home Appliances Market in UK Revenue Share (%), by Product 2025 & 2033
- Figure 42: Middle East & Africa Smart Home Appliances Market in UK Volume Share (%), by Product 2025 & 2033
- Figure 43: Middle East & Africa Smart Home Appliances Market in UK Revenue (billion), by Distribution Channels 2025 & 2033
- Figure 44: Middle East & Africa Smart Home Appliances Market in UK Volume (K Units), by Distribution Channels 2025 & 2033
- Figure 45: Middle East & Africa Smart Home Appliances Market in UK Revenue Share (%), by Distribution Channels 2025 & 2033
- Figure 46: Middle East & Africa Smart Home Appliances Market in UK Volume Share (%), by Distribution Channels 2025 & 2033
- Figure 47: Middle East & Africa Smart Home Appliances Market in UK Revenue (billion), by Country 2025 & 2033
- Figure 48: Middle East & Africa Smart Home Appliances Market in UK Volume (K Units), by Country 2025 & 2033
- Figure 49: Middle East & Africa Smart Home Appliances Market in UK Revenue Share (%), by Country 2025 & 2033
- Figure 50: Middle East & Africa Smart Home Appliances Market in UK Volume Share (%), by Country 2025 & 2033
- Figure 51: Asia Pacific Smart Home Appliances Market in UK Revenue (billion), by Product 2025 & 2033
- Figure 52: Asia Pacific Smart Home Appliances Market in UK Volume (K Units), by Product 2025 & 2033
- Figure 53: Asia Pacific Smart Home Appliances Market in UK Revenue Share (%), by Product 2025 & 2033
- Figure 54: Asia Pacific Smart Home Appliances Market in UK Volume Share (%), by Product 2025 & 2033
- Figure 55: Asia Pacific Smart Home Appliances Market in UK Revenue (billion), by Distribution Channels 2025 & 2033
- Figure 56: Asia Pacific Smart Home Appliances Market in UK Volume (K Units), by Distribution Channels 2025 & 2033
- Figure 57: Asia Pacific Smart Home Appliances Market in UK Revenue Share (%), by Distribution Channels 2025 & 2033
- Figure 58: Asia Pacific Smart Home Appliances Market in UK Volume Share (%), by Distribution Channels 2025 & 2033
- Figure 59: Asia Pacific Smart Home Appliances Market in UK Revenue (billion), by Country 2025 & 2033
- Figure 60: Asia Pacific Smart Home Appliances Market in UK Volume (K Units), by Country 2025 & 2033
- Figure 61: Asia Pacific Smart Home Appliances Market in UK Revenue Share (%), by Country 2025 & 2033
- Figure 62: Asia Pacific Smart Home Appliances Market in UK Volume Share (%), by Country 2025 & 2033
List of Tables
- Table 1: Global Smart Home Appliances Market in UK Revenue billion Forecast, by Product 2020 & 2033
- Table 2: Global Smart Home Appliances Market in UK Volume K Units Forecast, by Product 2020 & 2033
- Table 3: Global Smart Home Appliances Market in UK Revenue billion Forecast, by Distribution Channels 2020 & 2033
- Table 4: Global Smart Home Appliances Market in UK Volume K Units Forecast, by Distribution Channels 2020 & 2033
- Table 5: Global Smart Home Appliances Market in UK Revenue billion Forecast, by Region 2020 & 2033
- Table 6: Global Smart Home Appliances Market in UK Volume K Units Forecast, by Region 2020 & 2033
- Table 7: Global Smart Home Appliances Market in UK Revenue billion Forecast, by Product 2020 & 2033
- Table 8: Global Smart Home Appliances Market in UK Volume K Units Forecast, by Product 2020 & 2033
- Table 9: Global Smart Home Appliances Market in UK Revenue billion Forecast, by Distribution Channels 2020 & 2033
- Table 10: Global Smart Home Appliances Market in UK Volume K Units Forecast, by Distribution Channels 2020 & 2033
- Table 11: Global Smart Home Appliances Market in UK Revenue billion Forecast, by Country 2020 & 2033
- Table 12: Global Smart Home Appliances Market in UK Volume K Units Forecast, by Country 2020 & 2033
- Table 13: United States Smart Home Appliances Market in UK Revenue (billion) Forecast, by Application 2020 & 2033
- Table 14: United States Smart Home Appliances Market in UK Volume (K Units) Forecast, by Application 2020 & 2033
- Table 15: Canada Smart Home Appliances Market in UK Revenue (billion) Forecast, by Application 2020 & 2033
- Table 16: Canada Smart Home Appliances Market in UK Volume (K Units) Forecast, by Application 2020 & 2033
- Table 17: Mexico Smart Home Appliances Market in UK Revenue (billion) Forecast, by Application 2020 & 2033
- Table 18: Mexico Smart Home Appliances Market in UK Volume (K Units) Forecast, by Application 2020 & 2033
- Table 19: Global Smart Home Appliances Market in UK Revenue billion Forecast, by Product 2020 & 2033
- Table 20: Global Smart Home Appliances Market in UK Volume K Units Forecast, by Product 2020 & 2033
- Table 21: Global Smart Home Appliances Market in UK Revenue billion Forecast, by Distribution Channels 2020 & 2033
- Table 22: Global Smart Home Appliances Market in UK Volume K Units Forecast, by Distribution Channels 2020 & 2033
- Table 23: Global Smart Home Appliances Market in UK Revenue billion Forecast, by Country 2020 & 2033
- Table 24: Global Smart Home Appliances Market in UK Volume K Units Forecast, by Country 2020 & 2033
- Table 25: Brazil Smart Home Appliances Market in UK Revenue (billion) Forecast, by Application 2020 & 2033
- Table 26: Brazil Smart Home Appliances Market in UK Volume (K Units) Forecast, by Application 2020 & 2033
- Table 27: Argentina Smart Home Appliances Market in UK Revenue (billion) Forecast, by Application 2020 & 2033
- Table 28: Argentina Smart Home Appliances Market in UK Volume (K Units) Forecast, by Application 2020 & 2033
- Table 29: Rest of South America Smart Home Appliances Market in UK Revenue (billion) Forecast, by Application 2020 & 2033
- Table 30: Rest of South America Smart Home Appliances Market in UK Volume (K Units) Forecast, by Application 2020 & 2033
- Table 31: Global Smart Home Appliances Market in UK Revenue billion Forecast, by Product 2020 & 2033
- Table 32: Global Smart Home Appliances Market in UK Volume K Units Forecast, by Product 2020 & 2033
- Table 33: Global Smart Home Appliances Market in UK Revenue billion Forecast, by Distribution Channels 2020 & 2033
- Table 34: Global Smart Home Appliances Market in UK Volume K Units Forecast, by Distribution Channels 2020 & 2033
- Table 35: Global Smart Home Appliances Market in UK Revenue billion Forecast, by Country 2020 & 2033
- Table 36: Global Smart Home Appliances Market in UK Volume K Units Forecast, by Country 2020 & 2033
- Table 37: United Kingdom Smart Home Appliances Market in UK Revenue (billion) Forecast, by Application 2020 & 2033
- Table 38: United Kingdom Smart Home Appliances Market in UK Volume (K Units) Forecast, by Application 2020 & 2033
- Table 39: Germany Smart Home Appliances Market in UK Revenue (billion) Forecast, by Application 2020 & 2033
- Table 40: Germany Smart Home Appliances Market in UK Volume (K Units) Forecast, by Application 2020 & 2033
- Table 41: France Smart Home Appliances Market in UK Revenue (billion) Forecast, by Application 2020 & 2033
- Table 42: France Smart Home Appliances Market in UK Volume (K Units) Forecast, by Application 2020 & 2033
- Table 43: Italy Smart Home Appliances Market in UK Revenue (billion) Forecast, by Application 2020 & 2033
- Table 44: Italy Smart Home Appliances Market in UK Volume (K Units) Forecast, by Application 2020 & 2033
- Table 45: Spain Smart Home Appliances Market in UK Revenue (billion) Forecast, by Application 2020 & 2033
- Table 46: Spain Smart Home Appliances Market in UK Volume (K Units) Forecast, by Application 2020 & 2033
- Table 47: Russia Smart Home Appliances Market in UK Revenue (billion) Forecast, by Application 2020 & 2033
- Table 48: Russia Smart Home Appliances Market in UK Volume (K Units) Forecast, by Application 2020 & 2033
- Table 49: Benelux Smart Home Appliances Market in UK Revenue (billion) Forecast, by Application 2020 & 2033
- Table 50: Benelux Smart Home Appliances Market in UK Volume (K Units) Forecast, by Application 2020 & 2033
- Table 51: Nordics Smart Home Appliances Market in UK Revenue (billion) Forecast, by Application 2020 & 2033
- Table 52: Nordics Smart Home Appliances Market in UK Volume (K Units) Forecast, by Application 2020 & 2033
- Table 53: Rest of Europe Smart Home Appliances Market in UK Revenue (billion) Forecast, by Application 2020 & 2033
- Table 54: Rest of Europe Smart Home Appliances Market in UK Volume (K Units) Forecast, by Application 2020 & 2033
- Table 55: Global Smart Home Appliances Market in UK Revenue billion Forecast, by Product 2020 & 2033
- Table 56: Global Smart Home Appliances Market in UK Volume K Units Forecast, by Product 2020 & 2033
- Table 57: Global Smart Home Appliances Market in UK Revenue billion Forecast, by Distribution Channels 2020 & 2033
- Table 58: Global Smart Home Appliances Market in UK Volume K Units Forecast, by Distribution Channels 2020 & 2033
- Table 59: Global Smart Home Appliances Market in UK Revenue billion Forecast, by Country 2020 & 2033
- Table 60: Global Smart Home Appliances Market in UK Volume K Units Forecast, by Country 2020 & 2033
- Table 61: Turkey Smart Home Appliances Market in UK Revenue (billion) Forecast, by Application 2020 & 2033
- Table 62: Turkey Smart Home Appliances Market in UK Volume (K Units) Forecast, by Application 2020 & 2033
- Table 63: Israel Smart Home Appliances Market in UK Revenue (billion) Forecast, by Application 2020 & 2033
- Table 64: Israel Smart Home Appliances Market in UK Volume (K Units) Forecast, by Application 2020 & 2033
- Table 65: GCC Smart Home Appliances Market in UK Revenue (billion) Forecast, by Application 2020 & 2033
- Table 66: GCC Smart Home Appliances Market in UK Volume (K Units) Forecast, by Application 2020 & 2033
- Table 67: North Africa Smart Home Appliances Market in UK Revenue (billion) Forecast, by Application 2020 & 2033
- Table 68: North Africa Smart Home Appliances Market in UK Volume (K Units) Forecast, by Application 2020 & 2033
- Table 69: South Africa Smart Home Appliances Market in UK Revenue (billion) Forecast, by Application 2020 & 2033
- Table 70: South Africa Smart Home Appliances Market in UK Volume (K Units) Forecast, by Application 2020 & 2033
- Table 71: Rest of Middle East & Africa Smart Home Appliances Market in UK Revenue (billion) Forecast, by Application 2020 & 2033
- Table 72: Rest of Middle East & Africa Smart Home Appliances Market in UK Volume (K Units) Forecast, by Application 2020 & 2033
- Table 73: Global Smart Home Appliances Market in UK Revenue billion Forecast, by Product 2020 & 2033
- Table 74: Global Smart Home Appliances Market in UK Volume K Units Forecast, by Product 2020 & 2033
- Table 75: Global Smart Home Appliances Market in UK Revenue billion Forecast, by Distribution Channels 2020 & 2033
- Table 76: Global Smart Home Appliances Market in UK Volume K Units Forecast, by Distribution Channels 2020 & 2033
- Table 77: Global Smart Home Appliances Market in UK Revenue billion Forecast, by Country 2020 & 2033
- Table 78: Global Smart Home Appliances Market in UK Volume K Units Forecast, by Country 2020 & 2033
- Table 79: China Smart Home Appliances Market in UK Revenue (billion) Forecast, by Application 2020 & 2033
- Table 80: China Smart Home Appliances Market in UK Volume (K Units) Forecast, by Application 2020 & 2033
- Table 81: India Smart Home Appliances Market in UK Revenue (billion) Forecast, by Application 2020 & 2033
- Table 82: India Smart Home Appliances Market in UK Volume (K Units) Forecast, by Application 2020 & 2033
- Table 83: Japan Smart Home Appliances Market in UK Revenue (billion) Forecast, by Application 2020 & 2033
- Table 84: Japan Smart Home Appliances Market in UK Volume (K Units) Forecast, by Application 2020 & 2033
- Table 85: South Korea Smart Home Appliances Market in UK Revenue (billion) Forecast, by Application 2020 & 2033
- Table 86: South Korea Smart Home Appliances Market in UK Volume (K Units) Forecast, by Application 2020 & 2033
- Table 87: ASEAN Smart Home Appliances Market in UK Revenue (billion) Forecast, by Application 2020 & 2033
- Table 88: ASEAN Smart Home Appliances Market in UK Volume (K Units) Forecast, by Application 2020 & 2033
- Table 89: Oceania Smart Home Appliances Market in UK Revenue (billion) Forecast, by Application 2020 & 2033
- Table 90: Oceania Smart Home Appliances Market in UK Volume (K Units) Forecast, by Application 2020 & 2033
- Table 91: Rest of Asia Pacific Smart Home Appliances Market in UK Revenue (billion) Forecast, by Application 2020 & 2033
- Table 92: Rest of Asia Pacific Smart Home Appliances Market in UK Volume (K Units) Forecast, by Application 2020 & 2033
Frequently Asked Questions
1. What is the projected Compound Annual Growth Rate (CAGR) of the Smart Home Appliances Market in UK?
The projected CAGR is approximately 8.04%.
2. Which companies are prominent players in the Smart Home Appliances Market in UK?
Key companies in the market include AB Electrolux, Black & Decker, Hoover, Kenwood, BSH Home Appliances Ltd, Philips, Murphy Richards, Dyson, Russell Hobbs, Hotpoint.
3. What are the main segments of the Smart Home Appliances Market in UK?
The market segments include Product, Distribution Channels.
4. Can you provide details about the market size?
The market size is estimated to be USD 20.53 billion as of 2022.
5. What are some drivers contributing to market growth?
Advancements in Materials or Designs that Enhance Durability Which Led to Increase the Drum Liner Market.
6. What are the notable trends driving market growth?
Rising Urbanization Augmenting Demand for Small Appliances in United Kingdom.
7. Are there any restraints impacting market growth?
Higher Production Costs or Expensive Raw Materials can Limit Market Accessibility.
8. Can you provide examples of recent developments in the market?
On Feb 2nd, 2022, LG Electronics (LG) showcased its robust 2022 lineup of commercial, light commercial, and residential HVAC solutions - including industry-leading Variable Refrigerant Flow (VRF) technology, latest energy-efficient heat pump systems, indoor air quality solutions, and flexible building automation and connectivity products - at the 2022 AHR Expo in Las Vegas.
9. What pricing options are available for accessing the report?
Pricing options include single-user, multi-user, and enterprise licenses priced at USD 3800, USD 4500, and USD 5800 respectively.
10. Is the market size provided in terms of value or volume?
The market size is provided in terms of value, measured in billion and volume, measured in K Units.
11. Are there any specific market keywords associated with the report?
Yes, the market keyword associated with the report is "Smart Home Appliances Market in UK," which aids in identifying and referencing the specific market segment covered.
12. How do I determine which pricing option suits my needs best?
The pricing options vary based on user requirements and access needs. Individual users may opt for single-user licenses, while businesses requiring broader access may choose multi-user or enterprise licenses for cost-effective access to the report.
13. Are there any additional resources or data provided in the Smart Home Appliances Market in UK report?
While the report offers comprehensive insights, it's advisable to review the specific contents or supplementary materials provided to ascertain if additional resources or data are available.
14. How can I stay updated on further developments or reports in the Smart Home Appliances Market in UK?
To stay informed about further developments, trends, and reports in the Smart Home Appliances Market in UK, consider subscribing to industry newsletters, following relevant companies and organizations, or regularly checking reputable industry news sources and publications.
Methodology
Step 1 - Identification of Relevant Samples Size from Population Database


Step 2 - Approaches for Defining Global Market Size (Value, Volume* & Price*)

Note*: In applicable scenarios
Step 3 - Data Sources
Primary Research
- Web Analytics
- Survey Reports
- Research Institute
- Latest Research Reports
- Opinion Leaders
Secondary Research
- Annual Reports
- White Paper
- Latest Press Release
- Industry Association
- Paid Database
- Investor Presentations

Step 4 - Data Triangulation
Involves using different sources of information in order to increase the validity of a study
These sources are likely to be stakeholders in a program - participants, other researchers, program staff, other community members, and so on.
Then we put all data in single framework & apply various statistical tools to find out the dynamic on the market.
During the analysis stage, feedback from the stakeholder groups would be compared to determine areas of agreement as well as areas of divergence