

Key Insights
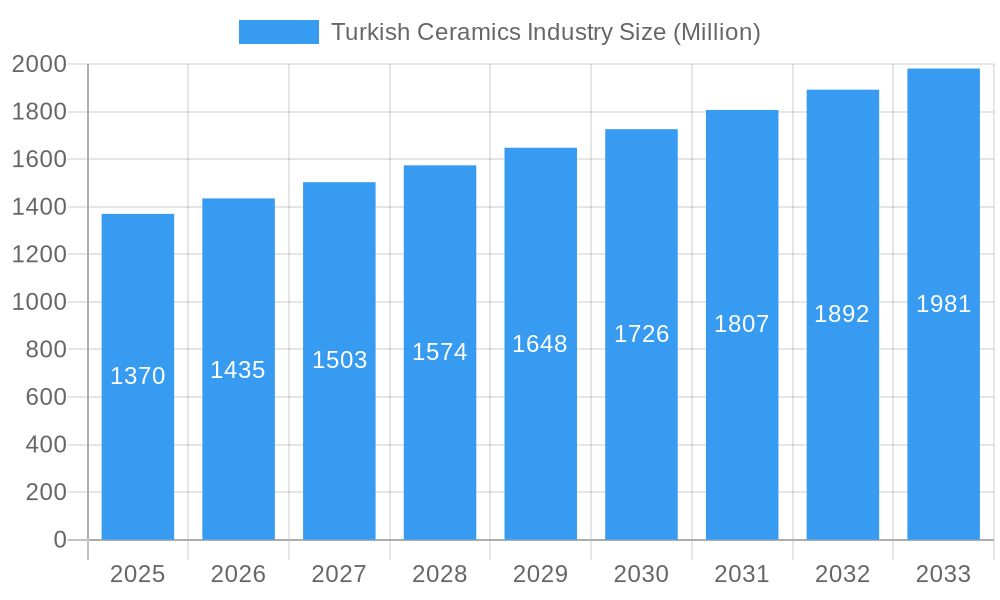
The Turkish ceramics industry, boasting a 2025 market size of $1.37 billion, exhibits a robust Compound Annual Growth Rate (CAGR) of 4.55% projected through 2033. This growth is fueled by several key drivers. Firstly, a surge in construction activity, particularly in new residential and commercial projects within Turkey and export markets, significantly boosts demand. Secondly, increasing preference for aesthetically pleasing and durable ceramic tiles, driven by rising disposable incomes and evolving interior design trends, fuels market expansion. The industry's diversification into specialized products like scratch-free tiles also contributes to this positive trajectory. However, fluctuations in raw material prices, global economic uncertainties, and intense competition from international players present challenges. Segmentation analysis reveals that the floor tiles application segment holds a dominant market share, followed by wall tiles, with the residential end-user sector contributing significantly to overall revenue. Leading players like Kale Group, VitrA, and others leverage their established brand reputation and technological advancements to maintain their market position. Regional expansion into high-growth markets like Asia-Pacific and Middle East & Africa is crucial for further industry growth. The ongoing focus on sustainable production methods and eco-friendly products is also shaping industry trends.
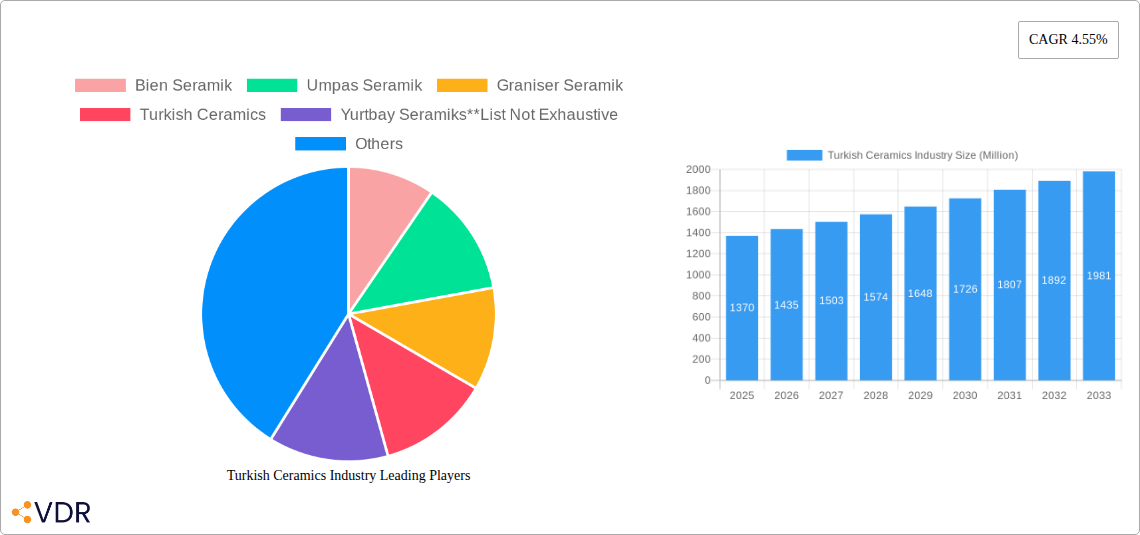
Turkish Ceramics Industry Market Size (In Billion)
The forecast indicates continued expansion of the Turkish ceramics market, propelled by sustained infrastructure development, especially in emerging economies. The industry's competitiveness rests on its ability to innovate, offering high-quality, specialized products at competitive prices. This involves enhancing production efficiency, adopting sustainable practices, and strategically targeting specific regional markets. Further market penetration will hinge on effective marketing strategies, building strong brand recognition, and adapting to evolving consumer preferences. Continued government support for the construction sector and investment in research and development will be pivotal in sustaining the industry's positive growth trajectory.
Turkish Ceramics Industry Company Market Share
Turkish Ceramics Industry: A Comprehensive Market Report (2019-2033)
This in-depth report provides a comprehensive analysis of the Turkish ceramics industry, encompassing market dynamics, growth trends, key players, and future outlook. The study period covers 2019-2033, with 2025 as the base and estimated year. This report is crucial for industry professionals, investors, and stakeholders seeking a detailed understanding of this dynamic sector. The report delves into parent markets (building and construction) and child markets (residential, commercial, etc.) for a complete perspective.
Keywords: Turkish Ceramics Industry, Ceramic Tiles Market Turkey, Turkish Tile Manufacturers, Floor Tiles Turkey, Wall Tiles Turkey, Porcelain Tiles Turkey, Construction Materials Turkey, Bien Seramik, Umpas Seramik, Graniser Seramik, Ege Seramik, Akgun Seramik, NG Kutahya Seramik, Seramiksan, Kale Group, VitrA, Market Size, Market Share, Growth Forecast, Industry Trends.
Turkish Ceramics Industry Market Dynamics & Structure
The Turkish ceramics industry, a significant contributor to the nation's construction sector, exhibits a moderately concentrated market structure. While a few large players like Kale Group and VitrA dominate, numerous smaller and medium-sized enterprises (SMEs) also contribute significantly. The market is driven by technological innovation, particularly in design, material science (e.g., scratch-free tiles), and manufacturing processes. Stringent regulatory frameworks concerning environmental compliance and product standards significantly influence operations. The industry faces competition from alternative flooring materials like wood and laminate, influencing market share dynamics. M&A activity has been moderate in recent years, with xx million USD worth of deals recorded between 2019-2024. End-user demographics are shifting towards higher demand for aesthetically pleasing and durable tiles, particularly in the residential segment.
- Market Concentration: Moderately concentrated, with top 5 players holding approximately xx% market share.
- Technological Innovation: Focus on energy efficiency in production, innovative designs, and durable materials (e.g., scratch-free tiles).
- Regulatory Framework: Stringent environmental regulations and product safety standards.
- Competitive Substitutes: Wood, laminate, vinyl, and other flooring materials.
- M&A Trends: Moderate activity, with xx million USD in deal volume between 2019 and 2024.
- End-User Demographics: Growing demand from the middle class and rising preference for high-quality tiles.
Turkish Ceramics Industry Growth Trends & Insights
The Turkish ceramics industry experienced a Compound Annual Growth Rate (CAGR) of xx% during 2019-2024. This growth is primarily attributed to robust infrastructure development, increasing construction activity, and rising disposable incomes. Market penetration remains high in urban areas but presents significant opportunities in rural regions. Technological advancements have led to the introduction of eco-friendly production methods and innovative designs, boosting consumer interest. Shifting consumer preferences towards larger format tiles and sophisticated designs fuel market growth. The market is expected to experience a CAGR of xx% during the forecast period (2025-2033), reaching a market size of xx million units by 2033. Disruptions from global economic fluctuations, however, present a potential challenge to consistent growth.
Dominant Regions, Countries, or Segments in Turkish Ceramics Industry
The Istanbul and Izmir regions are dominant in the Turkish ceramics industry, benefiting from established manufacturing clusters, skilled labor, and proximity to major construction projects. The residential segment accounts for the largest market share, driven by new construction and renovation activities. Floor tiles hold the largest share within the application segment, followed by wall tiles. Within product categories, porcelain tiles show the highest growth due to durability and aesthetic appeal.
- Key Drivers: Robust infrastructure development, significant investment in new construction, and a growing middle class.
- Dominant Segments: Residential (xx%), Floor tiles (xx%), Porcelain tiles (xx%).
- Regional Dominance: Istanbul and Izmir regions due to manufacturing clusters and proximity to markets.
Turkish Ceramics Industry Product Landscape
The Turkish ceramics industry offers a wide array of products, encompassing glazed, porcelain, and scratch-free tiles in various sizes, colors, and finishes. Continuous innovation in design and material science delivers products with enhanced durability, water resistance, and aesthetic appeal. Unique selling propositions include customized designs, eco-friendly manufacturing processes, and advanced surface technologies enhancing scratch resistance.
Key Drivers, Barriers & Challenges in Turkish Ceramics Industry
Key Drivers:
- Increasing construction activity spurred by government infrastructure projects.
- Growing disposable incomes fueling demand for higher-quality home improvements.
- Technological advancements leading to improved product quality and manufacturing efficiency.
Challenges and Restraints:
- Fluctuations in raw material prices (e.g., clay, natural gas) impacting profitability.
- Intense competition from both domestic and international players.
- Environmental regulations increasing operational costs and requiring technological adaptations. This adds approximately xx% to production costs.
Emerging Opportunities in Turkish Ceramics Industry
Emerging opportunities include expanding into export markets (especially in the Middle East and Europe), developing sustainable and eco-friendly tiles to cater to green building trends, and exploring new applications in commercial spaces (e.g., large format tiles for retail spaces). Furthermore, the increased adoption of e-commerce platforms presents potential for enhanced market reach.
Growth Accelerators in the Turkish Ceramics Industry
Strategic partnerships with international players to gain access to advanced technologies and markets will accelerate industry growth. Investing in research and development to create innovative products (e.g., smart tiles, self-cleaning tiles) and embracing sustainable practices will contribute to long-term success. Targeted marketing campaigns highlighting the aesthetic and functional benefits of Turkish ceramics will enhance market penetration.
Key Players Shaping the Turkish Ceramics Industry Market
- Bien Seramik
- Umpas Seramik
- Graniser Seramik
- Turkish Ceramics
- Yurtbay Seramiks
- Ege Seramik
- Akgun Seramik
- NG Kutahya Seramik
- Seramiksan
- Kale Group
- VitrA
Notable Milestones in Turkish Ceramics Industry Sector
- July 2023: VitrA launched a new tile collection inspired by nature, featuring integrated systems and a material library.
- August 2023: Kale Group introduced a new range of ceramic tiles in various colors and sizes (60x120 and 80x80).
In-Depth Turkish Ceramics Industry Market Outlook
The Turkish ceramics industry is poised for continued growth, driven by sustained infrastructure development, rising consumer demand, and technological advancements. Strategic investments in innovation, sustainable practices, and market expansion will be crucial for capturing significant market share in both domestic and international markets. The focus on high-quality, aesthetically appealing, and durable products will be key to navigating the competitive landscape and ensuring long-term success.
Turkish Ceramics Industry Segmentation
- 1. Production Analysis
- 2. Consumption Analysis
- 3. Import Market Analysis (Value & Volume)
- 4. Export Market Analysis (Value & Volume)
- 5. Price Trend Analysis
Turkish Ceramics Industry Segmentation By Geography
-
1. North America
- 1.1. United States
- 1.2. Canada
- 1.3. Mexico
-
2. South America
- 2.1. Brazil
- 2.2. Argentina
- 2.3. Rest of South America
-
3. Europe
- 3.1. United Kingdom
- 3.2. Germany
- 3.3. France
- 3.4. Italy
- 3.5. Spain
- 3.6. Russia
- 3.7. Benelux
- 3.8. Nordics
- 3.9. Rest of Europe
-
4. Middle East & Africa
- 4.1. Turkey
- 4.2. Israel
- 4.3. GCC
- 4.4. North Africa
- 4.5. South Africa
- 4.6. Rest of Middle East & Africa
-
5. Asia Pacific
- 5.1. China
- 5.2. India
- 5.3. Japan
- 5.4. South Korea
- 5.5. ASEAN
- 5.6. Oceania
- 5.7. Rest of Asia Pacific
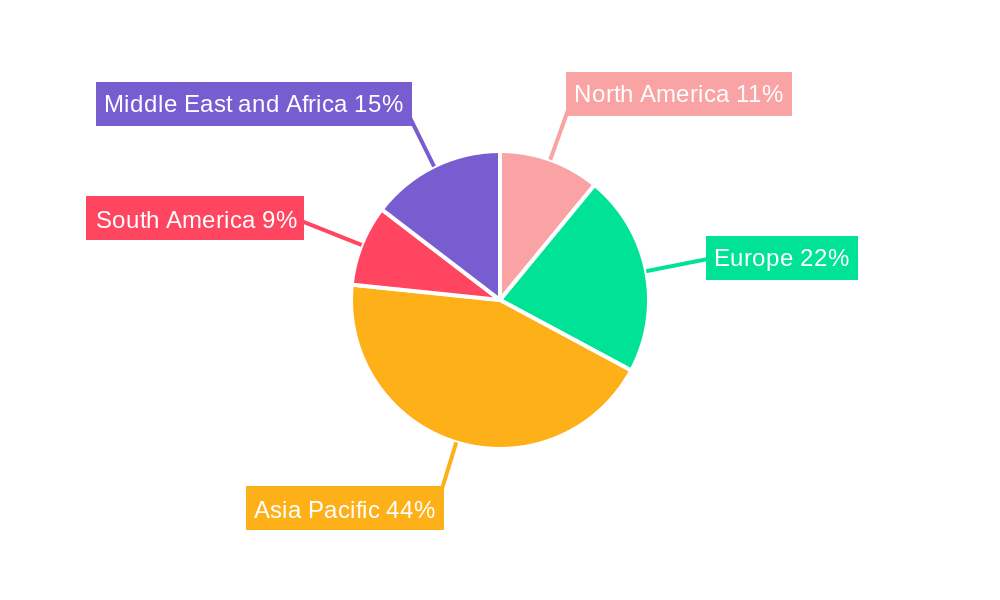
Turkish Ceramics Industry Regional Market Share
Geographic Coverage of Turkish Ceramics Industry
Turkish Ceramics Industry REPORT HIGHLIGHTS
| Aspects | Details |
|---|---|
| Study Period | 2020-2034 |
| Base Year | 2025 |
| Estimated Year | 2026 |
| Forecast Period | 2026-2034 |
| Historical Period | 2020-2025 |
| Growth Rate | CAGR of 4.55% from 2020-2034 |
| Segmentation |
|
Table of Contents
- 1. Introduction
- 1.1. Research Scope
- 1.2. Market Segmentation
- 1.3. Research Objective
- 1.4. Definitions and Assumptions
- 2. Executive Summary
- 2.1. Market Snapshot
- 3. Market Dynamics
- 3.1. Market Drivers
- 3.2. Market Restrains
- 3.3. Market Trends
- 3.4. Market Opportunities
- 4. Market Factor Analysis
- 4.1. Porters Five Forces
- 4.1.1. Bargaining Power of Suppliers
- 4.1.2. Bargaining Power of Buyers
- 4.1.3. Threat of New Entrants
- 4.1.4. Threat of Substitutes
- 4.1.5. Competitive Rivalry
- 4.2. PESTEL analysis
- 4.3. BCG Analysis
- 4.3.1. Stars (High Growth, High Market Share)
- 4.3.2. Cash Cows (Low Growth, High Market Share)
- 4.3.3. Question Mark (High Growth, Low Market Share)
- 4.3.4. Dogs (Low Growth, Low Market Share)
- 4.4. Ansoff Matrix Analysis
- 4.5. Supply Chain Analysis
- 4.6. Regulatory Landscape
- 4.7. Current Market Potential and Opportunity Assessment (TAM–SAM–SOM Framework)
- 4.8. VDR Analyst Note
- 4.1. Porters Five Forces
- 5. Market Analysis, Insights and Forecast 2021-2033
- 5.1. Market Analysis, Insights and Forecast - by Production Analysis
- 5.2. Market Analysis, Insights and Forecast - by Consumption Analysis
- 5.3. Market Analysis, Insights and Forecast - by Import Market Analysis (Value & Volume)
- 5.4. Market Analysis, Insights and Forecast - by Export Market Analysis (Value & Volume)
- 5.5. Market Analysis, Insights and Forecast - by Price Trend Analysis
- 5.6. Market Analysis, Insights and Forecast - by Region
- 5.6.1. North America
- 5.6.2. South America
- 5.6.3. Europe
- 5.6.4. Middle East & Africa
- 5.6.5. Asia Pacific
- 6. Global Turkish Ceramics Industry Analysis, Insights and Forecast, 2021-2033
- 6.1. Market Analysis, Insights and Forecast - by Production Analysis
- 6.2. Market Analysis, Insights and Forecast - by Consumption Analysis
- 6.3. Market Analysis, Insights and Forecast - by Import Market Analysis (Value & Volume)
- 6.4. Market Analysis, Insights and Forecast - by Export Market Analysis (Value & Volume)
- 6.5. Market Analysis, Insights and Forecast - by Price Trend Analysis
- 7. North America Turkish Ceramics Industry Analysis, Insights and Forecast, 2021-2033
- 7.1. Market Analysis, Insights and Forecast - by Production Analysis
- 7.2. Market Analysis, Insights and Forecast - by Consumption Analysis
- 7.3. Market Analysis, Insights and Forecast - by Import Market Analysis (Value & Volume)
- 7.4. Market Analysis, Insights and Forecast - by Export Market Analysis (Value & Volume)
- 7.5. Market Analysis, Insights and Forecast - by Price Trend Analysis
- 8. South America Turkish Ceramics Industry Analysis, Insights and Forecast, 2021-2033
- 8.1. Market Analysis, Insights and Forecast - by Production Analysis
- 8.2. Market Analysis, Insights and Forecast - by Consumption Analysis
- 8.3. Market Analysis, Insights and Forecast - by Import Market Analysis (Value & Volume)
- 8.4. Market Analysis, Insights and Forecast - by Export Market Analysis (Value & Volume)
- 8.5. Market Analysis, Insights and Forecast - by Price Trend Analysis
- 9. Europe Turkish Ceramics Industry Analysis, Insights and Forecast, 2021-2033
- 9.1. Market Analysis, Insights and Forecast - by Production Analysis
- 9.2. Market Analysis, Insights and Forecast - by Consumption Analysis
- 9.3. Market Analysis, Insights and Forecast - by Import Market Analysis (Value & Volume)
- 9.4. Market Analysis, Insights and Forecast - by Export Market Analysis (Value & Volume)
- 9.5. Market Analysis, Insights and Forecast - by Price Trend Analysis
- 10. Middle East & Africa Turkish Ceramics Industry Analysis, Insights and Forecast, 2021-2033
- 10.1. Market Analysis, Insights and Forecast - by Production Analysis
- 10.2. Market Analysis, Insights and Forecast - by Consumption Analysis
- 10.3. Market Analysis, Insights and Forecast - by Import Market Analysis (Value & Volume)
- 10.4. Market Analysis, Insights and Forecast - by Export Market Analysis (Value & Volume)
- 10.5. Market Analysis, Insights and Forecast - by Price Trend Analysis
- 11. Asia Pacific Turkish Ceramics Industry Analysis, Insights and Forecast, 2021-2033
- 11.1. Market Analysis, Insights and Forecast - by Production Analysis
- 11.2. Market Analysis, Insights and Forecast - by Consumption Analysis
- 11.3. Market Analysis, Insights and Forecast - by Import Market Analysis (Value & Volume)
- 11.4. Market Analysis, Insights and Forecast - by Export Market Analysis (Value & Volume)
- 11.5. Market Analysis, Insights and Forecast - by Price Trend Analysis
- 12. Competitive Analysis
- 12.1. Company Profiles
- 12.1.1 Bien Seramik
- 12.1.1.1. Company Overview
- 12.1.1.2. Products
- 12.1.1.3. Company Financials
- 12.1.1.4. SWOT Analysis
- 12.1.2 Umpas Seramik
- 12.1.2.1. Company Overview
- 12.1.2.2. Products
- 12.1.2.3. Company Financials
- 12.1.2.4. SWOT Analysis
- 12.1.3 Graniser Seramik
- 12.1.3.1. Company Overview
- 12.1.3.2. Products
- 12.1.3.3. Company Financials
- 12.1.3.4. SWOT Analysis
- 12.1.4 Turkish Ceramics
- 12.1.4.1. Company Overview
- 12.1.4.2. Products
- 12.1.4.3. Company Financials
- 12.1.4.4. SWOT Analysis
- 12.1.5 Yurtbay Seramiks**List Not Exhaustive
- 12.1.5.1. Company Overview
- 12.1.5.2. Products
- 12.1.5.3. Company Financials
- 12.1.5.4. SWOT Analysis
- 12.1.6 Ege Seramik
- 12.1.6.1. Company Overview
- 12.1.6.2. Products
- 12.1.6.3. Company Financials
- 12.1.6.4. SWOT Analysis
- 12.1.7 Akgun Seramik
- 12.1.7.1. Company Overview
- 12.1.7.2. Products
- 12.1.7.3. Company Financials
- 12.1.7.4. SWOT Analysis
- 12.1.8 NG Kutahya Seramik
- 12.1.8.1. Company Overview
- 12.1.8.2. Products
- 12.1.8.3. Company Financials
- 12.1.8.4. SWOT Analysis
- 12.1.9 Seramiksan
- 12.1.9.1. Company Overview
- 12.1.9.2. Products
- 12.1.9.3. Company Financials
- 12.1.9.4. SWOT Analysis
- 12.1.10 Kale Group
- 12.1.10.1. Company Overview
- 12.1.10.2. Products
- 12.1.10.3. Company Financials
- 12.1.10.4. SWOT Analysis
- 12.1.11 VitrA
- 12.1.11.1. Company Overview
- 12.1.11.2. Products
- 12.1.11.3. Company Financials
- 12.1.11.4. SWOT Analysis
- 12.1.1 Bien Seramik
- 12.2. Market Entropy
- 12.2.1 Company's Key Areas Served
- 12.2.2 Recent Developments
- 12.3. Company Market Share Analysis 2025
- 12.3.1 Top 5 Companies Market Share Analysis
- 12.3.2 Top 3 Companies Market Share Analysis
- 12.4. List of Potential Customers
- 13. Research Methodology
List of Figures
- Figure 1: Global Turkish Ceramics Industry Revenue Breakdown (Million, %) by Region 2025 & 2033
- Figure 2: North America Turkish Ceramics Industry Revenue (Million), by Production Analysis 2025 & 2033
- Figure 3: North America Turkish Ceramics Industry Revenue Share (%), by Production Analysis 2025 & 2033
- Figure 4: North America Turkish Ceramics Industry Revenue (Million), by Consumption Analysis 2025 & 2033
- Figure 5: North America Turkish Ceramics Industry Revenue Share (%), by Consumption Analysis 2025 & 2033
- Figure 6: North America Turkish Ceramics Industry Revenue (Million), by Import Market Analysis (Value & Volume) 2025 & 2033
- Figure 7: North America Turkish Ceramics Industry Revenue Share (%), by Import Market Analysis (Value & Volume) 2025 & 2033
- Figure 8: North America Turkish Ceramics Industry Revenue (Million), by Export Market Analysis (Value & Volume) 2025 & 2033
- Figure 9: North America Turkish Ceramics Industry Revenue Share (%), by Export Market Analysis (Value & Volume) 2025 & 2033
- Figure 10: North America Turkish Ceramics Industry Revenue (Million), by Price Trend Analysis 2025 & 2033
- Figure 11: North America Turkish Ceramics Industry Revenue Share (%), by Price Trend Analysis 2025 & 2033
- Figure 12: North America Turkish Ceramics Industry Revenue (Million), by Country 2025 & 2033
- Figure 13: North America Turkish Ceramics Industry Revenue Share (%), by Country 2025 & 2033
- Figure 14: South America Turkish Ceramics Industry Revenue (Million), by Production Analysis 2025 & 2033
- Figure 15: South America Turkish Ceramics Industry Revenue Share (%), by Production Analysis 2025 & 2033
- Figure 16: South America Turkish Ceramics Industry Revenue (Million), by Consumption Analysis 2025 & 2033
- Figure 17: South America Turkish Ceramics Industry Revenue Share (%), by Consumption Analysis 2025 & 2033
- Figure 18: South America Turkish Ceramics Industry Revenue (Million), by Import Market Analysis (Value & Volume) 2025 & 2033
- Figure 19: South America Turkish Ceramics Industry Revenue Share (%), by Import Market Analysis (Value & Volume) 2025 & 2033
- Figure 20: South America Turkish Ceramics Industry Revenue (Million), by Export Market Analysis (Value & Volume) 2025 & 2033
- Figure 21: South America Turkish Ceramics Industry Revenue Share (%), by Export Market Analysis (Value & Volume) 2025 & 2033
- Figure 22: South America Turkish Ceramics Industry Revenue (Million), by Price Trend Analysis 2025 & 2033
- Figure 23: South America Turkish Ceramics Industry Revenue Share (%), by Price Trend Analysis 2025 & 2033
- Figure 24: South America Turkish Ceramics Industry Revenue (Million), by Country 2025 & 2033
- Figure 25: South America Turkish Ceramics Industry Revenue Share (%), by Country 2025 & 2033
- Figure 26: Europe Turkish Ceramics Industry Revenue (Million), by Production Analysis 2025 & 2033
- Figure 27: Europe Turkish Ceramics Industry Revenue Share (%), by Production Analysis 2025 & 2033
- Figure 28: Europe Turkish Ceramics Industry Revenue (Million), by Consumption Analysis 2025 & 2033
- Figure 29: Europe Turkish Ceramics Industry Revenue Share (%), by Consumption Analysis 2025 & 2033
- Figure 30: Europe Turkish Ceramics Industry Revenue (Million), by Import Market Analysis (Value & Volume) 2025 & 2033
- Figure 31: Europe Turkish Ceramics Industry Revenue Share (%), by Import Market Analysis (Value & Volume) 2025 & 2033
- Figure 32: Europe Turkish Ceramics Industry Revenue (Million), by Export Market Analysis (Value & Volume) 2025 & 2033
- Figure 33: Europe Turkish Ceramics Industry Revenue Share (%), by Export Market Analysis (Value & Volume) 2025 & 2033
- Figure 34: Europe Turkish Ceramics Industry Revenue (Million), by Price Trend Analysis 2025 & 2033
- Figure 35: Europe Turkish Ceramics Industry Revenue Share (%), by Price Trend Analysis 2025 & 2033
- Figure 36: Europe Turkish Ceramics Industry Revenue (Million), by Country 2025 & 2033
- Figure 37: Europe Turkish Ceramics Industry Revenue Share (%), by Country 2025 & 2033
- Figure 38: Middle East & Africa Turkish Ceramics Industry Revenue (Million), by Production Analysis 2025 & 2033
- Figure 39: Middle East & Africa Turkish Ceramics Industry Revenue Share (%), by Production Analysis 2025 & 2033
- Figure 40: Middle East & Africa Turkish Ceramics Industry Revenue (Million), by Consumption Analysis 2025 & 2033
- Figure 41: Middle East & Africa Turkish Ceramics Industry Revenue Share (%), by Consumption Analysis 2025 & 2033
- Figure 42: Middle East & Africa Turkish Ceramics Industry Revenue (Million), by Import Market Analysis (Value & Volume) 2025 & 2033
- Figure 43: Middle East & Africa Turkish Ceramics Industry Revenue Share (%), by Import Market Analysis (Value & Volume) 2025 & 2033
- Figure 44: Middle East & Africa Turkish Ceramics Industry Revenue (Million), by Export Market Analysis (Value & Volume) 2025 & 2033
- Figure 45: Middle East & Africa Turkish Ceramics Industry Revenue Share (%), by Export Market Analysis (Value & Volume) 2025 & 2033
- Figure 46: Middle East & Africa Turkish Ceramics Industry Revenue (Million), by Price Trend Analysis 2025 & 2033
- Figure 47: Middle East & Africa Turkish Ceramics Industry Revenue Share (%), by Price Trend Analysis 2025 & 2033
- Figure 48: Middle East & Africa Turkish Ceramics Industry Revenue (Million), by Country 2025 & 2033
- Figure 49: Middle East & Africa Turkish Ceramics Industry Revenue Share (%), by Country 2025 & 2033
- Figure 50: Asia Pacific Turkish Ceramics Industry Revenue (Million), by Production Analysis 2025 & 2033
- Figure 51: Asia Pacific Turkish Ceramics Industry Revenue Share (%), by Production Analysis 2025 & 2033
- Figure 52: Asia Pacific Turkish Ceramics Industry Revenue (Million), by Consumption Analysis 2025 & 2033
- Figure 53: Asia Pacific Turkish Ceramics Industry Revenue Share (%), by Consumption Analysis 2025 & 2033
- Figure 54: Asia Pacific Turkish Ceramics Industry Revenue (Million), by Import Market Analysis (Value & Volume) 2025 & 2033
- Figure 55: Asia Pacific Turkish Ceramics Industry Revenue Share (%), by Import Market Analysis (Value & Volume) 2025 & 2033
- Figure 56: Asia Pacific Turkish Ceramics Industry Revenue (Million), by Export Market Analysis (Value & Volume) 2025 & 2033
- Figure 57: Asia Pacific Turkish Ceramics Industry Revenue Share (%), by Export Market Analysis (Value & Volume) 2025 & 2033
- Figure 58: Asia Pacific Turkish Ceramics Industry Revenue (Million), by Price Trend Analysis 2025 & 2033
- Figure 59: Asia Pacific Turkish Ceramics Industry Revenue Share (%), by Price Trend Analysis 2025 & 2033
- Figure 60: Asia Pacific Turkish Ceramics Industry Revenue (Million), by Country 2025 & 2033
- Figure 61: Asia Pacific Turkish Ceramics Industry Revenue Share (%), by Country 2025 & 2033
List of Tables
- Table 1: Global Turkish Ceramics Industry Revenue Million Forecast, by Production Analysis 2020 & 2033
- Table 2: Global Turkish Ceramics Industry Revenue Million Forecast, by Consumption Analysis 2020 & 2033
- Table 3: Global Turkish Ceramics Industry Revenue Million Forecast, by Import Market Analysis (Value & Volume) 2020 & 2033
- Table 4: Global Turkish Ceramics Industry Revenue Million Forecast, by Export Market Analysis (Value & Volume) 2020 & 2033
- Table 5: Global Turkish Ceramics Industry Revenue Million Forecast, by Price Trend Analysis 2020 & 2033
- Table 6: Global Turkish Ceramics Industry Revenue Million Forecast, by Region 2020 & 2033
- Table 7: Global Turkish Ceramics Industry Revenue Million Forecast, by Production Analysis 2020 & 2033
- Table 8: Global Turkish Ceramics Industry Revenue Million Forecast, by Consumption Analysis 2020 & 2033
- Table 9: Global Turkish Ceramics Industry Revenue Million Forecast, by Import Market Analysis (Value & Volume) 2020 & 2033
- Table 10: Global Turkish Ceramics Industry Revenue Million Forecast, by Export Market Analysis (Value & Volume) 2020 & 2033
- Table 11: Global Turkish Ceramics Industry Revenue Million Forecast, by Price Trend Analysis 2020 & 2033
- Table 12: Global Turkish Ceramics Industry Revenue Million Forecast, by Country 2020 & 2033
- Table 13: United States Turkish Ceramics Industry Revenue (Million) Forecast, by Application 2020 & 2033
- Table 14: Canada Turkish Ceramics Industry Revenue (Million) Forecast, by Application 2020 & 2033
- Table 15: Mexico Turkish Ceramics Industry Revenue (Million) Forecast, by Application 2020 & 2033
- Table 16: Global Turkish Ceramics Industry Revenue Million Forecast, by Production Analysis 2020 & 2033
- Table 17: Global Turkish Ceramics Industry Revenue Million Forecast, by Consumption Analysis 2020 & 2033
- Table 18: Global Turkish Ceramics Industry Revenue Million Forecast, by Import Market Analysis (Value & Volume) 2020 & 2033
- Table 19: Global Turkish Ceramics Industry Revenue Million Forecast, by Export Market Analysis (Value & Volume) 2020 & 2033
- Table 20: Global Turkish Ceramics Industry Revenue Million Forecast, by Price Trend Analysis 2020 & 2033
- Table 21: Global Turkish Ceramics Industry Revenue Million Forecast, by Country 2020 & 2033
- Table 22: Brazil Turkish Ceramics Industry Revenue (Million) Forecast, by Application 2020 & 2033
- Table 23: Argentina Turkish Ceramics Industry Revenue (Million) Forecast, by Application 2020 & 2033
- Table 24: Rest of South America Turkish Ceramics Industry Revenue (Million) Forecast, by Application 2020 & 2033
- Table 25: Global Turkish Ceramics Industry Revenue Million Forecast, by Production Analysis 2020 & 2033
- Table 26: Global Turkish Ceramics Industry Revenue Million Forecast, by Consumption Analysis 2020 & 2033
- Table 27: Global Turkish Ceramics Industry Revenue Million Forecast, by Import Market Analysis (Value & Volume) 2020 & 2033
- Table 28: Global Turkish Ceramics Industry Revenue Million Forecast, by Export Market Analysis (Value & Volume) 2020 & 2033
- Table 29: Global Turkish Ceramics Industry Revenue Million Forecast, by Price Trend Analysis 2020 & 2033
- Table 30: Global Turkish Ceramics Industry Revenue Million Forecast, by Country 2020 & 2033
- Table 31: United Kingdom Turkish Ceramics Industry Revenue (Million) Forecast, by Application 2020 & 2033
- Table 32: Germany Turkish Ceramics Industry Revenue (Million) Forecast, by Application 2020 & 2033
- Table 33: France Turkish Ceramics Industry Revenue (Million) Forecast, by Application 2020 & 2033
- Table 34: Italy Turkish Ceramics Industry Revenue (Million) Forecast, by Application 2020 & 2033
- Table 35: Spain Turkish Ceramics Industry Revenue (Million) Forecast, by Application 2020 & 2033
- Table 36: Russia Turkish Ceramics Industry Revenue (Million) Forecast, by Application 2020 & 2033
- Table 37: Benelux Turkish Ceramics Industry Revenue (Million) Forecast, by Application 2020 & 2033
- Table 38: Nordics Turkish Ceramics Industry Revenue (Million) Forecast, by Application 2020 & 2033
- Table 39: Rest of Europe Turkish Ceramics Industry Revenue (Million) Forecast, by Application 2020 & 2033
- Table 40: Global Turkish Ceramics Industry Revenue Million Forecast, by Production Analysis 2020 & 2033
- Table 41: Global Turkish Ceramics Industry Revenue Million Forecast, by Consumption Analysis 2020 & 2033
- Table 42: Global Turkish Ceramics Industry Revenue Million Forecast, by Import Market Analysis (Value & Volume) 2020 & 2033
- Table 43: Global Turkish Ceramics Industry Revenue Million Forecast, by Export Market Analysis (Value & Volume) 2020 & 2033
- Table 44: Global Turkish Ceramics Industry Revenue Million Forecast, by Price Trend Analysis 2020 & 2033
- Table 45: Global Turkish Ceramics Industry Revenue Million Forecast, by Country 2020 & 2033
- Table 46: Turkey Turkish Ceramics Industry Revenue (Million) Forecast, by Application 2020 & 2033
- Table 47: Israel Turkish Ceramics Industry Revenue (Million) Forecast, by Application 2020 & 2033
- Table 48: GCC Turkish Ceramics Industry Revenue (Million) Forecast, by Application 2020 & 2033
- Table 49: North Africa Turkish Ceramics Industry Revenue (Million) Forecast, by Application 2020 & 2033
- Table 50: South Africa Turkish Ceramics Industry Revenue (Million) Forecast, by Application 2020 & 2033
- Table 51: Rest of Middle East & Africa Turkish Ceramics Industry Revenue (Million) Forecast, by Application 2020 & 2033
- Table 52: Global Turkish Ceramics Industry Revenue Million Forecast, by Production Analysis 2020 & 2033
- Table 53: Global Turkish Ceramics Industry Revenue Million Forecast, by Consumption Analysis 2020 & 2033
- Table 54: Global Turkish Ceramics Industry Revenue Million Forecast, by Import Market Analysis (Value & Volume) 2020 & 2033
- Table 55: Global Turkish Ceramics Industry Revenue Million Forecast, by Export Market Analysis (Value & Volume) 2020 & 2033
- Table 56: Global Turkish Ceramics Industry Revenue Million Forecast, by Price Trend Analysis 2020 & 2033
- Table 57: Global Turkish Ceramics Industry Revenue Million Forecast, by Country 2020 & 2033
- Table 58: China Turkish Ceramics Industry Revenue (Million) Forecast, by Application 2020 & 2033
- Table 59: India Turkish Ceramics Industry Revenue (Million) Forecast, by Application 2020 & 2033
- Table 60: Japan Turkish Ceramics Industry Revenue (Million) Forecast, by Application 2020 & 2033
- Table 61: South Korea Turkish Ceramics Industry Revenue (Million) Forecast, by Application 2020 & 2033
- Table 62: ASEAN Turkish Ceramics Industry Revenue (Million) Forecast, by Application 2020 & 2033
- Table 63: Oceania Turkish Ceramics Industry Revenue (Million) Forecast, by Application 2020 & 2033
- Table 64: Rest of Asia Pacific Turkish Ceramics Industry Revenue (Million) Forecast, by Application 2020 & 2033
Frequently Asked Questions
1. What is the projected Compound Annual Growth Rate (CAGR) of the Turkish Ceramics Industry?
The projected CAGR is approximately 4.55%.
2. Which companies are prominent players in the Turkish Ceramics Industry?
Key companies in the market include Bien Seramik, Umpas Seramik, Graniser Seramik, Turkish Ceramics, Yurtbay Seramiks**List Not Exhaustive, Ege Seramik, Akgun Seramik, NG Kutahya Seramik, Seramiksan, Kale Group, VitrA.
3. What are the main segments of the Turkish Ceramics Industry?
The market segments include Production Analysis, Consumption Analysis, Import Market Analysis (Value & Volume), Export Market Analysis (Value & Volume), Price Trend Analysis.
4. Can you provide details about the market size?
The market size is estimated to be USD 1.37 Million as of 2022.
5. What are some drivers contributing to market growth?
Growth in e-Commerce.
6. What are the notable trends driving market growth?
Rising Construction Activities in Turkey Driving the Market.
7. Are there any restraints impacting market growth?
Counterfeit Products.
8. Can you provide examples of recent developments in the market?
2023: The new tile collection from Vitra is now available in its stores. Customers are urged to go on a daring, vibrant, and a regenerative voyage of discovery with VitrA Tiles' most recent integrated systems and material library, which are inspired by nature and the fundamental circular creativity of life. Wide ranges of ceramic tiles are available.
9. What pricing options are available for accessing the report?
Pricing options include single-user, multi-user, and enterprise licenses priced at USD 3800, USD 4500, and USD 5800 respectively.
10. Is the market size provided in terms of value or volume?
The market size is provided in terms of value, measured in Million.
11. Are there any specific market keywords associated with the report?
Yes, the market keyword associated with the report is "Turkish Ceramics Industry," which aids in identifying and referencing the specific market segment covered.
12. How do I determine which pricing option suits my needs best?
The pricing options vary based on user requirements and access needs. Individual users may opt for single-user licenses, while businesses requiring broader access may choose multi-user or enterprise licenses for cost-effective access to the report.
13. Are there any additional resources or data provided in the Turkish Ceramics Industry report?
While the report offers comprehensive insights, it's advisable to review the specific contents or supplementary materials provided to ascertain if additional resources or data are available.
14. How can I stay updated on further developments or reports in the Turkish Ceramics Industry?
To stay informed about further developments, trends, and reports in the Turkish Ceramics Industry, consider subscribing to industry newsletters, following relevant companies and organizations, or regularly checking reputable industry news sources and publications.
Methodology
Step 1 - Identification of Relevant Samples Size from Population Database


Step 2 - Approaches for Defining Global Market Size (Value, Volume* & Price*)

Note*: In applicable scenarios
Step 3 - Data Sources
Primary Research
- Web Analytics
- Survey Reports
- Research Institute
- Latest Research Reports
- Opinion Leaders
Secondary Research
- Annual Reports
- White Paper
- Latest Press Release
- Industry Association
- Paid Database
- Investor Presentations

Step 4 - Data Triangulation
Involves using different sources of information in order to increase the validity of a study
These sources are likely to be stakeholders in a program - participants, other researchers, program staff, other community members, and so on.
Then we put all data in single framework & apply various statistical tools to find out the dynamic on the market.
During the analysis stage, feedback from the stakeholder groups would be compared to determine areas of agreement as well as areas of divergence