
Key Insights
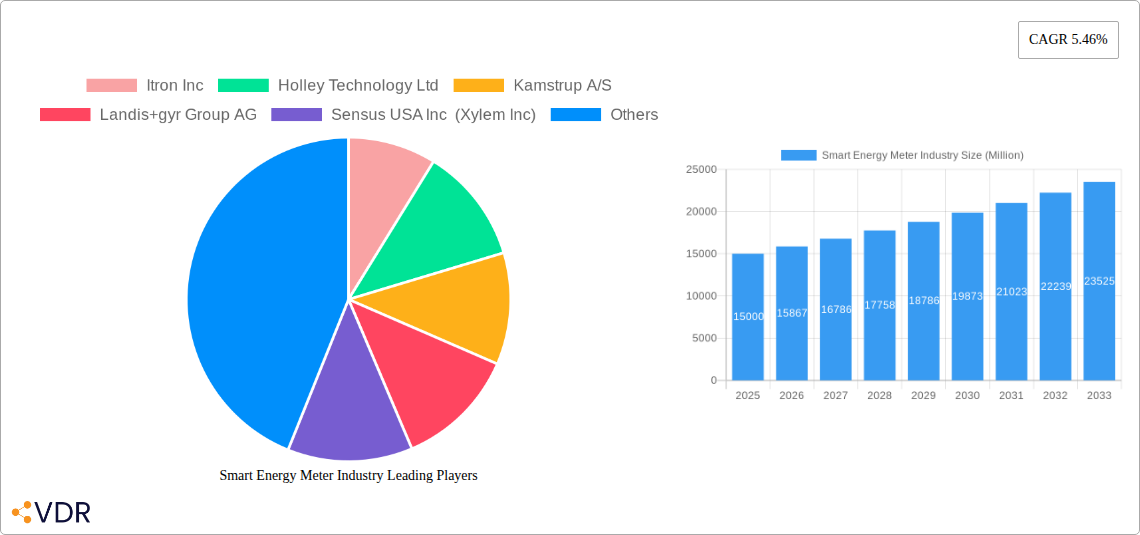
The smart energy meter market is experiencing robust growth, driven by the increasing need for efficient energy management, grid modernization initiatives, and the expanding adoption of renewable energy sources. A 5.46% CAGR indicates a significant expansion, projected to reach a substantial market value within the forecast period (2025-2033). Key drivers include government regulations promoting energy efficiency, the rising demand for real-time energy consumption data for improved grid stability and demand-side management, and the increasing affordability and sophistication of smart meter technology. The residential segment currently holds a significant share, fueled by individual consumers' desire to monitor and reduce their energy bills. However, the commercial and industrial sectors are exhibiting rapid growth, driven by opportunities for energy optimization and cost savings in large-scale operations. Leading players like Itron, Landis+Gyr, and Holley are investing heavily in research and development, focusing on advanced metering infrastructure (AMI) solutions with enhanced functionalities such as remote disconnect/reconnect capabilities, data analytics platforms, and integration with smart home ecosystems. The competitive landscape is characterized by both established players and emerging regional manufacturers, leading to innovation and price competitiveness. Geographic expansion is also notable, with North America and Europe currently holding larger market shares, while Asia-Pacific is poised for significant growth due to increasing infrastructure development and government support.
The market's growth trajectory is expected to continue, albeit with some potential restraints. The high initial investment costs associated with smart meter deployments might hinder adoption in certain regions, particularly developing economies. Concerns surrounding data security and privacy are also relevant, requiring robust cybersecurity measures and transparent data management practices. Nevertheless, ongoing technological advancements, such as the incorporation of artificial intelligence and machine learning for predictive analytics and improved grid management, are expected to mitigate these challenges. The integration of smart meters with other smart grid technologies, like smart inverters and energy storage systems, will further enhance the overall market value and propel its growth throughout the forecast period. The diverse range of end-user segments ensures a continuous market demand, and the ongoing efforts toward sustainable energy practices guarantee long-term viability for the smart energy meter industry.
Smart Energy Meter Industry Market Report: 2019-2033
This comprehensive report provides an in-depth analysis of the global smart energy meter industry, encompassing market dynamics, growth trends, regional segmentation, product landscape, key players, and future outlook. The study period covers 2019-2033, with 2025 as the base and estimated year. This report is essential for industry professionals, investors, and strategic decision-makers seeking to navigate this rapidly evolving market. The parent market is the energy metering market, and the child market is the smart energy meter segment within it.
Smart Energy Meter Industry Market Dynamics & Structure
This section analyzes the market's competitive landscape, technological advancements, regulatory influences, and market forces shaping its trajectory. We delve into market concentration, analyzing the market share of key players like Itron Inc, Holley Technology Ltd, and Landis+gyr Group AG. The report examines M&A activity within the industry, quantifying deal volumes during the historical period (2019-2024) and projecting trends for the forecast period (2025-2033).
- Market Concentration: The market exhibits a moderately concentrated structure with a few dominant players holding significant shares. xx% market share is held by the top 5 players in 2024.
- Technological Innovation: Advancements in communication technologies (e.g., cellular, mesh networking), data analytics capabilities, and AI-driven functionalities are key drivers. Barriers to innovation include high R&D costs and the need for interoperability standards.
- Regulatory Frameworks: Government regulations and incentives promoting energy efficiency and smart grid development significantly influence market growth. Varying regulations across regions create market complexities.
- Competitive Substitutes: Traditional electromechanical meters represent a significant competitive substitute, although their market share is declining due to the advantages of smart meters.
- End-User Demographics: Residential, commercial, and industrial end-users drive demand, with varying adoption rates based on factors like energy consumption patterns and regulatory mandates. The residential segment currently accounts for xx Million units.
- M&A Trends: The period 2019-2024 witnessed xx M&A deals, primarily driven by the consolidation of market players seeking to expand their geographical reach and product portfolios.
Smart Energy Meter Industry Growth Trends & Insights
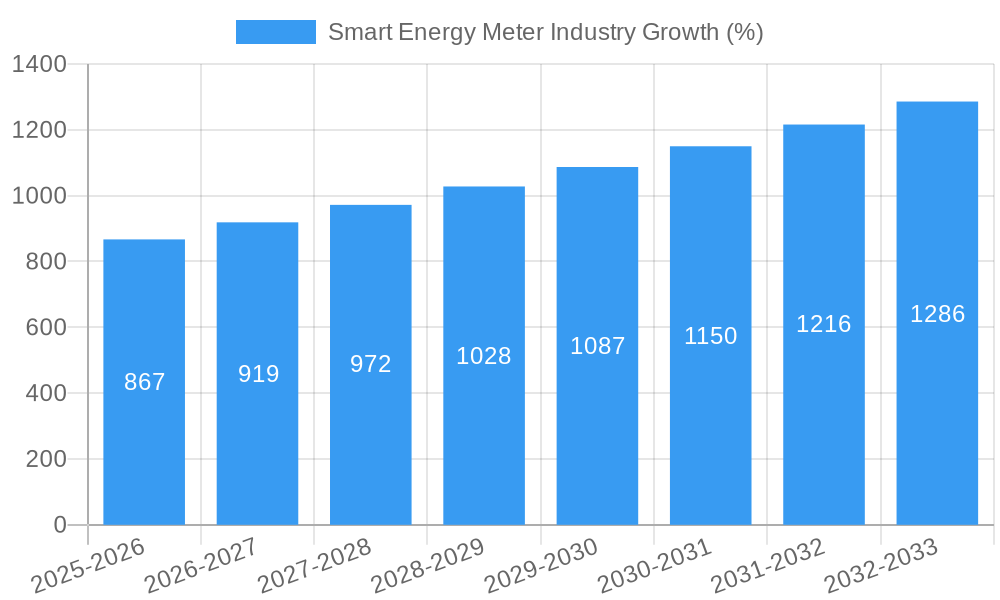
This section leverages extensive market research data to provide a detailed analysis of market size evolution, adoption rates, technological disruptions, and shifts in consumer behavior. The report presents a comprehensive overview of market size in Million units throughout the study period (2019-2033), highlighting the compound annual growth rate (CAGR) and market penetration rate. We examine the impact of technological disruptions such as the integration of renewable energy sources and the rise of IoT-enabled devices on market growth. The analysis includes consumer behavior shifts in energy consumption patterns and demand for real-time energy monitoring.
Dominant Regions, Countries, or Segments in Smart Energy Meter Industry
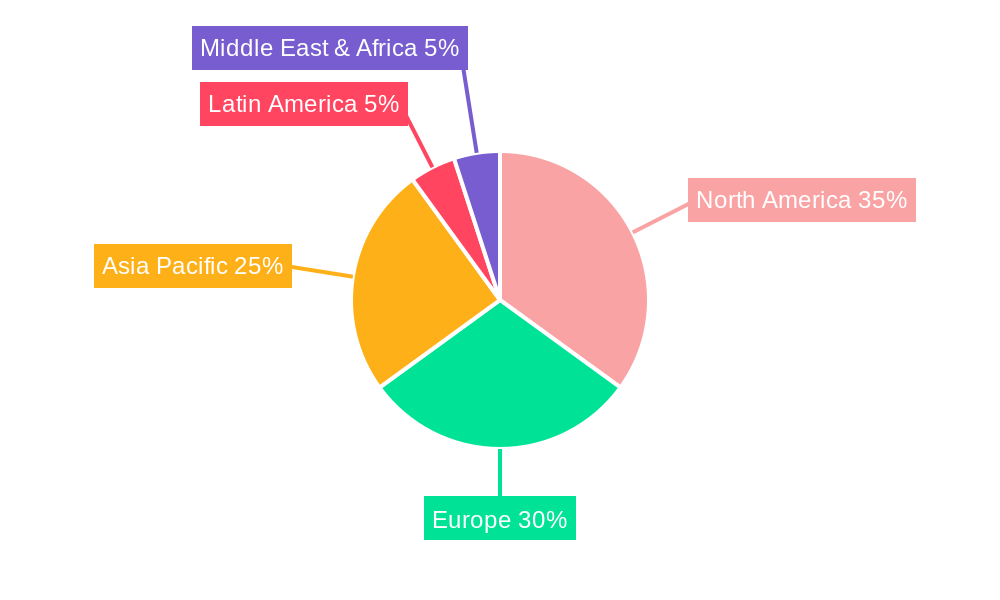
This section identifies the leading regions and segments driving market growth. The report analyzes market dominance by geographic region (e.g., North America, Europe, Asia-Pacific) and end-user segment (Residential, Commercial, Industrial). We examine key factors contributing to regional and segment dominance, including economic policies, infrastructure development, government initiatives, and consumer preferences.
- Asia-Pacific Dominance: Asia-Pacific is projected to dominate the market due to rapid urbanization, increasing energy demand, supportive government policies, and massive investments in smart grid infrastructure.
- Residential Segment Growth: The residential segment demonstrates the highest growth potential due to rising consumer awareness of energy efficiency, increasing affordability of smart meters, and government incentives.
- Key Drivers: Large-scale smart city initiatives and government mandates for advanced metering infrastructure (AMI) are key growth drivers.
Smart Energy Meter Industry Product Landscape
This section describes the range of smart energy meters available, encompassing their applications, performance metrics, and unique selling propositions. We examine various communication technologies (e.g., PLC, RF, cellular), data security features, and energy management capabilities. Advancements in meter design, sensor integration, and data analytics are also discussed.
Key Drivers, Barriers & Challenges in Smart Energy Meter Industry
This section identifies the key drivers and challenges influencing market growth.
Key Drivers:
- Increasing demand for energy efficiency and reduced carbon footprint.
- Government regulations and incentives promoting smart grid development.
- Rising adoption of renewable energy sources and the need for efficient grid management.
- Technological advancements leading to improved accuracy, reliability, and cost-effectiveness.
Key Challenges:
- High initial investment costs associated with smart meter deployment.
- Cybersecurity risks related to data security and network vulnerabilities.
- Interoperability issues across different smart meter technologies and communication protocols.
- Resistance from consumers and utilities towards adopting new technologies.
Emerging Opportunities in Smart Energy Meter Industry
Emerging opportunities include:
- Expansion into untapped markets in developing countries.
- Integration of smart meters with home automation systems and energy storage solutions.
- Development of advanced analytics platforms for enhanced energy management and grid optimization.
- Growing demand for smart meters with advanced functionalities, such as real-time monitoring, remote disconnect/reconnect capabilities, and two-way communication.
Growth Accelerators in the Smart Energy Meter Industry
Technological breakthroughs in communication technologies, data analytics, and artificial intelligence will fuel long-term growth. Strategic partnerships between utilities, technology providers, and system integrators will accelerate market adoption. Furthermore, expansion into emerging markets and the development of innovative business models will contribute to market expansion.
Key Players Shaping the Smart Energy Meter Industry Market
- Itron Inc
- Holley Technology Ltd
- Kamstrup A/S
- Landis+gyr Group AG
- Sensus USA Inc (Xylem Inc)
- Nanjing Xinlian Electronics Co Ltd
- Sagemcom SAS
- Jiangsu Linyang Energy Co Ltd
- Elster Group GMBH (Honeywell International Inc)
- Ningbo Sanxing Electric Co Ltd
- Shenzhen Hemei Group Co Ltd
- Wasion Group Holdings
- Hexing Electric Company Ltd
Notable Milestones in Smart Energy Meter Industry Sector
- August 2022: Adani Electricity Mumbai Limited (AEML) announced a USD 60 million investment to install seven lakh smart meters in Mumbai by the end of 2023.
- April 2021: Itron launched a new residential smart electricity meter (eHZ-B) for German utilities, supporting advanced metering infrastructure across Europe.
In-Depth Smart Energy Meter Industry Market Outlook
The smart energy meter market is poised for significant growth driven by increasing energy demand, government regulations, and technological advancements. Strategic partnerships and investments in R&D will further propel market expansion. Opportunities exist in developing smart grid solutions that integrate renewable energy sources, enhance grid stability, and improve energy efficiency. The focus on data analytics and AI-driven solutions will enhance energy management and optimize grid operations, creating significant value for both utilities and consumers.
Smart Energy Meter Industry Segmentation
-
1. End-user
- 1.1. Residential
- 1.2. Commercial
- 1.3. Industrial
Smart Energy Meter Industry Segmentation By Geography
-
1. North America
- 1.1. United States
- 1.2. Canada
-
2. Europe
- 2.1. United Kingdom
- 2.2. Spain
- 2.3. Germany
- 2.4. Italy
- 2.5. France
- 2.6. Turkey
- 2.7. Nordics
- 2.8. Benelux
- 2.9. Rest of Europe
-
3. Asia Pacific
- 3.1. China
- 3.2. India
- 3.3. Japan
- 3.4. Australia and New Zealand
- 3.5. South Korea
- 3.6. Southeast Asia
- 4. Rest of Asia Pacific
-
5. Latin America
- 5.1. Brazil
- 5.2. Mexico
- 5.3. Columbia
- 5.4. Chile
- 5.5. Rest of Latin America
- 6. Middle East
-
7. GCC
- 7.1. South Africa
- 7.2. Egypt
- 7.3. Rest of Africa
- 7.4. Rest of Middle East
Smart Energy Meter Industry REPORT HIGHLIGHTS
| Aspects | Details |
|---|---|
| Study Period | 2019-2033 |
| Base Year | 2024 |
| Estimated Year | 2025 |
| Forecast Period | 2025-2033 |
| Historical Period | 2019-2024 |
| Growth Rate | CAGR of 5.46% from 2019-2033 |
| Segmentation |
|
Table of Contents
- 1. Introduction
- 1.1. Research Scope
- 1.2. Market Segmentation
- 1.3. Research Methodology
- 1.4. Definitions and Assumptions
- 2. Executive Summary
- 2.1. Introduction
- 3. Market Dynamics
- 3.1. Introduction
- 3.2. Market Drivers
- 3.2.1. Supportive Government Regulations in Key Regions; Rise in Smart City Deployment
- 3.3. Market Restrains
- 3.3.1. High Costs and Security Concerns; Integration Difficulties with Smart Meters
- 3.4. Market Trends
- 3.4.1. Residential Segment to Register Significant Growing
- 4. Market Factor Analysis
- 4.1. Porters Five Forces
- 4.2. Supply/Value Chain
- 4.3. PESTEL analysis
- 4.4. Market Entropy
- 4.5. Patent/Trademark Analysis
- 5. Global Smart Energy Meter Industry Analysis, Insights and Forecast, 2019-2031
- 5.1. Market Analysis, Insights and Forecast - by End-user
- 5.1.1. Residential
- 5.1.2. Commercial
- 5.1.3. Industrial
- 5.2. Market Analysis, Insights and Forecast - by Region
- 5.2.1. North America
- 5.2.2. Europe
- 5.2.3. Asia Pacific
- 5.2.4. Rest of Asia Pacific
- 5.2.5. Latin America
- 5.2.6. Middle East
- 5.2.7. GCC
- 5.1. Market Analysis, Insights and Forecast - by End-user
- 6. North America Smart Energy Meter Industry Analysis, Insights and Forecast, 2019-2031
- 6.1. Market Analysis, Insights and Forecast - by End-user
- 6.1.1. Residential
- 6.1.2. Commercial
- 6.1.3. Industrial
- 6.1. Market Analysis, Insights and Forecast - by End-user
- 7. Europe Smart Energy Meter Industry Analysis, Insights and Forecast, 2019-2031
- 7.1. Market Analysis, Insights and Forecast - by End-user
- 7.1.1. Residential
- 7.1.2. Commercial
- 7.1.3. Industrial
- 7.1. Market Analysis, Insights and Forecast - by End-user
- 8. Asia Pacific Smart Energy Meter Industry Analysis, Insights and Forecast, 2019-2031
- 8.1. Market Analysis, Insights and Forecast - by End-user
- 8.1.1. Residential
- 8.1.2. Commercial
- 8.1.3. Industrial
- 8.1. Market Analysis, Insights and Forecast - by End-user
- 9. Rest of Asia Pacific Smart Energy Meter Industry Analysis, Insights and Forecast, 2019-2031
- 9.1. Market Analysis, Insights and Forecast - by End-user
- 9.1.1. Residential
- 9.1.2. Commercial
- 9.1.3. Industrial
- 9.1. Market Analysis, Insights and Forecast - by End-user
- 10. Latin America Smart Energy Meter Industry Analysis, Insights and Forecast, 2019-2031
- 10.1. Market Analysis, Insights and Forecast - by End-user
- 10.1.1. Residential
- 10.1.2. Commercial
- 10.1.3. Industrial
- 10.1. Market Analysis, Insights and Forecast - by End-user
- 11. Middle East Smart Energy Meter Industry Analysis, Insights and Forecast, 2019-2031
- 11.1. Market Analysis, Insights and Forecast - by End-user
- 11.1.1. Residential
- 11.1.2. Commercial
- 11.1.3. Industrial
- 11.1. Market Analysis, Insights and Forecast - by End-user
- 12. GCC Smart Energy Meter Industry Analysis, Insights and Forecast, 2019-2031
- 12.1. Market Analysis, Insights and Forecast - by End-user
- 12.1.1. Residential
- 12.1.2. Commercial
- 12.1.3. Industrial
- 12.1. Market Analysis, Insights and Forecast - by End-user
- 13. North America Smart Energy Meter Industry Analysis, Insights and Forecast, 2019-2031
- 13.1. Market Analysis, Insights and Forecast - By Country/Sub-region
- 13.1.1 United States
- 13.1.2 Canada
- 14. Europe Smart Energy Meter Industry Analysis, Insights and Forecast, 2019-2031
- 14.1. Market Analysis, Insights and Forecast - By Country/Sub-region
- 14.1.1 United Kingdom
- 14.1.2 Spain
- 14.1.3 Germany
- 14.1.4 Italy
- 14.1.5 France
- 14.1.6 Turkey
- 14.1.7 Nordics
- 14.1.8 Benelux
- 14.1.9 Rest of Europe
- 15. Asia Pacific Smart Energy Meter Industry Analysis, Insights and Forecast, 2019-2031
- 15.1. Market Analysis, Insights and Forecast - By Country/Sub-region
- 15.1.1 China
- 15.1.2 India
- 15.1.3 Japan
- 15.1.4 Australia and New Zealand
- 15.1.5 South Korea
- 15.1.6 Southeast Asia
- 16. Rest of Asia Pacific Smart Energy Meter Industry Analysis, Insights and Forecast, 2019-2031
- 16.1. Market Analysis, Insights and Forecast - By Country/Sub-region
- 16.1.1.
- 17. Latin America Smart Energy Meter Industry Analysis, Insights and Forecast, 2019-2031
- 17.1. Market Analysis, Insights and Forecast - By Country/Sub-region
- 17.1.1 Brazil
- 17.1.2 Mexico
- 17.1.3 Columbia
- 17.1.4 Chile
- 17.1.5 Rest of Latin America
- 18. Middle East Smart Energy Meter Industry Analysis, Insights and Forecast, 2019-2031
- 18.1. Market Analysis, Insights and Forecast - By Country/Sub-region
- 18.1.1.
- 19. GCC Smart Energy Meter Industry Analysis, Insights and Forecast, 2019-2031
- 19.1. Market Analysis, Insights and Forecast - By Country/Sub-region
- 19.1.1 South Africa
- 19.1.2 Egypt
- 19.1.3 Rest of Africa
- 19.1.4 Rest of Middle East
- 20. Competitive Analysis
- 20.1. Global Market Share Analysis 2024
- 20.2. Company Profiles
- 20.2.1 Itron Inc
- 20.2.1.1. Overview
- 20.2.1.2. Products
- 20.2.1.3. SWOT Analysis
- 20.2.1.4. Recent Developments
- 20.2.1.5. Financials (Based on Availability)
- 20.2.2 Holley Technology Ltd
- 20.2.2.1. Overview
- 20.2.2.2. Products
- 20.2.2.3. SWOT Analysis
- 20.2.2.4. Recent Developments
- 20.2.2.5. Financials (Based on Availability)
- 20.2.3 Kamstrup A/S
- 20.2.3.1. Overview
- 20.2.3.2. Products
- 20.2.3.3. SWOT Analysis
- 20.2.3.4. Recent Developments
- 20.2.3.5. Financials (Based on Availability)
- 20.2.4 Landis+gyr Group AG
- 20.2.4.1. Overview
- 20.2.4.2. Products
- 20.2.4.3. SWOT Analysis
- 20.2.4.4. Recent Developments
- 20.2.4.5. Financials (Based on Availability)
- 20.2.5 Sensus USA Inc (Xylem Inc)
- 20.2.5.1. Overview
- 20.2.5.2. Products
- 20.2.5.3. SWOT Analysis
- 20.2.5.4. Recent Developments
- 20.2.5.5. Financials (Based on Availability)
- 20.2.6 Nanjing Xinlian Electronics Co Ltd
- 20.2.6.1. Overview
- 20.2.6.2. Products
- 20.2.6.3. SWOT Analysis
- 20.2.6.4. Recent Developments
- 20.2.6.5. Financials (Based on Availability)
- 20.2.7 Sagemcom SAS
- 20.2.7.1. Overview
- 20.2.7.2. Products
- 20.2.7.3. SWOT Analysis
- 20.2.7.4. Recent Developments
- 20.2.7.5. Financials (Based on Availability)
- 20.2.8 Jiangsu Linyang Energy Co Ltd
- 20.2.8.1. Overview
- 20.2.8.2. Products
- 20.2.8.3. SWOT Analysis
- 20.2.8.4. Recent Developments
- 20.2.8.5. Financials (Based on Availability)
- 20.2.9 Elster Group GMBH (Honeywell International Inc )
- 20.2.9.1. Overview
- 20.2.9.2. Products
- 20.2.9.3. SWOT Analysis
- 20.2.9.4. Recent Developments
- 20.2.9.5. Financials (Based on Availability)
- 20.2.10 Ningbo Sanxing Electric Co Ltd
- 20.2.10.1. Overview
- 20.2.10.2. Products
- 20.2.10.3. SWOT Analysis
- 20.2.10.4. Recent Developments
- 20.2.10.5. Financials (Based on Availability)
- 20.2.11 Shenzhen Hemei Group Co Ltd*List Not Exhaustive
- 20.2.11.1. Overview
- 20.2.11.2. Products
- 20.2.11.3. SWOT Analysis
- 20.2.11.4. Recent Developments
- 20.2.11.5. Financials (Based on Availability)
- 20.2.12 Wasion Group Holdings
- 20.2.12.1. Overview
- 20.2.12.2. Products
- 20.2.12.3. SWOT Analysis
- 20.2.12.4. Recent Developments
- 20.2.12.5. Financials (Based on Availability)
- 20.2.13 Hexing Electric Company Ltd
- 20.2.13.1. Overview
- 20.2.13.2. Products
- 20.2.13.3. SWOT Analysis
- 20.2.13.4. Recent Developments
- 20.2.13.5. Financials (Based on Availability)
- 20.2.1 Itron Inc
List of Figures
- Figure 1: Global Smart Energy Meter Industry Revenue Breakdown (Million, %) by Region 2024 & 2032
- Figure 2: Global Smart Energy Meter Industry Volume Breakdown (Million, %) by Region 2024 & 2032
- Figure 3: North America Smart Energy Meter Industry Revenue (Million), by Country 2024 & 2032
- Figure 4: North America Smart Energy Meter Industry Volume (Million), by Country 2024 & 2032
- Figure 5: North America Smart Energy Meter Industry Revenue Share (%), by Country 2024 & 2032
- Figure 6: North America Smart Energy Meter Industry Volume Share (%), by Country 2024 & 2032
- Figure 7: Europe Smart Energy Meter Industry Revenue (Million), by Country 2024 & 2032
- Figure 8: Europe Smart Energy Meter Industry Volume (Million), by Country 2024 & 2032
- Figure 9: Europe Smart Energy Meter Industry Revenue Share (%), by Country 2024 & 2032
- Figure 10: Europe Smart Energy Meter Industry Volume Share (%), by Country 2024 & 2032
- Figure 11: Asia Pacific Smart Energy Meter Industry Revenue (Million), by Country 2024 & 2032
- Figure 12: Asia Pacific Smart Energy Meter Industry Volume (Million), by Country 2024 & 2032
- Figure 13: Asia Pacific Smart Energy Meter Industry Revenue Share (%), by Country 2024 & 2032
- Figure 14: Asia Pacific Smart Energy Meter Industry Volume Share (%), by Country 2024 & 2032
- Figure 15: Rest of Asia Pacific Smart Energy Meter Industry Revenue (Million), by Country 2024 & 2032
- Figure 16: Rest of Asia Pacific Smart Energy Meter Industry Volume (Million), by Country 2024 & 2032
- Figure 17: Rest of Asia Pacific Smart Energy Meter Industry Revenue Share (%), by Country 2024 & 2032
- Figure 18: Rest of Asia Pacific Smart Energy Meter Industry Volume Share (%), by Country 2024 & 2032
- Figure 19: Latin America Smart Energy Meter Industry Revenue (Million), by Country 2024 & 2032
- Figure 20: Latin America Smart Energy Meter Industry Volume (Million), by Country 2024 & 2032
- Figure 21: Latin America Smart Energy Meter Industry Revenue Share (%), by Country 2024 & 2032
- Figure 22: Latin America Smart Energy Meter Industry Volume Share (%), by Country 2024 & 2032
- Figure 23: Middle East Smart Energy Meter Industry Revenue (Million), by Country 2024 & 2032
- Figure 24: Middle East Smart Energy Meter Industry Volume (Million), by Country 2024 & 2032
- Figure 25: Middle East Smart Energy Meter Industry Revenue Share (%), by Country 2024 & 2032
- Figure 26: Middle East Smart Energy Meter Industry Volume Share (%), by Country 2024 & 2032
- Figure 27: GCC Smart Energy Meter Industry Revenue (Million), by Country 2024 & 2032
- Figure 28: GCC Smart Energy Meter Industry Volume (Million), by Country 2024 & 2032
- Figure 29: GCC Smart Energy Meter Industry Revenue Share (%), by Country 2024 & 2032
- Figure 30: GCC Smart Energy Meter Industry Volume Share (%), by Country 2024 & 2032
- Figure 31: North America Smart Energy Meter Industry Revenue (Million), by End-user 2024 & 2032
- Figure 32: North America Smart Energy Meter Industry Volume (Million), by End-user 2024 & 2032
- Figure 33: North America Smart Energy Meter Industry Revenue Share (%), by End-user 2024 & 2032
- Figure 34: North America Smart Energy Meter Industry Volume Share (%), by End-user 2024 & 2032
- Figure 35: North America Smart Energy Meter Industry Revenue (Million), by Country 2024 & 2032
- Figure 36: North America Smart Energy Meter Industry Volume (Million), by Country 2024 & 2032
- Figure 37: North America Smart Energy Meter Industry Revenue Share (%), by Country 2024 & 2032
- Figure 38: North America Smart Energy Meter Industry Volume Share (%), by Country 2024 & 2032
- Figure 39: Europe Smart Energy Meter Industry Revenue (Million), by End-user 2024 & 2032
- Figure 40: Europe Smart Energy Meter Industry Volume (Million), by End-user 2024 & 2032
- Figure 41: Europe Smart Energy Meter Industry Revenue Share (%), by End-user 2024 & 2032
- Figure 42: Europe Smart Energy Meter Industry Volume Share (%), by End-user 2024 & 2032
- Figure 43: Europe Smart Energy Meter Industry Revenue (Million), by Country 2024 & 2032
- Figure 44: Europe Smart Energy Meter Industry Volume (Million), by Country 2024 & 2032
- Figure 45: Europe Smart Energy Meter Industry Revenue Share (%), by Country 2024 & 2032
- Figure 46: Europe Smart Energy Meter Industry Volume Share (%), by Country 2024 & 2032
- Figure 47: Asia Pacific Smart Energy Meter Industry Revenue (Million), by End-user 2024 & 2032
- Figure 48: Asia Pacific Smart Energy Meter Industry Volume (Million), by End-user 2024 & 2032
- Figure 49: Asia Pacific Smart Energy Meter Industry Revenue Share (%), by End-user 2024 & 2032
- Figure 50: Asia Pacific Smart Energy Meter Industry Volume Share (%), by End-user 2024 & 2032
- Figure 51: Asia Pacific Smart Energy Meter Industry Revenue (Million), by Country 2024 & 2032
- Figure 52: Asia Pacific Smart Energy Meter Industry Volume (Million), by Country 2024 & 2032
- Figure 53: Asia Pacific Smart Energy Meter Industry Revenue Share (%), by Country 2024 & 2032
- Figure 54: Asia Pacific Smart Energy Meter Industry Volume Share (%), by Country 2024 & 2032
- Figure 55: Rest of Asia Pacific Smart Energy Meter Industry Revenue (Million), by End-user 2024 & 2032
- Figure 56: Rest of Asia Pacific Smart Energy Meter Industry Volume (Million), by End-user 2024 & 2032
- Figure 57: Rest of Asia Pacific Smart Energy Meter Industry Revenue Share (%), by End-user 2024 & 2032
- Figure 58: Rest of Asia Pacific Smart Energy Meter Industry Volume Share (%), by End-user 2024 & 2032
- Figure 59: Rest of Asia Pacific Smart Energy Meter Industry Revenue (Million), by Country 2024 & 2032
- Figure 60: Rest of Asia Pacific Smart Energy Meter Industry Volume (Million), by Country 2024 & 2032
- Figure 61: Rest of Asia Pacific Smart Energy Meter Industry Revenue Share (%), by Country 2024 & 2032
- Figure 62: Rest of Asia Pacific Smart Energy Meter Industry Volume Share (%), by Country 2024 & 2032
- Figure 63: Latin America Smart Energy Meter Industry Revenue (Million), by End-user 2024 & 2032
- Figure 64: Latin America Smart Energy Meter Industry Volume (Million), by End-user 2024 & 2032
- Figure 65: Latin America Smart Energy Meter Industry Revenue Share (%), by End-user 2024 & 2032
- Figure 66: Latin America Smart Energy Meter Industry Volume Share (%), by End-user 2024 & 2032
- Figure 67: Latin America Smart Energy Meter Industry Revenue (Million), by Country 2024 & 2032
- Figure 68: Latin America Smart Energy Meter Industry Volume (Million), by Country 2024 & 2032
- Figure 69: Latin America Smart Energy Meter Industry Revenue Share (%), by Country 2024 & 2032
- Figure 70: Latin America Smart Energy Meter Industry Volume Share (%), by Country 2024 & 2032
- Figure 71: Middle East Smart Energy Meter Industry Revenue (Million), by End-user 2024 & 2032
- Figure 72: Middle East Smart Energy Meter Industry Volume (Million), by End-user 2024 & 2032
- Figure 73: Middle East Smart Energy Meter Industry Revenue Share (%), by End-user 2024 & 2032
- Figure 74: Middle East Smart Energy Meter Industry Volume Share (%), by End-user 2024 & 2032
- Figure 75: Middle East Smart Energy Meter Industry Revenue (Million), by Country 2024 & 2032
- Figure 76: Middle East Smart Energy Meter Industry Volume (Million), by Country 2024 & 2032
- Figure 77: Middle East Smart Energy Meter Industry Revenue Share (%), by Country 2024 & 2032
- Figure 78: Middle East Smart Energy Meter Industry Volume Share (%), by Country 2024 & 2032
- Figure 79: GCC Smart Energy Meter Industry Revenue (Million), by End-user 2024 & 2032
- Figure 80: GCC Smart Energy Meter Industry Volume (Million), by End-user 2024 & 2032
- Figure 81: GCC Smart Energy Meter Industry Revenue Share (%), by End-user 2024 & 2032
- Figure 82: GCC Smart Energy Meter Industry Volume Share (%), by End-user 2024 & 2032
- Figure 83: GCC Smart Energy Meter Industry Revenue (Million), by Country 2024 & 2032
- Figure 84: GCC Smart Energy Meter Industry Volume (Million), by Country 2024 & 2032
- Figure 85: GCC Smart Energy Meter Industry Revenue Share (%), by Country 2024 & 2032
- Figure 86: GCC Smart Energy Meter Industry Volume Share (%), by Country 2024 & 2032
List of Tables
- Table 1: Global Smart Energy Meter Industry Revenue Million Forecast, by Region 2019 & 2032
- Table 2: Global Smart Energy Meter Industry Volume Million Forecast, by Region 2019 & 2032
- Table 3: Global Smart Energy Meter Industry Revenue Million Forecast, by End-user 2019 & 2032
- Table 4: Global Smart Energy Meter Industry Volume Million Forecast, by End-user 2019 & 2032
- Table 5: Global Smart Energy Meter Industry Revenue Million Forecast, by Region 2019 & 2032
- Table 6: Global Smart Energy Meter Industry Volume Million Forecast, by Region 2019 & 2032
- Table 7: Global Smart Energy Meter Industry Revenue Million Forecast, by Country 2019 & 2032
- Table 8: Global Smart Energy Meter Industry Volume Million Forecast, by Country 2019 & 2032
- Table 9: United States Smart Energy Meter Industry Revenue (Million) Forecast, by Application 2019 & 2032
- Table 10: United States Smart Energy Meter Industry Volume (Million) Forecast, by Application 2019 & 2032
- Table 11: Canada Smart Energy Meter Industry Revenue (Million) Forecast, by Application 2019 & 2032
- Table 12: Canada Smart Energy Meter Industry Volume (Million) Forecast, by Application 2019 & 2032
- Table 13: Global Smart Energy Meter Industry Revenue Million Forecast, by Country 2019 & 2032
- Table 14: Global Smart Energy Meter Industry Volume Million Forecast, by Country 2019 & 2032
- Table 15: United Kingdom Smart Energy Meter Industry Revenue (Million) Forecast, by Application 2019 & 2032
- Table 16: United Kingdom Smart Energy Meter Industry Volume (Million) Forecast, by Application 2019 & 2032
- Table 17: Spain Smart Energy Meter Industry Revenue (Million) Forecast, by Application 2019 & 2032
- Table 18: Spain Smart Energy Meter Industry Volume (Million) Forecast, by Application 2019 & 2032
- Table 19: Germany Smart Energy Meter Industry Revenue (Million) Forecast, by Application 2019 & 2032
- Table 20: Germany Smart Energy Meter Industry Volume (Million) Forecast, by Application 2019 & 2032
- Table 21: Italy Smart Energy Meter Industry Revenue (Million) Forecast, by Application 2019 & 2032
- Table 22: Italy Smart Energy Meter Industry Volume (Million) Forecast, by Application 2019 & 2032
- Table 23: France Smart Energy Meter Industry Revenue (Million) Forecast, by Application 2019 & 2032
- Table 24: France Smart Energy Meter Industry Volume (Million) Forecast, by Application 2019 & 2032
- Table 25: Turkey Smart Energy Meter Industry Revenue (Million) Forecast, by Application 2019 & 2032
- Table 26: Turkey Smart Energy Meter Industry Volume (Million) Forecast, by Application 2019 & 2032
- Table 27: Nordics Smart Energy Meter Industry Revenue (Million) Forecast, by Application 2019 & 2032
- Table 28: Nordics Smart Energy Meter Industry Volume (Million) Forecast, by Application 2019 & 2032
- Table 29: Benelux Smart Energy Meter Industry Revenue (Million) Forecast, by Application 2019 & 2032
- Table 30: Benelux Smart Energy Meter Industry Volume (Million) Forecast, by Application 2019 & 2032
- Table 31: Rest of Europe Smart Energy Meter Industry Revenue (Million) Forecast, by Application 2019 & 2032
- Table 32: Rest of Europe Smart Energy Meter Industry Volume (Million) Forecast, by Application 2019 & 2032
- Table 33: Global Smart Energy Meter Industry Revenue Million Forecast, by Country 2019 & 2032
- Table 34: Global Smart Energy Meter Industry Volume Million Forecast, by Country 2019 & 2032
- Table 35: China Smart Energy Meter Industry Revenue (Million) Forecast, by Application 2019 & 2032
- Table 36: China Smart Energy Meter Industry Volume (Million) Forecast, by Application 2019 & 2032
- Table 37: India Smart Energy Meter Industry Revenue (Million) Forecast, by Application 2019 & 2032
- Table 38: India Smart Energy Meter Industry Volume (Million) Forecast, by Application 2019 & 2032
- Table 39: Japan Smart Energy Meter Industry Revenue (Million) Forecast, by Application 2019 & 2032
- Table 40: Japan Smart Energy Meter Industry Volume (Million) Forecast, by Application 2019 & 2032
- Table 41: Australia and New Zealand Smart Energy Meter Industry Revenue (Million) Forecast, by Application 2019 & 2032
- Table 42: Australia and New Zealand Smart Energy Meter Industry Volume (Million) Forecast, by Application 2019 & 2032
- Table 43: South Korea Smart Energy Meter Industry Revenue (Million) Forecast, by Application 2019 & 2032
- Table 44: South Korea Smart Energy Meter Industry Volume (Million) Forecast, by Application 2019 & 2032
- Table 45: Southeast Asia Smart Energy Meter Industry Revenue (Million) Forecast, by Application 2019 & 2032
- Table 46: Southeast Asia Smart Energy Meter Industry Volume (Million) Forecast, by Application 2019 & 2032
- Table 47: Global Smart Energy Meter Industry Revenue Million Forecast, by Country 2019 & 2032
- Table 48: Global Smart Energy Meter Industry Volume Million Forecast, by Country 2019 & 2032
- Table 49: Smart Energy Meter Industry Revenue (Million) Forecast, by Application 2019 & 2032
- Table 50: Smart Energy Meter Industry Volume (Million) Forecast, by Application 2019 & 2032
- Table 51: Global Smart Energy Meter Industry Revenue Million Forecast, by Country 2019 & 2032
- Table 52: Global Smart Energy Meter Industry Volume Million Forecast, by Country 2019 & 2032
- Table 53: Brazil Smart Energy Meter Industry Revenue (Million) Forecast, by Application 2019 & 2032
- Table 54: Brazil Smart Energy Meter Industry Volume (Million) Forecast, by Application 2019 & 2032
- Table 55: Mexico Smart Energy Meter Industry Revenue (Million) Forecast, by Application 2019 & 2032
- Table 56: Mexico Smart Energy Meter Industry Volume (Million) Forecast, by Application 2019 & 2032
- Table 57: Columbia Smart Energy Meter Industry Revenue (Million) Forecast, by Application 2019 & 2032
- Table 58: Columbia Smart Energy Meter Industry Volume (Million) Forecast, by Application 2019 & 2032
- Table 59: Chile Smart Energy Meter Industry Revenue (Million) Forecast, by Application 2019 & 2032
- Table 60: Chile Smart Energy Meter Industry Volume (Million) Forecast, by Application 2019 & 2032
- Table 61: Rest of Latin America Smart Energy Meter Industry Revenue (Million) Forecast, by Application 2019 & 2032
- Table 62: Rest of Latin America Smart Energy Meter Industry Volume (Million) Forecast, by Application 2019 & 2032
- Table 63: Global Smart Energy Meter Industry Revenue Million Forecast, by Country 2019 & 2032
- Table 64: Global Smart Energy Meter Industry Volume Million Forecast, by Country 2019 & 2032
- Table 65: Smart Energy Meter Industry Revenue (Million) Forecast, by Application 2019 & 2032
- Table 66: Smart Energy Meter Industry Volume (Million) Forecast, by Application 2019 & 2032
- Table 67: Global Smart Energy Meter Industry Revenue Million Forecast, by Country 2019 & 2032
- Table 68: Global Smart Energy Meter Industry Volume Million Forecast, by Country 2019 & 2032
- Table 69: South Africa Smart Energy Meter Industry Revenue (Million) Forecast, by Application 2019 & 2032
- Table 70: South Africa Smart Energy Meter Industry Volume (Million) Forecast, by Application 2019 & 2032
- Table 71: Egypt Smart Energy Meter Industry Revenue (Million) Forecast, by Application 2019 & 2032
- Table 72: Egypt Smart Energy Meter Industry Volume (Million) Forecast, by Application 2019 & 2032
- Table 73: Rest of Africa Smart Energy Meter Industry Revenue (Million) Forecast, by Application 2019 & 2032
- Table 74: Rest of Africa Smart Energy Meter Industry Volume (Million) Forecast, by Application 2019 & 2032
- Table 75: Rest of Middle East Smart Energy Meter Industry Revenue (Million) Forecast, by Application 2019 & 2032
- Table 76: Rest of Middle East Smart Energy Meter Industry Volume (Million) Forecast, by Application 2019 & 2032
- Table 77: Global Smart Energy Meter Industry Revenue Million Forecast, by End-user 2019 & 2032
- Table 78: Global Smart Energy Meter Industry Volume Million Forecast, by End-user 2019 & 2032
- Table 79: Global Smart Energy Meter Industry Revenue Million Forecast, by Country 2019 & 2032
- Table 80: Global Smart Energy Meter Industry Volume Million Forecast, by Country 2019 & 2032
- Table 81: United States Smart Energy Meter Industry Revenue (Million) Forecast, by Application 2019 & 2032
- Table 82: United States Smart Energy Meter Industry Volume (Million) Forecast, by Application 2019 & 2032
- Table 83: Canada Smart Energy Meter Industry Revenue (Million) Forecast, by Application 2019 & 2032
- Table 84: Canada Smart Energy Meter Industry Volume (Million) Forecast, by Application 2019 & 2032
- Table 85: Global Smart Energy Meter Industry Revenue Million Forecast, by End-user 2019 & 2032
- Table 86: Global Smart Energy Meter Industry Volume Million Forecast, by End-user 2019 & 2032
- Table 87: Global Smart Energy Meter Industry Revenue Million Forecast, by Country 2019 & 2032
- Table 88: Global Smart Energy Meter Industry Volume Million Forecast, by Country 2019 & 2032
- Table 89: United Kingdom Smart Energy Meter Industry Revenue (Million) Forecast, by Application 2019 & 2032
- Table 90: United Kingdom Smart Energy Meter Industry Volume (Million) Forecast, by Application 2019 & 2032
- Table 91: Spain Smart Energy Meter Industry Revenue (Million) Forecast, by Application 2019 & 2032
- Table 92: Spain Smart Energy Meter Industry Volume (Million) Forecast, by Application 2019 & 2032
- Table 93: Germany Smart Energy Meter Industry Revenue (Million) Forecast, by Application 2019 & 2032
- Table 94: Germany Smart Energy Meter Industry Volume (Million) Forecast, by Application 2019 & 2032
- Table 95: Italy Smart Energy Meter Industry Revenue (Million) Forecast, by Application 2019 & 2032
- Table 96: Italy Smart Energy Meter Industry Volume (Million) Forecast, by Application 2019 & 2032
- Table 97: France Smart Energy Meter Industry Revenue (Million) Forecast, by Application 2019 & 2032
- Table 98: France Smart Energy Meter Industry Volume (Million) Forecast, by Application 2019 & 2032
- Table 99: Turkey Smart Energy Meter Industry Revenue (Million) Forecast, by Application 2019 & 2032
- Table 100: Turkey Smart Energy Meter Industry Volume (Million) Forecast, by Application 2019 & 2032
- Table 101: Nordics Smart Energy Meter Industry Revenue (Million) Forecast, by Application 2019 & 2032
- Table 102: Nordics Smart Energy Meter Industry Volume (Million) Forecast, by Application 2019 & 2032
- Table 103: Benelux Smart Energy Meter Industry Revenue (Million) Forecast, by Application 2019 & 2032
- Table 104: Benelux Smart Energy Meter Industry Volume (Million) Forecast, by Application 2019 & 2032
- Table 105: Rest of Europe Smart Energy Meter Industry Revenue (Million) Forecast, by Application 2019 & 2032
- Table 106: Rest of Europe Smart Energy Meter Industry Volume (Million) Forecast, by Application 2019 & 2032
- Table 107: Global Smart Energy Meter Industry Revenue Million Forecast, by End-user 2019 & 2032
- Table 108: Global Smart Energy Meter Industry Volume Million Forecast, by End-user 2019 & 2032
- Table 109: Global Smart Energy Meter Industry Revenue Million Forecast, by Country 2019 & 2032
- Table 110: Global Smart Energy Meter Industry Volume Million Forecast, by Country 2019 & 2032
- Table 111: China Smart Energy Meter Industry Revenue (Million) Forecast, by Application 2019 & 2032
- Table 112: China Smart Energy Meter Industry Volume (Million) Forecast, by Application 2019 & 2032
- Table 113: India Smart Energy Meter Industry Revenue (Million) Forecast, by Application 2019 & 2032
- Table 114: India Smart Energy Meter Industry Volume (Million) Forecast, by Application 2019 & 2032
- Table 115: Japan Smart Energy Meter Industry Revenue (Million) Forecast, by Application 2019 & 2032
- Table 116: Japan Smart Energy Meter Industry Volume (Million) Forecast, by Application 2019 & 2032
- Table 117: Australia and New Zealand Smart Energy Meter Industry Revenue (Million) Forecast, by Application 2019 & 2032
- Table 118: Australia and New Zealand Smart Energy Meter Industry Volume (Million) Forecast, by Application 2019 & 2032
- Table 119: South Korea Smart Energy Meter Industry Revenue (Million) Forecast, by Application 2019 & 2032
- Table 120: South Korea Smart Energy Meter Industry Volume (Million) Forecast, by Application 2019 & 2032
- Table 121: Southeast Asia Smart Energy Meter Industry Revenue (Million) Forecast, by Application 2019 & 2032
- Table 122: Southeast Asia Smart Energy Meter Industry Volume (Million) Forecast, by Application 2019 & 2032
- Table 123: Global Smart Energy Meter Industry Revenue Million Forecast, by End-user 2019 & 2032
- Table 124: Global Smart Energy Meter Industry Volume Million Forecast, by End-user 2019 & 2032
- Table 125: Global Smart Energy Meter Industry Revenue Million Forecast, by Country 2019 & 2032
- Table 126: Global Smart Energy Meter Industry Volume Million Forecast, by Country 2019 & 2032
- Table 127: Global Smart Energy Meter Industry Revenue Million Forecast, by End-user 2019 & 2032
- Table 128: Global Smart Energy Meter Industry Volume Million Forecast, by End-user 2019 & 2032
- Table 129: Global Smart Energy Meter Industry Revenue Million Forecast, by Country 2019 & 2032
- Table 130: Global Smart Energy Meter Industry Volume Million Forecast, by Country 2019 & 2032
- Table 131: Brazil Smart Energy Meter Industry Revenue (Million) Forecast, by Application 2019 & 2032
- Table 132: Brazil Smart Energy Meter Industry Volume (Million) Forecast, by Application 2019 & 2032
- Table 133: Mexico Smart Energy Meter Industry Revenue (Million) Forecast, by Application 2019 & 2032
- Table 134: Mexico Smart Energy Meter Industry Volume (Million) Forecast, by Application 2019 & 2032
- Table 135: Columbia Smart Energy Meter Industry Revenue (Million) Forecast, by Application 2019 & 2032
- Table 136: Columbia Smart Energy Meter Industry Volume (Million) Forecast, by Application 2019 & 2032
- Table 137: Chile Smart Energy Meter Industry Revenue (Million) Forecast, by Application 2019 & 2032
- Table 138: Chile Smart Energy Meter Industry Volume (Million) Forecast, by Application 2019 & 2032
- Table 139: Rest of Latin America Smart Energy Meter Industry Revenue (Million) Forecast, by Application 2019 & 2032
- Table 140: Rest of Latin America Smart Energy Meter Industry Volume (Million) Forecast, by Application 2019 & 2032
- Table 141: Global Smart Energy Meter Industry Revenue Million Forecast, by End-user 2019 & 2032
- Table 142: Global Smart Energy Meter Industry Volume Million Forecast, by End-user 2019 & 2032
- Table 143: Global Smart Energy Meter Industry Revenue Million Forecast, by Country 2019 & 2032
- Table 144: Global Smart Energy Meter Industry Volume Million Forecast, by Country 2019 & 2032
- Table 145: Global Smart Energy Meter Industry Revenue Million Forecast, by End-user 2019 & 2032
- Table 146: Global Smart Energy Meter Industry Volume Million Forecast, by End-user 2019 & 2032
- Table 147: Global Smart Energy Meter Industry Revenue Million Forecast, by Country 2019 & 2032
- Table 148: Global Smart Energy Meter Industry Volume Million Forecast, by Country 2019 & 2032
- Table 149: South Africa Smart Energy Meter Industry Revenue (Million) Forecast, by Application 2019 & 2032
- Table 150: South Africa Smart Energy Meter Industry Volume (Million) Forecast, by Application 2019 & 2032
- Table 151: Egypt Smart Energy Meter Industry Revenue (Million) Forecast, by Application 2019 & 2032
- Table 152: Egypt Smart Energy Meter Industry Volume (Million) Forecast, by Application 2019 & 2032
- Table 153: Rest of Africa Smart Energy Meter Industry Revenue (Million) Forecast, by Application 2019 & 2032
- Table 154: Rest of Africa Smart Energy Meter Industry Volume (Million) Forecast, by Application 2019 & 2032
- Table 155: Rest of Middle East Smart Energy Meter Industry Revenue (Million) Forecast, by Application 2019 & 2032
- Table 156: Rest of Middle East Smart Energy Meter Industry Volume (Million) Forecast, by Application 2019 & 2032
Frequently Asked Questions
1. What is the projected Compound Annual Growth Rate (CAGR) of the Smart Energy Meter Industry?
The projected CAGR is approximately 5.46%.
2. Which companies are prominent players in the Smart Energy Meter Industry?
Key companies in the market include Itron Inc, Holley Technology Ltd, Kamstrup A/S, Landis+gyr Group AG, Sensus USA Inc (Xylem Inc), Nanjing Xinlian Electronics Co Ltd, Sagemcom SAS, Jiangsu Linyang Energy Co Ltd, Elster Group GMBH (Honeywell International Inc ), Ningbo Sanxing Electric Co Ltd, Shenzhen Hemei Group Co Ltd*List Not Exhaustive, Wasion Group Holdings, Hexing Electric Company Ltd.
3. What are the main segments of the Smart Energy Meter Industry?
The market segments include End-user.
4. Can you provide details about the market size?
The market size is estimated to be USD XX Million as of 2022.
5. What are some drivers contributing to market growth?
Supportive Government Regulations in Key Regions; Rise in Smart City Deployment.
6. What are the notable trends driving market growth?
Residential Segment to Register Significant Growing.
7. Are there any restraints impacting market growth?
High Costs and Security Concerns; Integration Difficulties with Smart Meters.
8. Can you provide examples of recent developments in the market?
August 2022 - Adani Electricity Mumbai Limited (AEML) announced its plan to invest approximately INR 500 crore (~USD 60 million) to install smart meters in Mumbai, India. The company plans to install approximately seven lakh smart meters in the region by the end of 2023. The smart electricity meter of the company would enable the customers to get real-time updates on power consumption.
9. What pricing options are available for accessing the report?
Pricing options include single-user, multi-user, and enterprise licenses priced at USD 4750, USD 5250, and USD 8750 respectively.
10. Is the market size provided in terms of value or volume?
The market size is provided in terms of value, measured in Million and volume, measured in Million.
11. Are there any specific market keywords associated with the report?
Yes, the market keyword associated with the report is "Smart Energy Meter Industry," which aids in identifying and referencing the specific market segment covered.
12. How do I determine which pricing option suits my needs best?
The pricing options vary based on user requirements and access needs. Individual users may opt for single-user licenses, while businesses requiring broader access may choose multi-user or enterprise licenses for cost-effective access to the report.
13. Are there any additional resources or data provided in the Smart Energy Meter Industry report?
While the report offers comprehensive insights, it's advisable to review the specific contents or supplementary materials provided to ascertain if additional resources or data are available.
14. How can I stay updated on further developments or reports in the Smart Energy Meter Industry?
To stay informed about further developments, trends, and reports in the Smart Energy Meter Industry, consider subscribing to industry newsletters, following relevant companies and organizations, or regularly checking reputable industry news sources and publications.
Methodology
Step 1 - Identification of Relevant Samples Size from Population Database


Step 2 - Approaches for Defining Global Market Size (Value, Volume* & Price*)

Note*: In applicable scenarios
Step 3 - Data Sources
Primary Research
- Web Analytics
- Survey Reports
- Research Institute
- Latest Research Reports
- Opinion Leaders
Secondary Research
- Annual Reports
- White Paper
- Latest Press Release
- Industry Association
- Paid Database
- Investor Presentations

Step 4 - Data Triangulation
Involves using different sources of information in order to increase the validity of a study
These sources are likely to be stakeholders in a program - participants, other researchers, program staff, other community members, and so on.
Then we put all data in single framework & apply various statistical tools to find out the dynamic on the market.
During the analysis stage, feedback from the stakeholder groups would be compared to determine areas of agreement as well as areas of divergence


