
Key Insights
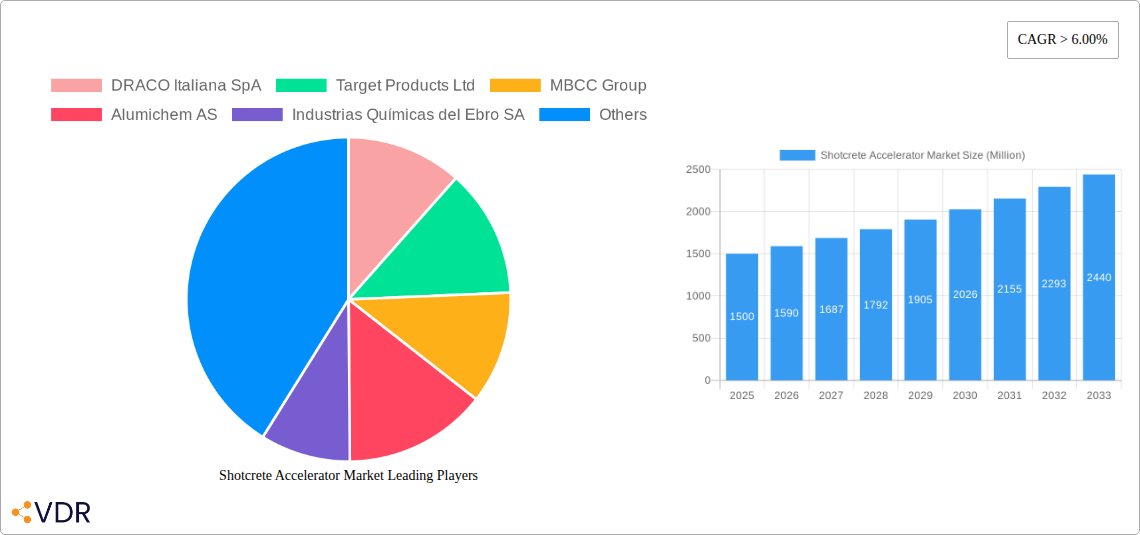
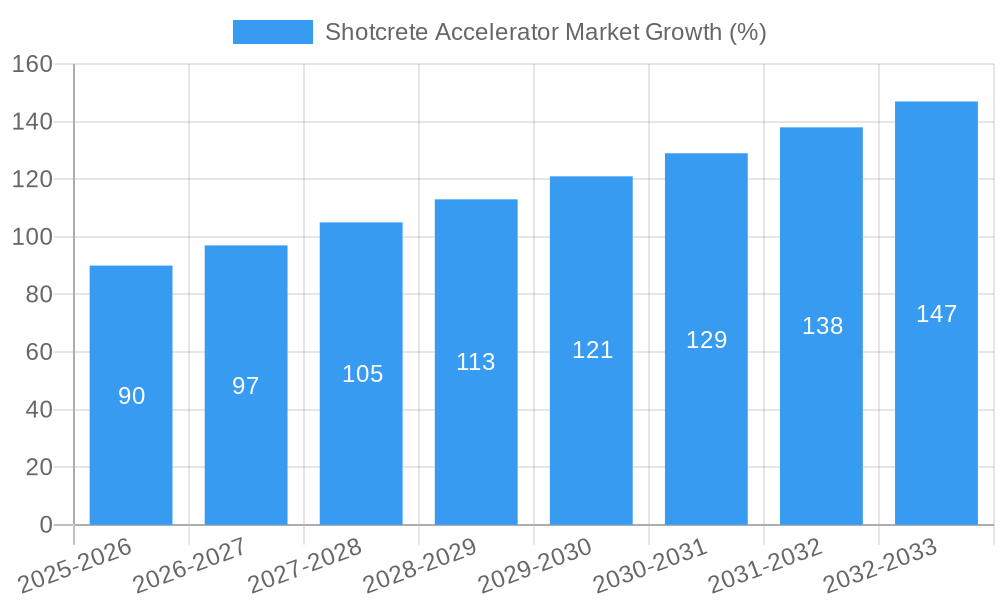
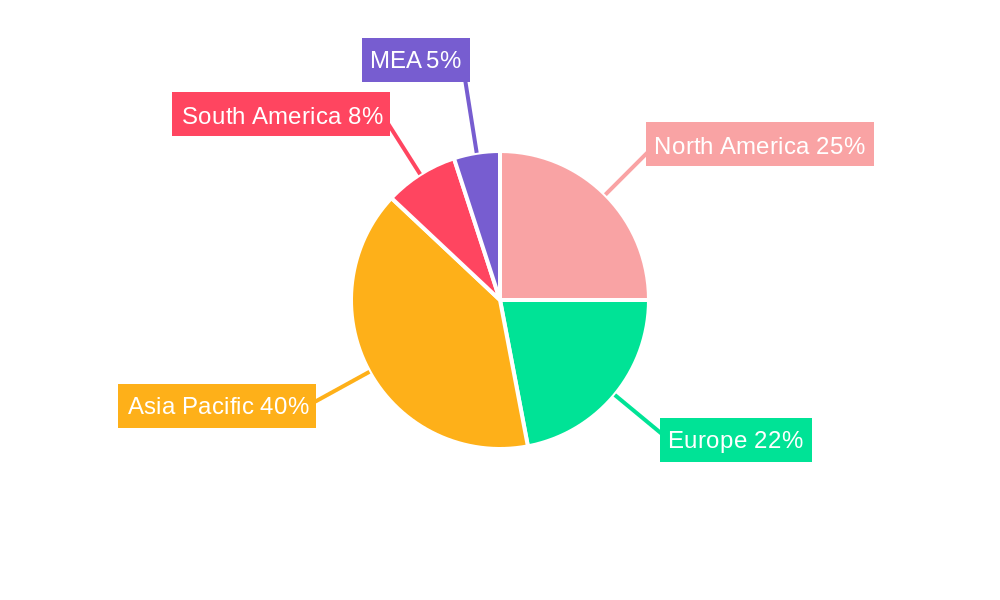
The global shotcrete accelerator market is experiencing robust growth, driven by the expanding construction and infrastructure sectors, particularly in developing economies. A CAGR exceeding 6% signifies considerable market expansion projected through 2033. Key drivers include the increasing demand for high-performance concrete in infrastructure projects like tunnels, dams, and bridges, as well as the rising adoption of shotcrete in mining operations for ground support and stabilization. The preference for alkali-free and alkaline aluminate-based accelerators is gaining traction due to their environmental benefits and improved performance characteristics. While the market faces restraints such as price fluctuations in raw materials and stringent environmental regulations, innovation in accelerator formulations and advancements in application techniques are mitigating these challenges. The wet mixing process currently dominates the market, though dry mix applications are expected to witness gradual growth, driven by advancements improving ease of use and safety. Geographically, the Asia-Pacific region, led by China and India, is anticipated to exhibit significant growth, owing to extensive infrastructure development and investments in mining projects. North America and Europe, while mature markets, will continue to contribute substantially due to ongoing infrastructure upgrades and maintenance. The market is moderately fragmented, with several global and regional players competing based on product quality, pricing, and technical expertise. Future growth will likely be influenced by government policies promoting sustainable construction practices, along with technological advancements leading to improved accelerator performance and reduced environmental impact.
The market segmentation highlights the diverse applications of shotcrete accelerators. Construction and infrastructure remain the dominant application segment, fueled by large-scale projects worldwide. Mining activities also represent a significant market segment, demanding robust and efficient accelerators for tunnel and slope stabilization. The liquid form of accelerators currently holds the largest market share, but powder formulations are experiencing growth due to their ease of transportation and handling. The alkali-free type is gaining popularity owing to its environmental friendliness and improved concrete durability. Key players are adopting strategies focused on research and development, strategic partnerships, and geographical expansion to gain a competitive edge in this dynamic market. The historical period (2019-2024) shows a steady upward trajectory, setting the stage for the substantial growth projected over the forecast period (2025-2033). Market estimations are based on analyzing historical growth rates, current market size, and future projections informed by industry trends and expert insights.
Shotcrete Accelerator Market: A Comprehensive Report (2019-2033)
This comprehensive report provides an in-depth analysis of the global Shotcrete Accelerator market, encompassing market dynamics, growth trends, regional insights, product landscape, and key players. The study period covers 2019-2033, with a base year of 2025 and a forecast period of 2025-2033. The report segments the market by application (Construction & Infrastructure, Mining, Other Applications), state (Liquid, Powder), mixing process (Wet, Dry), and type (Alkali-free, Alkaline Aluminate-based, Alkaline Silicate-based, Other Types). The total market size in 2025 is estimated at xx Million, projected to reach xx Million by 2033.
Shotcrete Accelerator Market Market Dynamics & Structure
The Shotcrete Accelerator market is characterized by moderate concentration, with a few major players holding significant market share. Technological innovation, primarily focused on enhancing setting time, strength development, and sustainability, is a key driver. Stringent environmental regulations regarding cement emissions influence product development and adoption. Competitive substitutes include alternative admixtures and techniques, putting pressure on pricing and innovation. The market demonstrates growth driven by large-scale infrastructure projects and mining activities, with significant end-user demographics residing in developing economies. M&A activity has been moderate, with a total of xx deals recorded between 2019 and 2024, primarily focused on expanding geographical reach and product portfolios.
- Market Concentration: Moderately concentrated, with top 5 players holding xx% market share in 2025.
- Technological Innovation: Focus on faster setting times, improved strength, and eco-friendly formulations.
- Regulatory Framework: Stringent environmental regulations driving the demand for sustainable alternatives.
- Competitive Substitutes: Alternative admixtures and construction techniques pose a competitive threat.
- End-User Demographics: Predominantly construction and mining industries in developing economies.
- M&A Trends: xx M&A deals between 2019 and 2024, primarily for expansion and diversification.
Shotcrete Accelerator Market Growth Trends & Insights
The Shotcrete Accelerator market experienced a CAGR of xx% during the historical period (2019-2024), driven by robust growth in the construction and infrastructure sector globally. Adoption rates are high in regions with extensive infrastructure development, while emerging economies show significant growth potential. Technological disruptions, such as the introduction of self-consolidating shotcrete and advanced admixtures, have accelerated market growth. Consumer behavior shifts towards sustainable and high-performance materials contribute to market expansion. The forecast period (2025-2033) anticipates a CAGR of xx%, driven by factors such as increasing urbanization, expanding mining operations, and growing demand for sustainable construction practices. Market penetration is expected to increase significantly in developing nations, with a projected xx% increase by 2033.
Dominant Regions, Countries, or Segments in Shotcrete Accelerator Market
The Construction & Infrastructure segment dominates the Shotcrete Accelerator market, accounting for xx% of the total market value in 2025. This dominance is fueled by large-scale infrastructure projects globally, particularly in Asia-Pacific and North America. Within the application segments, the Powder state holds a larger share due to its ease of handling and transportation. The Wet mixing process segment dominates due to its widespread application in various construction projects. Alkaline Aluminate-based shotcrete accelerators hold the largest share of the market, benefiting from its fast setting properties and high strength development.
- Key Drivers:
- Construction Boom: Rapid urbanization and infrastructure development in developing nations.
- Mining Expansion: Growing demand for minerals and raw materials worldwide.
- Government Policies: Investments in infrastructure projects and supportive regulations.
- Dominant Regions: Asia-Pacific and North America are projected to lead the market with xx% and xx% market share, respectively, by 2033.
Shotcrete Accelerator Market Product Landscape
The market features a wide range of shotcrete accelerators, varying in chemical composition, setting time, and performance characteristics. Recent innovations focus on developing environmentally friendly, high-performance products with enhanced strength development and reduced water consumption. Unique selling propositions include faster setting times, improved workability, and enhanced durability of the shotcrete. Technological advancements involve the incorporation of nanomaterials and advanced binders to optimize performance.
Key Drivers, Barriers & Challenges in Shotcrete Accelerator Market
Key Drivers: Growing infrastructure projects, expanding mining activities, and stringent environmental regulations driving the demand for high-performance, sustainable shotcrete accelerators. Technological advancements also contribute to cost reduction and performance improvements.
Challenges: Fluctuating raw material prices, competition from alternative admixtures, and stringent environmental regulations pose challenges to market growth. Supply chain disruptions caused by geopolitical events impact availability and pricing.
Emerging Opportunities in Shotcrete Accelerator Market
Untapped markets in developing nations present significant growth opportunities. Innovative applications in specialized construction projects (e.g., underwater construction, tunnel lining) offer potential for market expansion. Evolving consumer preferences towards sustainable and high-performance construction materials present opportunities for manufacturers to develop eco-friendly, high-strength accelerators.
Growth Accelerators in the Shotcrete Accelerator Market Industry
Technological breakthroughs in admixture chemistry, leading to improved performance and reduced environmental impact, are major growth accelerators. Strategic partnerships between manufacturers and construction companies promote product adoption and market penetration. Expanding into new geographic markets, especially developing economies, provides substantial growth potential.
Key Players Shaping the Shotcrete Accelerator Market Market
- DRACO Italiana SpA
- Target Products Ltd
- MBCC Group
- Alumichem AS
- Industrias Químicas del Ebro SA
- MUHU (China) Construction Materials Co Ltd
- Mapei SpA
- Maplad
- The Euclid Chemical Company
- CHRYSO India
- Sika AG
- JE Tomes
- CICO Group
- MC-Bauchemie
Notable Milestones in Shotcrete Accelerator Market Sector
- 2020: Sika AG launched a new line of sustainable shotcrete accelerators.
- 2022: MBCC Group acquired a smaller admixture manufacturer, expanding its product portfolio.
- 2023: New regulations on cement emissions came into effect in several countries.
In-Depth Shotcrete Accelerator Market Market Outlook
The Shotcrete Accelerator market is poised for continued growth, driven by sustained infrastructure development and technological advancements. Strategic partnerships, focused innovation in sustainable products, and expansion into emerging markets will be crucial for long-term success. The market presents attractive opportunities for players willing to invest in research and development and adapt to evolving market demands.
Shotcrete Accelerator Market Segmentation
-
1. State
- 1.1. Liquid
- 1.2. Powder
-
2. Mixing Process
- 2.1. Wet
- 2.2. Dry
-
3. Type
- 3.1. Alkali-free
- 3.2. Alkaline Aluminate-based
- 3.3. Alkaline Silicate-based
- 3.4. Other Types
-
4. Application
- 4.1. Construction and Infrastructure
- 4.2. Mining
- 4.3. Other Applications
Shotcrete Accelerator Market Segmentation By Geography
-
1. Asia Pacific
- 1.1. China
- 1.2. India
- 1.3. Japan
- 1.4. South Korea
- 1.5. Rest of Asia Pacific
-
2. North America
- 2.1. United States
- 2.2. Canada
- 2.3. Mexico
-
3. Europe
- 3.1. Germany
- 3.2. United Kingdom
- 3.3. Italy
- 3.4. France
- 3.5. Rest of Europe
-
4. South America
- 4.1. Brazil
- 4.2. Argentina
- 4.3. Rest of South America
-
5. Middle East and Africa
- 5.1. Saudi Arabia
- 5.2. South Africa
- 5.3. Rest of Middle East and Africa
Shotcrete Accelerator Market REPORT HIGHLIGHTS
| Aspects | Details |
|---|---|
| Study Period | 2019-2033 |
| Base Year | 2024 |
| Estimated Year | 2025 |
| Forecast Period | 2025-2033 |
| Historical Period | 2019-2024 |
| Growth Rate | CAGR of > 6.00% from 2019-2033 |
| Segmentation |
|
Table of Contents
- 1. Introduction
- 1.1. Research Scope
- 1.2. Market Segmentation
- 1.3. Research Methodology
- 1.4. Definitions and Assumptions
- 2. Executive Summary
- 2.1. Introduction
- 3. Market Dynamics
- 3.1. Introduction
- 3.2. Market Drivers
- 3.2.1. ; Growing Demand from the Construction and Infrastructure Industry; Increasing Demand from the Mining Sector
- 3.3. Market Restrains
- 3.3.1. ; Limited Performance of Alkali-free Shotcrete Accelerators; Unfavourable Conditions Arising Due to the COVID-19 Outbreak
- 3.4. Market Trends
- 3.4.1. Growing Demand from the Construction and Infrastructure Industry
- 4. Market Factor Analysis
- 4.1. Porters Five Forces
- 4.2. Supply/Value Chain
- 4.3. PESTEL analysis
- 4.4. Market Entropy
- 4.5. Patent/Trademark Analysis
- 5. Global Shotcrete Accelerator Market Analysis, Insights and Forecast, 2019-2031
- 5.1. Market Analysis, Insights and Forecast - by State
- 5.1.1. Liquid
- 5.1.2. Powder
- 5.2. Market Analysis, Insights and Forecast - by Mixing Process
- 5.2.1. Wet
- 5.2.2. Dry
- 5.3. Market Analysis, Insights and Forecast - by Type
- 5.3.1. Alkali-free
- 5.3.2. Alkaline Aluminate-based
- 5.3.3. Alkaline Silicate-based
- 5.3.4. Other Types
- 5.4. Market Analysis, Insights and Forecast - by Application
- 5.4.1. Construction and Infrastructure
- 5.4.2. Mining
- 5.4.3. Other Applications
- 5.5. Market Analysis, Insights and Forecast - by Region
- 5.5.1. Asia Pacific
- 5.5.2. North America
- 5.5.3. Europe
- 5.5.4. South America
- 5.5.5. Middle East and Africa
- 5.1. Market Analysis, Insights and Forecast - by State
- 6. Asia Pacific Shotcrete Accelerator Market Analysis, Insights and Forecast, 2019-2031
- 6.1. Market Analysis, Insights and Forecast - by State
- 6.1.1. Liquid
- 6.1.2. Powder
- 6.2. Market Analysis, Insights and Forecast - by Mixing Process
- 6.2.1. Wet
- 6.2.2. Dry
- 6.3. Market Analysis, Insights and Forecast - by Type
- 6.3.1. Alkali-free
- 6.3.2. Alkaline Aluminate-based
- 6.3.3. Alkaline Silicate-based
- 6.3.4. Other Types
- 6.4. Market Analysis, Insights and Forecast - by Application
- 6.4.1. Construction and Infrastructure
- 6.4.2. Mining
- 6.4.3. Other Applications
- 6.1. Market Analysis, Insights and Forecast - by State
- 7. North America Shotcrete Accelerator Market Analysis, Insights and Forecast, 2019-2031
- 7.1. Market Analysis, Insights and Forecast - by State
- 7.1.1. Liquid
- 7.1.2. Powder
- 7.2. Market Analysis, Insights and Forecast - by Mixing Process
- 7.2.1. Wet
- 7.2.2. Dry
- 7.3. Market Analysis, Insights and Forecast - by Type
- 7.3.1. Alkali-free
- 7.3.2. Alkaline Aluminate-based
- 7.3.3. Alkaline Silicate-based
- 7.3.4. Other Types
- 7.4. Market Analysis, Insights and Forecast - by Application
- 7.4.1. Construction and Infrastructure
- 7.4.2. Mining
- 7.4.3. Other Applications
- 7.1. Market Analysis, Insights and Forecast - by State
- 8. Europe Shotcrete Accelerator Market Analysis, Insights and Forecast, 2019-2031
- 8.1. Market Analysis, Insights and Forecast - by State
- 8.1.1. Liquid
- 8.1.2. Powder
- 8.2. Market Analysis, Insights and Forecast - by Mixing Process
- 8.2.1. Wet
- 8.2.2. Dry
- 8.3. Market Analysis, Insights and Forecast - by Type
- 8.3.1. Alkali-free
- 8.3.2. Alkaline Aluminate-based
- 8.3.3. Alkaline Silicate-based
- 8.3.4. Other Types
- 8.4. Market Analysis, Insights and Forecast - by Application
- 8.4.1. Construction and Infrastructure
- 8.4.2. Mining
- 8.4.3. Other Applications
- 8.1. Market Analysis, Insights and Forecast - by State
- 9. South America Shotcrete Accelerator Market Analysis, Insights and Forecast, 2019-2031
- 9.1. Market Analysis, Insights and Forecast - by State
- 9.1.1. Liquid
- 9.1.2. Powder
- 9.2. Market Analysis, Insights and Forecast - by Mixing Process
- 9.2.1. Wet
- 9.2.2. Dry
- 9.3. Market Analysis, Insights and Forecast - by Type
- 9.3.1. Alkali-free
- 9.3.2. Alkaline Aluminate-based
- 9.3.3. Alkaline Silicate-based
- 9.3.4. Other Types
- 9.4. Market Analysis, Insights and Forecast - by Application
- 9.4.1. Construction and Infrastructure
- 9.4.2. Mining
- 9.4.3. Other Applications
- 9.1. Market Analysis, Insights and Forecast - by State
- 10. Middle East and Africa Shotcrete Accelerator Market Analysis, Insights and Forecast, 2019-2031
- 10.1. Market Analysis, Insights and Forecast - by State
- 10.1.1. Liquid
- 10.1.2. Powder
- 10.2. Market Analysis, Insights and Forecast - by Mixing Process
- 10.2.1. Wet
- 10.2.2. Dry
- 10.3. Market Analysis, Insights and Forecast - by Type
- 10.3.1. Alkali-free
- 10.3.2. Alkaline Aluminate-based
- 10.3.3. Alkaline Silicate-based
- 10.3.4. Other Types
- 10.4. Market Analysis, Insights and Forecast - by Application
- 10.4.1. Construction and Infrastructure
- 10.4.2. Mining
- 10.4.3. Other Applications
- 10.1. Market Analysis, Insights and Forecast - by State
- 11. North America Shotcrete Accelerator Market Analysis, Insights and Forecast, 2019-2031
- 11.1. Market Analysis, Insights and Forecast - By Country/Sub-region
- 11.1.1 United States
- 11.1.2 Canada
- 11.1.3 Mexico
- 12. Europe Shotcrete Accelerator Market Analysis, Insights and Forecast, 2019-2031
- 12.1. Market Analysis, Insights and Forecast - By Country/Sub-region
- 12.1.1 Germany
- 12.1.2 France
- 12.1.3 Italy
- 12.1.4 United Kingdom
- 12.1.5 Netherlands
- 12.1.6 Rest of Europe
- 13. Asia Pacific Shotcrete Accelerator Market Analysis, Insights and Forecast, 2019-2031
- 13.1. Market Analysis, Insights and Forecast - By Country/Sub-region
- 13.1.1 China
- 13.1.2 Japan
- 13.1.3 India
- 13.1.4 South Korea
- 13.1.5 Taiwan
- 13.1.6 Australia
- 13.1.7 Rest of Asia-Pacific
- 14. South America Shotcrete Accelerator Market Analysis, Insights and Forecast, 2019-2031
- 14.1. Market Analysis, Insights and Forecast - By Country/Sub-region
- 14.1.1 Brazil
- 14.1.2 Argentina
- 14.1.3 Rest of South America
- 15. MEA Shotcrete Accelerator Market Analysis, Insights and Forecast, 2019-2031
- 15.1. Market Analysis, Insights and Forecast - By Country/Sub-region
- 15.1.1 Middle East
- 15.1.2 Africa
- 16. Competitive Analysis
- 16.1. Global Market Share Analysis 2024
- 16.2. Company Profiles
- 16.2.1 DRACO Italiana SpA
- 16.2.1.1. Overview
- 16.2.1.2. Products
- 16.2.1.3. SWOT Analysis
- 16.2.1.4. Recent Developments
- 16.2.1.5. Financials (Based on Availability)
- 16.2.2 Target Products Ltd
- 16.2.2.1. Overview
- 16.2.2.2. Products
- 16.2.2.3. SWOT Analysis
- 16.2.2.4. Recent Developments
- 16.2.2.5. Financials (Based on Availability)
- 16.2.3 MBCC Group
- 16.2.3.1. Overview
- 16.2.3.2. Products
- 16.2.3.3. SWOT Analysis
- 16.2.3.4. Recent Developments
- 16.2.3.5. Financials (Based on Availability)
- 16.2.4 Alumichem AS
- 16.2.4.1. Overview
- 16.2.4.2. Products
- 16.2.4.3. SWOT Analysis
- 16.2.4.4. Recent Developments
- 16.2.4.5. Financials (Based on Availability)
- 16.2.5 Industrias Químicas del Ebro SA
- 16.2.5.1. Overview
- 16.2.5.2. Products
- 16.2.5.3. SWOT Analysis
- 16.2.5.4. Recent Developments
- 16.2.5.5. Financials (Based on Availability)
- 16.2.6 MUHU (China) Construction Materials Co Ltd
- 16.2.6.1. Overview
- 16.2.6.2. Products
- 16.2.6.3. SWOT Analysis
- 16.2.6.4. Recent Developments
- 16.2.6.5. Financials (Based on Availability)
- 16.2.7 Mapei SpA
- 16.2.7.1. Overview
- 16.2.7.2. Products
- 16.2.7.3. SWOT Analysis
- 16.2.7.4. Recent Developments
- 16.2.7.5. Financials (Based on Availability)
- 16.2.8 Maplad
- 16.2.8.1. Overview
- 16.2.8.2. Products
- 16.2.8.3. SWOT Analysis
- 16.2.8.4. Recent Developments
- 16.2.8.5. Financials (Based on Availability)
- 16.2.9 The Euclid Chemical Company
- 16.2.9.1. Overview
- 16.2.9.2. Products
- 16.2.9.3. SWOT Analysis
- 16.2.9.4. Recent Developments
- 16.2.9.5. Financials (Based on Availability)
- 16.2.10 CHRYSO India
- 16.2.10.1. Overview
- 16.2.10.2. Products
- 16.2.10.3. SWOT Analysis
- 16.2.10.4. Recent Developments
- 16.2.10.5. Financials (Based on Availability)
- 16.2.11 Sika AG
- 16.2.11.1. Overview
- 16.2.11.2. Products
- 16.2.11.3. SWOT Analysis
- 16.2.11.4. Recent Developments
- 16.2.11.5. Financials (Based on Availability)
- 16.2.12 JE Tomes
- 16.2.12.1. Overview
- 16.2.12.2. Products
- 16.2.12.3. SWOT Analysis
- 16.2.12.4. Recent Developments
- 16.2.12.5. Financials (Based on Availability)
- 16.2.13 CICO Group
- 16.2.13.1. Overview
- 16.2.13.2. Products
- 16.2.13.3. SWOT Analysis
- 16.2.13.4. Recent Developments
- 16.2.13.5. Financials (Based on Availability)
- 16.2.14 MC-Bauchemie
- 16.2.14.1. Overview
- 16.2.14.2. Products
- 16.2.14.3. SWOT Analysis
- 16.2.14.4. Recent Developments
- 16.2.14.5. Financials (Based on Availability)
- 16.2.1 DRACO Italiana SpA
List of Figures
- Figure 1: Global Shotcrete Accelerator Market Revenue Breakdown (Million, %) by Region 2024 & 2032
- Figure 2: Global Shotcrete Accelerator Market Volume Breakdown (K Tons, %) by Region 2024 & 2032
- Figure 3: North America Shotcrete Accelerator Market Revenue (Million), by Country 2024 & 2032
- Figure 4: North America Shotcrete Accelerator Market Volume (K Tons), by Country 2024 & 2032
- Figure 5: North America Shotcrete Accelerator Market Revenue Share (%), by Country 2024 & 2032
- Figure 6: North America Shotcrete Accelerator Market Volume Share (%), by Country 2024 & 2032
- Figure 7: Europe Shotcrete Accelerator Market Revenue (Million), by Country 2024 & 2032
- Figure 8: Europe Shotcrete Accelerator Market Volume (K Tons), by Country 2024 & 2032
- Figure 9: Europe Shotcrete Accelerator Market Revenue Share (%), by Country 2024 & 2032
- Figure 10: Europe Shotcrete Accelerator Market Volume Share (%), by Country 2024 & 2032
- Figure 11: Asia Pacific Shotcrete Accelerator Market Revenue (Million), by Country 2024 & 2032
- Figure 12: Asia Pacific Shotcrete Accelerator Market Volume (K Tons), by Country 2024 & 2032
- Figure 13: Asia Pacific Shotcrete Accelerator Market Revenue Share (%), by Country 2024 & 2032
- Figure 14: Asia Pacific Shotcrete Accelerator Market Volume Share (%), by Country 2024 & 2032
- Figure 15: South America Shotcrete Accelerator Market Revenue (Million), by Country 2024 & 2032
- Figure 16: South America Shotcrete Accelerator Market Volume (K Tons), by Country 2024 & 2032
- Figure 17: South America Shotcrete Accelerator Market Revenue Share (%), by Country 2024 & 2032
- Figure 18: South America Shotcrete Accelerator Market Volume Share (%), by Country 2024 & 2032
- Figure 19: MEA Shotcrete Accelerator Market Revenue (Million), by Country 2024 & 2032
- Figure 20: MEA Shotcrete Accelerator Market Volume (K Tons), by Country 2024 & 2032
- Figure 21: MEA Shotcrete Accelerator Market Revenue Share (%), by Country 2024 & 2032
- Figure 22: MEA Shotcrete Accelerator Market Volume Share (%), by Country 2024 & 2032
- Figure 23: Asia Pacific Shotcrete Accelerator Market Revenue (Million), by State 2024 & 2032
- Figure 24: Asia Pacific Shotcrete Accelerator Market Volume (K Tons), by State 2024 & 2032
- Figure 25: Asia Pacific Shotcrete Accelerator Market Revenue Share (%), by State 2024 & 2032
- Figure 26: Asia Pacific Shotcrete Accelerator Market Volume Share (%), by State 2024 & 2032
- Figure 27: Asia Pacific Shotcrete Accelerator Market Revenue (Million), by Mixing Process 2024 & 2032
- Figure 28: Asia Pacific Shotcrete Accelerator Market Volume (K Tons), by Mixing Process 2024 & 2032
- Figure 29: Asia Pacific Shotcrete Accelerator Market Revenue Share (%), by Mixing Process 2024 & 2032
- Figure 30: Asia Pacific Shotcrete Accelerator Market Volume Share (%), by Mixing Process 2024 & 2032
- Figure 31: Asia Pacific Shotcrete Accelerator Market Revenue (Million), by Type 2024 & 2032
- Figure 32: Asia Pacific Shotcrete Accelerator Market Volume (K Tons), by Type 2024 & 2032
- Figure 33: Asia Pacific Shotcrete Accelerator Market Revenue Share (%), by Type 2024 & 2032
- Figure 34: Asia Pacific Shotcrete Accelerator Market Volume Share (%), by Type 2024 & 2032
- Figure 35: Asia Pacific Shotcrete Accelerator Market Revenue (Million), by Application 2024 & 2032
- Figure 36: Asia Pacific Shotcrete Accelerator Market Volume (K Tons), by Application 2024 & 2032
- Figure 37: Asia Pacific Shotcrete Accelerator Market Revenue Share (%), by Application 2024 & 2032
- Figure 38: Asia Pacific Shotcrete Accelerator Market Volume Share (%), by Application 2024 & 2032
- Figure 39: Asia Pacific Shotcrete Accelerator Market Revenue (Million), by Country 2024 & 2032
- Figure 40: Asia Pacific Shotcrete Accelerator Market Volume (K Tons), by Country 2024 & 2032
- Figure 41: Asia Pacific Shotcrete Accelerator Market Revenue Share (%), by Country 2024 & 2032
- Figure 42: Asia Pacific Shotcrete Accelerator Market Volume Share (%), by Country 2024 & 2032
- Figure 43: North America Shotcrete Accelerator Market Revenue (Million), by State 2024 & 2032
- Figure 44: North America Shotcrete Accelerator Market Volume (K Tons), by State 2024 & 2032
- Figure 45: North America Shotcrete Accelerator Market Revenue Share (%), by State 2024 & 2032
- Figure 46: North America Shotcrete Accelerator Market Volume Share (%), by State 2024 & 2032
- Figure 47: North America Shotcrete Accelerator Market Revenue (Million), by Mixing Process 2024 & 2032
- Figure 48: North America Shotcrete Accelerator Market Volume (K Tons), by Mixing Process 2024 & 2032
- Figure 49: North America Shotcrete Accelerator Market Revenue Share (%), by Mixing Process 2024 & 2032
- Figure 50: North America Shotcrete Accelerator Market Volume Share (%), by Mixing Process 2024 & 2032
- Figure 51: North America Shotcrete Accelerator Market Revenue (Million), by Type 2024 & 2032
- Figure 52: North America Shotcrete Accelerator Market Volume (K Tons), by Type 2024 & 2032
- Figure 53: North America Shotcrete Accelerator Market Revenue Share (%), by Type 2024 & 2032
- Figure 54: North America Shotcrete Accelerator Market Volume Share (%), by Type 2024 & 2032
- Figure 55: North America Shotcrete Accelerator Market Revenue (Million), by Application 2024 & 2032
- Figure 56: North America Shotcrete Accelerator Market Volume (K Tons), by Application 2024 & 2032
- Figure 57: North America Shotcrete Accelerator Market Revenue Share (%), by Application 2024 & 2032
- Figure 58: North America Shotcrete Accelerator Market Volume Share (%), by Application 2024 & 2032
- Figure 59: North America Shotcrete Accelerator Market Revenue (Million), by Country 2024 & 2032
- Figure 60: North America Shotcrete Accelerator Market Volume (K Tons), by Country 2024 & 2032
- Figure 61: North America Shotcrete Accelerator Market Revenue Share (%), by Country 2024 & 2032
- Figure 62: North America Shotcrete Accelerator Market Volume Share (%), by Country 2024 & 2032
- Figure 63: Europe Shotcrete Accelerator Market Revenue (Million), by State 2024 & 2032
- Figure 64: Europe Shotcrete Accelerator Market Volume (K Tons), by State 2024 & 2032
- Figure 65: Europe Shotcrete Accelerator Market Revenue Share (%), by State 2024 & 2032
- Figure 66: Europe Shotcrete Accelerator Market Volume Share (%), by State 2024 & 2032
- Figure 67: Europe Shotcrete Accelerator Market Revenue (Million), by Mixing Process 2024 & 2032
- Figure 68: Europe Shotcrete Accelerator Market Volume (K Tons), by Mixing Process 2024 & 2032
- Figure 69: Europe Shotcrete Accelerator Market Revenue Share (%), by Mixing Process 2024 & 2032
- Figure 70: Europe Shotcrete Accelerator Market Volume Share (%), by Mixing Process 2024 & 2032
- Figure 71: Europe Shotcrete Accelerator Market Revenue (Million), by Type 2024 & 2032
- Figure 72: Europe Shotcrete Accelerator Market Volume (K Tons), by Type 2024 & 2032
- Figure 73: Europe Shotcrete Accelerator Market Revenue Share (%), by Type 2024 & 2032
- Figure 74: Europe Shotcrete Accelerator Market Volume Share (%), by Type 2024 & 2032
- Figure 75: Europe Shotcrete Accelerator Market Revenue (Million), by Application 2024 & 2032
- Figure 76: Europe Shotcrete Accelerator Market Volume (K Tons), by Application 2024 & 2032
- Figure 77: Europe Shotcrete Accelerator Market Revenue Share (%), by Application 2024 & 2032
- Figure 78: Europe Shotcrete Accelerator Market Volume Share (%), by Application 2024 & 2032
- Figure 79: Europe Shotcrete Accelerator Market Revenue (Million), by Country 2024 & 2032
- Figure 80: Europe Shotcrete Accelerator Market Volume (K Tons), by Country 2024 & 2032
- Figure 81: Europe Shotcrete Accelerator Market Revenue Share (%), by Country 2024 & 2032
- Figure 82: Europe Shotcrete Accelerator Market Volume Share (%), by Country 2024 & 2032
- Figure 83: South America Shotcrete Accelerator Market Revenue (Million), by State 2024 & 2032
- Figure 84: South America Shotcrete Accelerator Market Volume (K Tons), by State 2024 & 2032
- Figure 85: South America Shotcrete Accelerator Market Revenue Share (%), by State 2024 & 2032
- Figure 86: South America Shotcrete Accelerator Market Volume Share (%), by State 2024 & 2032
- Figure 87: South America Shotcrete Accelerator Market Revenue (Million), by Mixing Process 2024 & 2032
- Figure 88: South America Shotcrete Accelerator Market Volume (K Tons), by Mixing Process 2024 & 2032
- Figure 89: South America Shotcrete Accelerator Market Revenue Share (%), by Mixing Process 2024 & 2032
- Figure 90: South America Shotcrete Accelerator Market Volume Share (%), by Mixing Process 2024 & 2032
- Figure 91: South America Shotcrete Accelerator Market Revenue (Million), by Type 2024 & 2032
- Figure 92: South America Shotcrete Accelerator Market Volume (K Tons), by Type 2024 & 2032
- Figure 93: South America Shotcrete Accelerator Market Revenue Share (%), by Type 2024 & 2032
- Figure 94: South America Shotcrete Accelerator Market Volume Share (%), by Type 2024 & 2032
- Figure 95: South America Shotcrete Accelerator Market Revenue (Million), by Application 2024 & 2032
- Figure 96: South America Shotcrete Accelerator Market Volume (K Tons), by Application 2024 & 2032
- Figure 97: South America Shotcrete Accelerator Market Revenue Share (%), by Application 2024 & 2032
- Figure 98: South America Shotcrete Accelerator Market Volume Share (%), by Application 2024 & 2032
- Figure 99: South America Shotcrete Accelerator Market Revenue (Million), by Country 2024 & 2032
- Figure 100: South America Shotcrete Accelerator Market Volume (K Tons), by Country 2024 & 2032
- Figure 101: South America Shotcrete Accelerator Market Revenue Share (%), by Country 2024 & 2032
- Figure 102: South America Shotcrete Accelerator Market Volume Share (%), by Country 2024 & 2032
- Figure 103: Middle East and Africa Shotcrete Accelerator Market Revenue (Million), by State 2024 & 2032
- Figure 104: Middle East and Africa Shotcrete Accelerator Market Volume (K Tons), by State 2024 & 2032
- Figure 105: Middle East and Africa Shotcrete Accelerator Market Revenue Share (%), by State 2024 & 2032
- Figure 106: Middle East and Africa Shotcrete Accelerator Market Volume Share (%), by State 2024 & 2032
- Figure 107: Middle East and Africa Shotcrete Accelerator Market Revenue (Million), by Mixing Process 2024 & 2032
- Figure 108: Middle East and Africa Shotcrete Accelerator Market Volume (K Tons), by Mixing Process 2024 & 2032
- Figure 109: Middle East and Africa Shotcrete Accelerator Market Revenue Share (%), by Mixing Process 2024 & 2032
- Figure 110: Middle East and Africa Shotcrete Accelerator Market Volume Share (%), by Mixing Process 2024 & 2032
- Figure 111: Middle East and Africa Shotcrete Accelerator Market Revenue (Million), by Type 2024 & 2032
- Figure 112: Middle East and Africa Shotcrete Accelerator Market Volume (K Tons), by Type 2024 & 2032
- Figure 113: Middle East and Africa Shotcrete Accelerator Market Revenue Share (%), by Type 2024 & 2032
- Figure 114: Middle East and Africa Shotcrete Accelerator Market Volume Share (%), by Type 2024 & 2032
- Figure 115: Middle East and Africa Shotcrete Accelerator Market Revenue (Million), by Application 2024 & 2032
- Figure 116: Middle East and Africa Shotcrete Accelerator Market Volume (K Tons), by Application 2024 & 2032
- Figure 117: Middle East and Africa Shotcrete Accelerator Market Revenue Share (%), by Application 2024 & 2032
- Figure 118: Middle East and Africa Shotcrete Accelerator Market Volume Share (%), by Application 2024 & 2032
- Figure 119: Middle East and Africa Shotcrete Accelerator Market Revenue (Million), by Country 2024 & 2032
- Figure 120: Middle East and Africa Shotcrete Accelerator Market Volume (K Tons), by Country 2024 & 2032
- Figure 121: Middle East and Africa Shotcrete Accelerator Market Revenue Share (%), by Country 2024 & 2032
- Figure 122: Middle East and Africa Shotcrete Accelerator Market Volume Share (%), by Country 2024 & 2032
List of Tables
- Table 1: Global Shotcrete Accelerator Market Revenue Million Forecast, by Region 2019 & 2032
- Table 2: Global Shotcrete Accelerator Market Volume K Tons Forecast, by Region 2019 & 2032
- Table 3: Global Shotcrete Accelerator Market Revenue Million Forecast, by State 2019 & 2032
- Table 4: Global Shotcrete Accelerator Market Volume K Tons Forecast, by State 2019 & 2032
- Table 5: Global Shotcrete Accelerator Market Revenue Million Forecast, by Mixing Process 2019 & 2032
- Table 6: Global Shotcrete Accelerator Market Volume K Tons Forecast, by Mixing Process 2019 & 2032
- Table 7: Global Shotcrete Accelerator Market Revenue Million Forecast, by Type 2019 & 2032
- Table 8: Global Shotcrete Accelerator Market Volume K Tons Forecast, by Type 2019 & 2032
- Table 9: Global Shotcrete Accelerator Market Revenue Million Forecast, by Application 2019 & 2032
- Table 10: Global Shotcrete Accelerator Market Volume K Tons Forecast, by Application 2019 & 2032
- Table 11: Global Shotcrete Accelerator Market Revenue Million Forecast, by Region 2019 & 2032
- Table 12: Global Shotcrete Accelerator Market Volume K Tons Forecast, by Region 2019 & 2032
- Table 13: Global Shotcrete Accelerator Market Revenue Million Forecast, by Country 2019 & 2032
- Table 14: Global Shotcrete Accelerator Market Volume K Tons Forecast, by Country 2019 & 2032
- Table 15: United States Shotcrete Accelerator Market Revenue (Million) Forecast, by Application 2019 & 2032
- Table 16: United States Shotcrete Accelerator Market Volume (K Tons) Forecast, by Application 2019 & 2032
- Table 17: Canada Shotcrete Accelerator Market Revenue (Million) Forecast, by Application 2019 & 2032
- Table 18: Canada Shotcrete Accelerator Market Volume (K Tons) Forecast, by Application 2019 & 2032
- Table 19: Mexico Shotcrete Accelerator Market Revenue (Million) Forecast, by Application 2019 & 2032
- Table 20: Mexico Shotcrete Accelerator Market Volume (K Tons) Forecast, by Application 2019 & 2032
- Table 21: Global Shotcrete Accelerator Market Revenue Million Forecast, by Country 2019 & 2032
- Table 22: Global Shotcrete Accelerator Market Volume K Tons Forecast, by Country 2019 & 2032
- Table 23: Germany Shotcrete Accelerator Market Revenue (Million) Forecast, by Application 2019 & 2032
- Table 24: Germany Shotcrete Accelerator Market Volume (K Tons) Forecast, by Application 2019 & 2032
- Table 25: France Shotcrete Accelerator Market Revenue (Million) Forecast, by Application 2019 & 2032
- Table 26: France Shotcrete Accelerator Market Volume (K Tons) Forecast, by Application 2019 & 2032
- Table 27: Italy Shotcrete Accelerator Market Revenue (Million) Forecast, by Application 2019 & 2032
- Table 28: Italy Shotcrete Accelerator Market Volume (K Tons) Forecast, by Application 2019 & 2032
- Table 29: United Kingdom Shotcrete Accelerator Market Revenue (Million) Forecast, by Application 2019 & 2032
- Table 30: United Kingdom Shotcrete Accelerator Market Volume (K Tons) Forecast, by Application 2019 & 2032
- Table 31: Netherlands Shotcrete Accelerator Market Revenue (Million) Forecast, by Application 2019 & 2032
- Table 32: Netherlands Shotcrete Accelerator Market Volume (K Tons) Forecast, by Application 2019 & 2032
- Table 33: Rest of Europe Shotcrete Accelerator Market Revenue (Million) Forecast, by Application 2019 & 2032
- Table 34: Rest of Europe Shotcrete Accelerator Market Volume (K Tons) Forecast, by Application 2019 & 2032
- Table 35: Global Shotcrete Accelerator Market Revenue Million Forecast, by Country 2019 & 2032
- Table 36: Global Shotcrete Accelerator Market Volume K Tons Forecast, by Country 2019 & 2032
- Table 37: China Shotcrete Accelerator Market Revenue (Million) Forecast, by Application 2019 & 2032
- Table 38: China Shotcrete Accelerator Market Volume (K Tons) Forecast, by Application 2019 & 2032
- Table 39: Japan Shotcrete Accelerator Market Revenue (Million) Forecast, by Application 2019 & 2032
- Table 40: Japan Shotcrete Accelerator Market Volume (K Tons) Forecast, by Application 2019 & 2032
- Table 41: India Shotcrete Accelerator Market Revenue (Million) Forecast, by Application 2019 & 2032
- Table 42: India Shotcrete Accelerator Market Volume (K Tons) Forecast, by Application 2019 & 2032
- Table 43: South Korea Shotcrete Accelerator Market Revenue (Million) Forecast, by Application 2019 & 2032
- Table 44: South Korea Shotcrete Accelerator Market Volume (K Tons) Forecast, by Application 2019 & 2032
- Table 45: Taiwan Shotcrete Accelerator Market Revenue (Million) Forecast, by Application 2019 & 2032
- Table 46: Taiwan Shotcrete Accelerator Market Volume (K Tons) Forecast, by Application 2019 & 2032
- Table 47: Australia Shotcrete Accelerator Market Revenue (Million) Forecast, by Application 2019 & 2032
- Table 48: Australia Shotcrete Accelerator Market Volume (K Tons) Forecast, by Application 2019 & 2032
- Table 49: Rest of Asia-Pacific Shotcrete Accelerator Market Revenue (Million) Forecast, by Application 2019 & 2032
- Table 50: Rest of Asia-Pacific Shotcrete Accelerator Market Volume (K Tons) Forecast, by Application 2019 & 2032
- Table 51: Global Shotcrete Accelerator Market Revenue Million Forecast, by Country 2019 & 2032
- Table 52: Global Shotcrete Accelerator Market Volume K Tons Forecast, by Country 2019 & 2032
- Table 53: Brazil Shotcrete Accelerator Market Revenue (Million) Forecast, by Application 2019 & 2032
- Table 54: Brazil Shotcrete Accelerator Market Volume (K Tons) Forecast, by Application 2019 & 2032
- Table 55: Argentina Shotcrete Accelerator Market Revenue (Million) Forecast, by Application 2019 & 2032
- Table 56: Argentina Shotcrete Accelerator Market Volume (K Tons) Forecast, by Application 2019 & 2032
- Table 57: Rest of South America Shotcrete Accelerator Market Revenue (Million) Forecast, by Application 2019 & 2032
- Table 58: Rest of South America Shotcrete Accelerator Market Volume (K Tons) Forecast, by Application 2019 & 2032
- Table 59: Global Shotcrete Accelerator Market Revenue Million Forecast, by Country 2019 & 2032
- Table 60: Global Shotcrete Accelerator Market Volume K Tons Forecast, by Country 2019 & 2032
- Table 61: Middle East Shotcrete Accelerator Market Revenue (Million) Forecast, by Application 2019 & 2032
- Table 62: Middle East Shotcrete Accelerator Market Volume (K Tons) Forecast, by Application 2019 & 2032
- Table 63: Africa Shotcrete Accelerator Market Revenue (Million) Forecast, by Application 2019 & 2032
- Table 64: Africa Shotcrete Accelerator Market Volume (K Tons) Forecast, by Application 2019 & 2032
- Table 65: Global Shotcrete Accelerator Market Revenue Million Forecast, by State 2019 & 2032
- Table 66: Global Shotcrete Accelerator Market Volume K Tons Forecast, by State 2019 & 2032
- Table 67: Global Shotcrete Accelerator Market Revenue Million Forecast, by Mixing Process 2019 & 2032
- Table 68: Global Shotcrete Accelerator Market Volume K Tons Forecast, by Mixing Process 2019 & 2032
- Table 69: Global Shotcrete Accelerator Market Revenue Million Forecast, by Type 2019 & 2032
- Table 70: Global Shotcrete Accelerator Market Volume K Tons Forecast, by Type 2019 & 2032
- Table 71: Global Shotcrete Accelerator Market Revenue Million Forecast, by Application 2019 & 2032
- Table 72: Global Shotcrete Accelerator Market Volume K Tons Forecast, by Application 2019 & 2032
- Table 73: Global Shotcrete Accelerator Market Revenue Million Forecast, by Country 2019 & 2032
- Table 74: Global Shotcrete Accelerator Market Volume K Tons Forecast, by Country 2019 & 2032
- Table 75: China Shotcrete Accelerator Market Revenue (Million) Forecast, by Application 2019 & 2032
- Table 76: China Shotcrete Accelerator Market Volume (K Tons) Forecast, by Application 2019 & 2032
- Table 77: India Shotcrete Accelerator Market Revenue (Million) Forecast, by Application 2019 & 2032
- Table 78: India Shotcrete Accelerator Market Volume (K Tons) Forecast, by Application 2019 & 2032
- Table 79: Japan Shotcrete Accelerator Market Revenue (Million) Forecast, by Application 2019 & 2032
- Table 80: Japan Shotcrete Accelerator Market Volume (K Tons) Forecast, by Application 2019 & 2032
- Table 81: South Korea Shotcrete Accelerator Market Revenue (Million) Forecast, by Application 2019 & 2032
- Table 82: South Korea Shotcrete Accelerator Market Volume (K Tons) Forecast, by Application 2019 & 2032
- Table 83: Rest of Asia Pacific Shotcrete Accelerator Market Revenue (Million) Forecast, by Application 2019 & 2032
- Table 84: Rest of Asia Pacific Shotcrete Accelerator Market Volume (K Tons) Forecast, by Application 2019 & 2032
- Table 85: Global Shotcrete Accelerator Market Revenue Million Forecast, by State 2019 & 2032
- Table 86: Global Shotcrete Accelerator Market Volume K Tons Forecast, by State 2019 & 2032
- Table 87: Global Shotcrete Accelerator Market Revenue Million Forecast, by Mixing Process 2019 & 2032
- Table 88: Global Shotcrete Accelerator Market Volume K Tons Forecast, by Mixing Process 2019 & 2032
- Table 89: Global Shotcrete Accelerator Market Revenue Million Forecast, by Type 2019 & 2032
- Table 90: Global Shotcrete Accelerator Market Volume K Tons Forecast, by Type 2019 & 2032
- Table 91: Global Shotcrete Accelerator Market Revenue Million Forecast, by Application 2019 & 2032
- Table 92: Global Shotcrete Accelerator Market Volume K Tons Forecast, by Application 2019 & 2032
- Table 93: Global Shotcrete Accelerator Market Revenue Million Forecast, by Country 2019 & 2032
- Table 94: Global Shotcrete Accelerator Market Volume K Tons Forecast, by Country 2019 & 2032
- Table 95: United States Shotcrete Accelerator Market Revenue (Million) Forecast, by Application 2019 & 2032
- Table 96: United States Shotcrete Accelerator Market Volume (K Tons) Forecast, by Application 2019 & 2032
- Table 97: Canada Shotcrete Accelerator Market Revenue (Million) Forecast, by Application 2019 & 2032
- Table 98: Canada Shotcrete Accelerator Market Volume (K Tons) Forecast, by Application 2019 & 2032
- Table 99: Mexico Shotcrete Accelerator Market Revenue (Million) Forecast, by Application 2019 & 2032
- Table 100: Mexico Shotcrete Accelerator Market Volume (K Tons) Forecast, by Application 2019 & 2032
- Table 101: Global Shotcrete Accelerator Market Revenue Million Forecast, by State 2019 & 2032
- Table 102: Global Shotcrete Accelerator Market Volume K Tons Forecast, by State 2019 & 2032
- Table 103: Global Shotcrete Accelerator Market Revenue Million Forecast, by Mixing Process 2019 & 2032
- Table 104: Global Shotcrete Accelerator Market Volume K Tons Forecast, by Mixing Process 2019 & 2032
- Table 105: Global Shotcrete Accelerator Market Revenue Million Forecast, by Type 2019 & 2032
- Table 106: Global Shotcrete Accelerator Market Volume K Tons Forecast, by Type 2019 & 2032
- Table 107: Global Shotcrete Accelerator Market Revenue Million Forecast, by Application 2019 & 2032
- Table 108: Global Shotcrete Accelerator Market Volume K Tons Forecast, by Application 2019 & 2032
- Table 109: Global Shotcrete Accelerator Market Revenue Million Forecast, by Country 2019 & 2032
- Table 110: Global Shotcrete Accelerator Market Volume K Tons Forecast, by Country 2019 & 2032
- Table 111: Germany Shotcrete Accelerator Market Revenue (Million) Forecast, by Application 2019 & 2032
- Table 112: Germany Shotcrete Accelerator Market Volume (K Tons) Forecast, by Application 2019 & 2032
- Table 113: United Kingdom Shotcrete Accelerator Market Revenue (Million) Forecast, by Application 2019 & 2032
- Table 114: United Kingdom Shotcrete Accelerator Market Volume (K Tons) Forecast, by Application 2019 & 2032
- Table 115: Italy Shotcrete Accelerator Market Revenue (Million) Forecast, by Application 2019 & 2032
- Table 116: Italy Shotcrete Accelerator Market Volume (K Tons) Forecast, by Application 2019 & 2032
- Table 117: France Shotcrete Accelerator Market Revenue (Million) Forecast, by Application 2019 & 2032
- Table 118: France Shotcrete Accelerator Market Volume (K Tons) Forecast, by Application 2019 & 2032
- Table 119: Rest of Europe Shotcrete Accelerator Market Revenue (Million) Forecast, by Application 2019 & 2032
- Table 120: Rest of Europe Shotcrete Accelerator Market Volume (K Tons) Forecast, by Application 2019 & 2032
- Table 121: Global Shotcrete Accelerator Market Revenue Million Forecast, by State 2019 & 2032
- Table 122: Global Shotcrete Accelerator Market Volume K Tons Forecast, by State 2019 & 2032
- Table 123: Global Shotcrete Accelerator Market Revenue Million Forecast, by Mixing Process 2019 & 2032
- Table 124: Global Shotcrete Accelerator Market Volume K Tons Forecast, by Mixing Process 2019 & 2032
- Table 125: Global Shotcrete Accelerator Market Revenue Million Forecast, by Type 2019 & 2032
- Table 126: Global Shotcrete Accelerator Market Volume K Tons Forecast, by Type 2019 & 2032
- Table 127: Global Shotcrete Accelerator Market Revenue Million Forecast, by Application 2019 & 2032
- Table 128: Global Shotcrete Accelerator Market Volume K Tons Forecast, by Application 2019 & 2032
- Table 129: Global Shotcrete Accelerator Market Revenue Million Forecast, by Country 2019 & 2032
- Table 130: Global Shotcrete Accelerator Market Volume K Tons Forecast, by Country 2019 & 2032
- Table 131: Brazil Shotcrete Accelerator Market Revenue (Million) Forecast, by Application 2019 & 2032
- Table 132: Brazil Shotcrete Accelerator Market Volume (K Tons) Forecast, by Application 2019 & 2032
- Table 133: Argentina Shotcrete Accelerator Market Revenue (Million) Forecast, by Application 2019 & 2032
- Table 134: Argentina Shotcrete Accelerator Market Volume (K Tons) Forecast, by Application 2019 & 2032
- Table 135: Rest of South America Shotcrete Accelerator Market Revenue (Million) Forecast, by Application 2019 & 2032
- Table 136: Rest of South America Shotcrete Accelerator Market Volume (K Tons) Forecast, by Application 2019 & 2032
- Table 137: Global Shotcrete Accelerator Market Revenue Million Forecast, by State 2019 & 2032
- Table 138: Global Shotcrete Accelerator Market Volume K Tons Forecast, by State 2019 & 2032
- Table 139: Global Shotcrete Accelerator Market Revenue Million Forecast, by Mixing Process 2019 & 2032
- Table 140: Global Shotcrete Accelerator Market Volume K Tons Forecast, by Mixing Process 2019 & 2032
- Table 141: Global Shotcrete Accelerator Market Revenue Million Forecast, by Type 2019 & 2032
- Table 142: Global Shotcrete Accelerator Market Volume K Tons Forecast, by Type 2019 & 2032
- Table 143: Global Shotcrete Accelerator Market Revenue Million Forecast, by Application 2019 & 2032
- Table 144: Global Shotcrete Accelerator Market Volume K Tons Forecast, by Application 2019 & 2032
- Table 145: Global Shotcrete Accelerator Market Revenue Million Forecast, by Country 2019 & 2032
- Table 146: Global Shotcrete Accelerator Market Volume K Tons Forecast, by Country 2019 & 2032
- Table 147: Saudi Arabia Shotcrete Accelerator Market Revenue (Million) Forecast, by Application 2019 & 2032
- Table 148: Saudi Arabia Shotcrete Accelerator Market Volume (K Tons) Forecast, by Application 2019 & 2032
- Table 149: South Africa Shotcrete Accelerator Market Revenue (Million) Forecast, by Application 2019 & 2032
- Table 150: South Africa Shotcrete Accelerator Market Volume (K Tons) Forecast, by Application 2019 & 2032
- Table 151: Rest of Middle East and Africa Shotcrete Accelerator Market Revenue (Million) Forecast, by Application 2019 & 2032
- Table 152: Rest of Middle East and Africa Shotcrete Accelerator Market Volume (K Tons) Forecast, by Application 2019 & 2032
Frequently Asked Questions
1. What is the projected Compound Annual Growth Rate (CAGR) of the Shotcrete Accelerator Market?
The projected CAGR is approximately > 6.00%.
2. Which companies are prominent players in the Shotcrete Accelerator Market?
Key companies in the market include DRACO Italiana SpA, Target Products Ltd, MBCC Group, Alumichem AS, Industrias Químicas del Ebro SA, MUHU (China) Construction Materials Co Ltd, Mapei SpA, Maplad, The Euclid Chemical Company, CHRYSO India, Sika AG, JE Tomes, CICO Group, MC-Bauchemie.
3. What are the main segments of the Shotcrete Accelerator Market?
The market segments include State, Mixing Process, Type, Application.
4. Can you provide details about the market size?
The market size is estimated to be USD XX Million as of 2022.
5. What are some drivers contributing to market growth?
; Growing Demand from the Construction and Infrastructure Industry; Increasing Demand from the Mining Sector.
6. What are the notable trends driving market growth?
Growing Demand from the Construction and Infrastructure Industry.
7. Are there any restraints impacting market growth?
; Limited Performance of Alkali-free Shotcrete Accelerators; Unfavourable Conditions Arising Due to the COVID-19 Outbreak.
8. Can you provide examples of recent developments in the market?
N/A
9. What pricing options are available for accessing the report?
Pricing options include single-user, multi-user, and enterprise licenses priced at USD 4750, USD 5250, and USD 8750 respectively.
10. Is the market size provided in terms of value or volume?
The market size is provided in terms of value, measured in Million and volume, measured in K Tons.
11. Are there any specific market keywords associated with the report?
Yes, the market keyword associated with the report is "Shotcrete Accelerator Market," which aids in identifying and referencing the specific market segment covered.
12. How do I determine which pricing option suits my needs best?
The pricing options vary based on user requirements and access needs. Individual users may opt for single-user licenses, while businesses requiring broader access may choose multi-user or enterprise licenses for cost-effective access to the report.
13. Are there any additional resources or data provided in the Shotcrete Accelerator Market report?
While the report offers comprehensive insights, it's advisable to review the specific contents or supplementary materials provided to ascertain if additional resources or data are available.
14. How can I stay updated on further developments or reports in the Shotcrete Accelerator Market?
To stay informed about further developments, trends, and reports in the Shotcrete Accelerator Market, consider subscribing to industry newsletters, following relevant companies and organizations, or regularly checking reputable industry news sources and publications.
Methodology
Step 1 - Identification of Relevant Samples Size from Population Database


Step 2 - Approaches for Defining Global Market Size (Value, Volume* & Price*)

Note*: In applicable scenarios
Step 3 - Data Sources
Primary Research
- Web Analytics
- Survey Reports
- Research Institute
- Latest Research Reports
- Opinion Leaders
Secondary Research
- Annual Reports
- White Paper
- Latest Press Release
- Industry Association
- Paid Database
- Investor Presentations

Step 4 - Data Triangulation
Involves using different sources of information in order to increase the validity of a study
These sources are likely to be stakeholders in a program - participants, other researchers, program staff, other community members, and so on.
Then we put all data in single framework & apply various statistical tools to find out the dynamic on the market.
During the analysis stage, feedback from the stakeholder groups would be compared to determine areas of agreement as well as areas of divergence


