
Key Insights
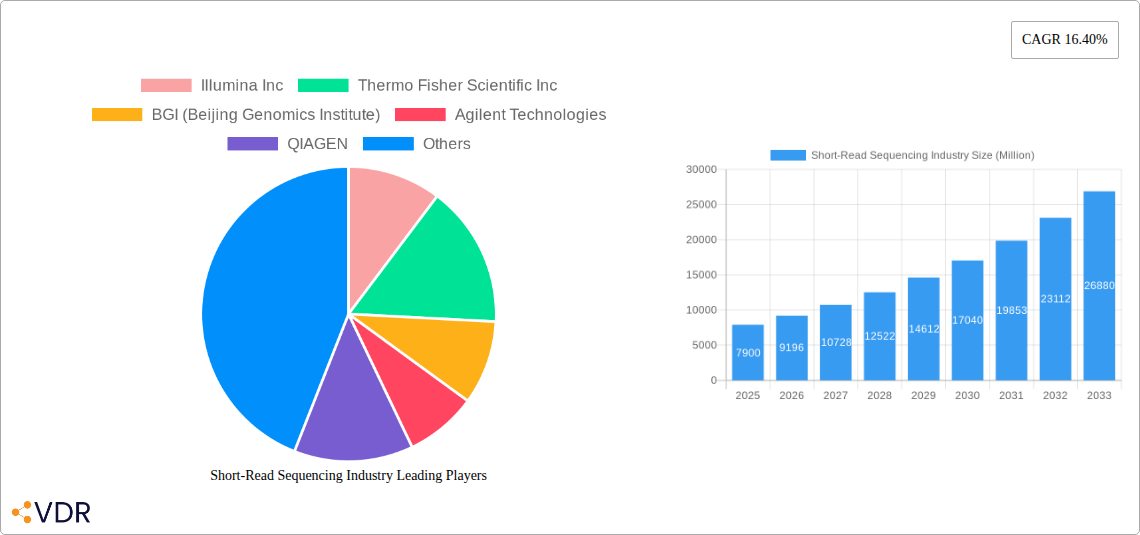
The short-read sequencing market, valued at $7.9 billion in 2025, is poised for substantial growth, exhibiting a Compound Annual Growth Rate (CAGR) of 16.4% from 2025 to 2033. This robust expansion is driven by several key factors. Firstly, the increasing adoption of next-generation sequencing (NGS) technologies across diverse applications, including genomics research, diagnostics, and personalized medicine, fuels market demand. Advances in sequencing technology, leading to higher throughput, faster turnaround times, and reduced costs, further stimulate growth. The rising prevalence of chronic diseases and the growing need for early disease detection and effective treatment strategies contribute significantly to market expansion. Furthermore, substantial investments in research and development by key players like Illumina, Thermo Fisher Scientific, and BGI are driving innovation and expanding the application landscape of short-read sequencing. Government initiatives promoting genomics research and personalized medicine also play a crucial role in fostering market growth.
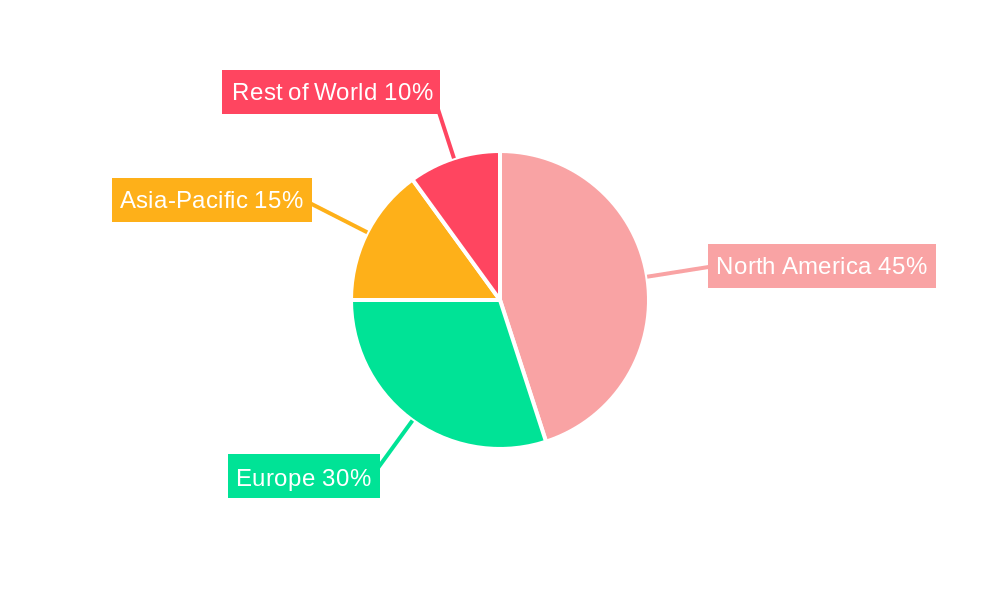
The market's segmentation reveals strong performance across various sectors. While precise segmental breakdowns are unavailable, it is reasonable to infer significant contributions from research applications (academic institutions and pharmaceutical companies), clinical diagnostics (cancer profiling, infectious disease detection), and agricultural genomics (crop improvement, livestock breeding). The geographic distribution likely mirrors global healthcare spending patterns, with North America and Europe holding substantial market share, followed by Asia-Pacific, experiencing rapid growth fueled by increasing investments in healthcare infrastructure and technological advancements. However, regulatory hurdles and the need for skilled professionals remain challenges. Nevertheless, the continued technological advancements, coupled with growing applications and funding, strongly indicate a positive outlook for the short-read sequencing market throughout the forecast period.
Short-Read Sequencing Industry Market Report: 2019-2033
This comprehensive report provides an in-depth analysis of the short-read sequencing industry, encompassing market dynamics, growth trends, regional insights, product landscape, and key players. The study period covers 2019-2033, with 2025 as the base and estimated year. This report is invaluable for industry professionals, investors, and researchers seeking to understand and capitalize on the opportunities within this rapidly evolving sector. The parent market is the Genomics market, and the child market is Short-Read Sequencing. The global market size in 2025 is estimated to be XX Million.
Short-Read Sequencing Industry Market Dynamics & Structure
The short-read sequencing market is characterized by a moderately concentrated landscape, with key players like Illumina, Thermo Fisher Scientific, and BGI holding significant market share. However, the market is also witnessing increased competition from emerging players offering innovative technologies and solutions. Technological innovation, particularly advancements in sequencing chemistry and platform miniaturization, is a key driver. Regulatory frameworks, particularly those concerning data privacy and ethical considerations in genomics research, play a significant role. The market also faces competition from alternative sequencing technologies, such as long-read sequencing. End-user demographics are expanding beyond traditional research institutions to include clinical diagnostics, pharmaceutical companies, and agricultural applications. M&A activity is frequent, reflecting the consolidation trend within the industry.
- Market Concentration: Illumina holds approximately xx% market share in 2025, while Thermo Fisher Scientific and BGI hold approximately xx% and xx%, respectively.
- Technological Innovation: Focus on increasing throughput, reducing costs, and improving accuracy drives innovation.
- Regulatory Landscape: Stringent data privacy regulations and ethical guidelines influence market growth.
- Competitive Substitutes: Long-read sequencing and other genomic technologies pose competitive pressure.
- End-User Demographics: Growth in clinical diagnostics and pharmaceutical applications drives demand.
- M&A Activity: XX major M&A deals were recorded between 2019 and 2024, indicating industry consolidation.
Short-Read Sequencing Industry Growth Trends & Insights
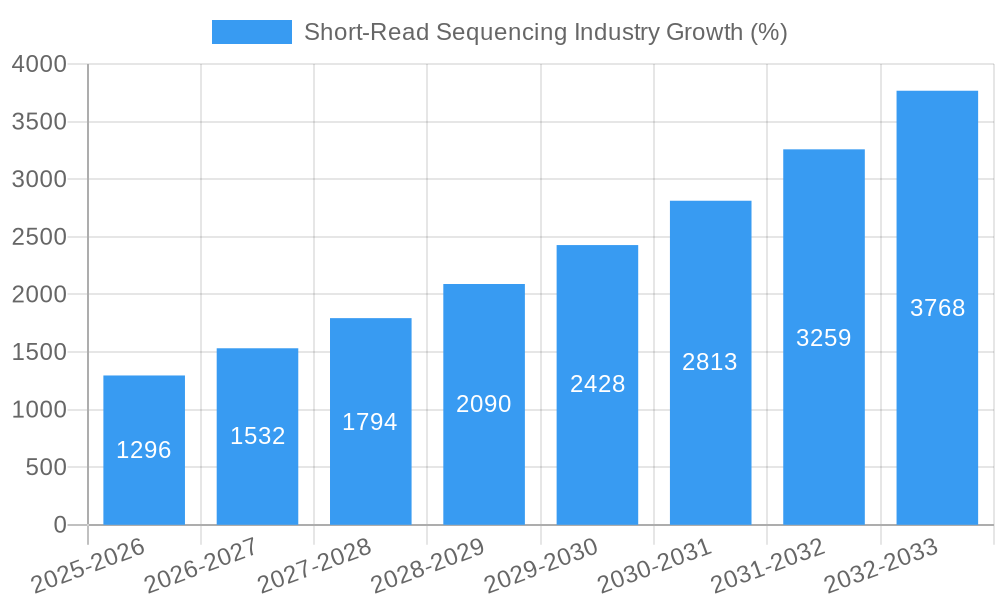
The short-read sequencing market experienced significant growth during the historical period (2019-2024), driven by factors such as decreasing sequencing costs, expanding applications, and technological advancements. The market is projected to maintain a robust CAGR of xx% during the forecast period (2025-2033), reaching an estimated value of XX Million by 2033. Increased adoption rates in clinical diagnostics and personalized medicine are key growth drivers. Technological disruptions, including the emergence of more accurate and efficient sequencing platforms, continue to shape market dynamics. Consumer behavior shifts, such as increased demand for faster turnaround times and user-friendly solutions, are also influencing market trends. Market penetration in emerging economies is expected to increase significantly, further fueling market expansion.
Dominant Regions, Countries, or Segments in Short-Read Sequencing Industry
North America currently dominates the short-read sequencing market, driven by strong research infrastructure, high adoption rates in clinical diagnostics, and the presence of major market players. However, the Asia-Pacific region is expected to experience the fastest growth during the forecast period due to increasing investments in healthcare infrastructure, rising genomic research activities, and favorable government initiatives. Europe also holds a substantial market share due to robust healthcare systems and a strong focus on personalized medicine.
- North America: High adoption rates in clinical diagnostics and strong research infrastructure contribute to market dominance.
- Asia-Pacific: Rapid growth driven by increasing healthcare investments and governmental support for genomic research.
- Europe: Strong healthcare systems and focus on personalized medicine fuel market expansion.
- Key Drivers: Government funding for research, growing awareness of genomics applications, and technological advancements.
Short-Read Sequencing Industry Product Landscape
Short-read sequencing platforms are categorized into benchtop, mid-throughput, and high-throughput systems, each offering varying levels of throughput, accuracy, and cost-effectiveness. Recent innovations focus on improving sequencing speed, reducing error rates, and simplifying workflows. Unique selling propositions include ease-of-use, high throughput, and improved data analysis tools. Technological advancements like improved sequencing chemistries and integrated data analysis software are enhancing the efficiency and accessibility of short-read sequencing.
Key Drivers, Barriers & Challenges in Short-Read Sequencing Industry
Key Drivers:
- Decreasing sequencing costs
- Expanding applications in various fields (e.g., healthcare, agriculture, forensics)
- Technological advancements resulting in increased speed, accuracy, and throughput
Challenges:
- High initial investment costs for some platforms
- Data analysis and interpretation complexities
- Regulatory hurdles and ethical concerns surrounding genomic data
Emerging Opportunities in Short-Read Sequencing Industry
Emerging opportunities include expansion into new applications, such as environmental monitoring and infectious disease surveillance. The development of portable and user-friendly sequencing devices is also creating new market avenues. Moreover, the increasing integration of short-read sequencing with other technologies, like artificial intelligence (AI) and machine learning, will lead to innovative applications.
Growth Accelerators in the Short-Read Sequencing Industry Industry
Technological advancements, including the development of next-generation sequencing platforms with improved accuracy, speed, and cost-effectiveness, are primary growth catalysts. Strategic partnerships between sequencing platform providers and data analysis companies will drive market growth. Furthermore, expansion into new markets and applications, such as personalized medicine and agricultural genomics, will create new opportunities for growth.
Key Players Shaping the Short-Read Sequencing Industry Market
- Illumina Inc
- Thermo Fisher Scientific Inc
- BGI (Beijing Genomics Institute)
- Agilent Technologies
- QIAGEN
- F Hoffmann-La Roche Ltd
- Pacific Biosciences (PacBio)
- 10x Genomics
- Oxford Nanopore Technologies PLC
- Macrogen Inc
- PerkinElmer Inc *List Not Exhaustive
Notable Milestones in Short-Read Sequencing Industry Sector
- December 2023: Firalis Molecular Precision acquires Illumina NovaSeq X Plus Sequencing System, enhancing its genomics capabilities.
- August 2023: PacBio commercializes the Onso short-read sequencing system in the US, introducing novel SBB chemistry.
In-Depth Short-Read Sequencing Industry Market Outlook
The short-read sequencing market is poised for continued expansion, driven by ongoing technological innovations, increasing demand for personalized medicine, and expansion into new applications. Strategic partnerships and collaborations within the industry are expected to accelerate market growth. The focus on developing user-friendly, cost-effective platforms will further enhance market accessibility and penetration in emerging economies. This presents significant strategic opportunities for companies to invest in research and development, expand their market reach, and capture a share of this rapidly growing sector.
Short-Read Sequencing Industry Segmentation
-
1. Product and Services
- 1.1. Instruments
- 1.2. Consumables
-
2. Platform
- 2.1. Sequencing by Synthesis (SBS)
- 2.2. Sequencing by Binding (SBB)
- 2.3. Sequencing by Ligation (SBL)
-
3. Application
- 3.1. Whole Genome Sequencing (WGS)
- 3.2. Whole Exome Sequencing (WES)
- 3.3. Other Applications
-
4. End User
- 4.1. Academic and Research Institutes
- 4.2. Pharmaceutical and Biotechnology Companies
- 4.3. Clinical Research Laboratories
- 4.4. Other End Users
Short-Read Sequencing Industry Segmentation By Geography
-
1. North America
- 1.1. United States
- 1.2. Canada
- 1.3. Mexico
-
2. Europe
- 2.1. Germany
- 2.2. United Kingdom
- 2.3. France
- 2.4. Italy
- 2.5. Spain
- 2.6. Rest of Europe
-
3. Asia Pacific
- 3.1. China
- 3.2. Japan
- 3.3. India
- 3.4. Australia
- 3.5. South Korea
- 3.6. Rest of Asia Pacific
-
4. Middle East and Africa
- 4.1. GCC
- 4.2. South Africa
- 4.3. Rest of Middle East and Africa
-
5. South America
- 5.1. Brazil
- 5.2. Argentina
- 5.3. Rest of South America
Short-Read Sequencing Industry REPORT HIGHLIGHTS
| Aspects | Details |
|---|---|
| Study Period | 2019-2033 |
| Base Year | 2024 |
| Estimated Year | 2025 |
| Forecast Period | 2025-2033 |
| Historical Period | 2019-2024 |
| Growth Rate | CAGR of 16.40% from 2019-2033 |
| Segmentation |
|
Table of Contents
- 1. Introduction
- 1.1. Research Scope
- 1.2. Market Segmentation
- 1.3. Research Methodology
- 1.4. Definitions and Assumptions
- 2. Executive Summary
- 2.1. Introduction
- 3. Market Dynamics
- 3.1. Introduction
- 3.2. Market Drivers
- 3.2.1. Rising Demand for Precision Medicine; Continuous Advancements in Genomics Research; Cost-Effectiveness and Efficiency of Short-read Sequencing Technologies
- 3.3. Market Restrains
- 3.3.1. Rising Demand for Precision Medicine; Continuous Advancements in Genomics Research; Cost-Effectiveness and Efficiency of Short-read Sequencing Technologies
- 3.4. Market Trends
- 3.4.1. The Whole Genome Sequencing (WGS) Application Segment is Expected to Have a Significant Share in the Market During the Forecast Period
- 4. Market Factor Analysis
- 4.1. Porters Five Forces
- 4.2. Supply/Value Chain
- 4.3. PESTEL analysis
- 4.4. Market Entropy
- 4.5. Patent/Trademark Analysis
- 5. Global Short-Read Sequencing Industry Analysis, Insights and Forecast, 2019-2031
- 5.1. Market Analysis, Insights and Forecast - by Product and Services
- 5.1.1. Instruments
- 5.1.2. Consumables
- 5.2. Market Analysis, Insights and Forecast - by Platform
- 5.2.1. Sequencing by Synthesis (SBS)
- 5.2.2. Sequencing by Binding (SBB)
- 5.2.3. Sequencing by Ligation (SBL)
- 5.3. Market Analysis, Insights and Forecast - by Application
- 5.3.1. Whole Genome Sequencing (WGS)
- 5.3.2. Whole Exome Sequencing (WES)
- 5.3.3. Other Applications
- 5.4. Market Analysis, Insights and Forecast - by End User
- 5.4.1. Academic and Research Institutes
- 5.4.2. Pharmaceutical and Biotechnology Companies
- 5.4.3. Clinical Research Laboratories
- 5.4.4. Other End Users
- 5.5. Market Analysis, Insights and Forecast - by Region
- 5.5.1. North America
- 5.5.2. Europe
- 5.5.3. Asia Pacific
- 5.5.4. Middle East and Africa
- 5.5.5. South America
- 5.1. Market Analysis, Insights and Forecast - by Product and Services
- 6. North America Short-Read Sequencing Industry Analysis, Insights and Forecast, 2019-2031
- 6.1. Market Analysis, Insights and Forecast - by Product and Services
- 6.1.1. Instruments
- 6.1.2. Consumables
- 6.2. Market Analysis, Insights and Forecast - by Platform
- 6.2.1. Sequencing by Synthesis (SBS)
- 6.2.2. Sequencing by Binding (SBB)
- 6.2.3. Sequencing by Ligation (SBL)
- 6.3. Market Analysis, Insights and Forecast - by Application
- 6.3.1. Whole Genome Sequencing (WGS)
- 6.3.2. Whole Exome Sequencing (WES)
- 6.3.3. Other Applications
- 6.4. Market Analysis, Insights and Forecast - by End User
- 6.4.1. Academic and Research Institutes
- 6.4.2. Pharmaceutical and Biotechnology Companies
- 6.4.3. Clinical Research Laboratories
- 6.4.4. Other End Users
- 6.1. Market Analysis, Insights and Forecast - by Product and Services
- 7. Europe Short-Read Sequencing Industry Analysis, Insights and Forecast, 2019-2031
- 7.1. Market Analysis, Insights and Forecast - by Product and Services
- 7.1.1. Instruments
- 7.1.2. Consumables
- 7.2. Market Analysis, Insights and Forecast - by Platform
- 7.2.1. Sequencing by Synthesis (SBS)
- 7.2.2. Sequencing by Binding (SBB)
- 7.2.3. Sequencing by Ligation (SBL)
- 7.3. Market Analysis, Insights and Forecast - by Application
- 7.3.1. Whole Genome Sequencing (WGS)
- 7.3.2. Whole Exome Sequencing (WES)
- 7.3.3. Other Applications
- 7.4. Market Analysis, Insights and Forecast - by End User
- 7.4.1. Academic and Research Institutes
- 7.4.2. Pharmaceutical and Biotechnology Companies
- 7.4.3. Clinical Research Laboratories
- 7.4.4. Other End Users
- 7.1. Market Analysis, Insights and Forecast - by Product and Services
- 8. Asia Pacific Short-Read Sequencing Industry Analysis, Insights and Forecast, 2019-2031
- 8.1. Market Analysis, Insights and Forecast - by Product and Services
- 8.1.1. Instruments
- 8.1.2. Consumables
- 8.2. Market Analysis, Insights and Forecast - by Platform
- 8.2.1. Sequencing by Synthesis (SBS)
- 8.2.2. Sequencing by Binding (SBB)
- 8.2.3. Sequencing by Ligation (SBL)
- 8.3. Market Analysis, Insights and Forecast - by Application
- 8.3.1. Whole Genome Sequencing (WGS)
- 8.3.2. Whole Exome Sequencing (WES)
- 8.3.3. Other Applications
- 8.4. Market Analysis, Insights and Forecast - by End User
- 8.4.1. Academic and Research Institutes
- 8.4.2. Pharmaceutical and Biotechnology Companies
- 8.4.3. Clinical Research Laboratories
- 8.4.4. Other End Users
- 8.1. Market Analysis, Insights and Forecast - by Product and Services
- 9. Middle East and Africa Short-Read Sequencing Industry Analysis, Insights and Forecast, 2019-2031
- 9.1. Market Analysis, Insights and Forecast - by Product and Services
- 9.1.1. Instruments
- 9.1.2. Consumables
- 9.2. Market Analysis, Insights and Forecast - by Platform
- 9.2.1. Sequencing by Synthesis (SBS)
- 9.2.2. Sequencing by Binding (SBB)
- 9.2.3. Sequencing by Ligation (SBL)
- 9.3. Market Analysis, Insights and Forecast - by Application
- 9.3.1. Whole Genome Sequencing (WGS)
- 9.3.2. Whole Exome Sequencing (WES)
- 9.3.3. Other Applications
- 9.4. Market Analysis, Insights and Forecast - by End User
- 9.4.1. Academic and Research Institutes
- 9.4.2. Pharmaceutical and Biotechnology Companies
- 9.4.3. Clinical Research Laboratories
- 9.4.4. Other End Users
- 9.1. Market Analysis, Insights and Forecast - by Product and Services
- 10. South America Short-Read Sequencing Industry Analysis, Insights and Forecast, 2019-2031
- 10.1. Market Analysis, Insights and Forecast - by Product and Services
- 10.1.1. Instruments
- 10.1.2. Consumables
- 10.2. Market Analysis, Insights and Forecast - by Platform
- 10.2.1. Sequencing by Synthesis (SBS)
- 10.2.2. Sequencing by Binding (SBB)
- 10.2.3. Sequencing by Ligation (SBL)
- 10.3. Market Analysis, Insights and Forecast - by Application
- 10.3.1. Whole Genome Sequencing (WGS)
- 10.3.2. Whole Exome Sequencing (WES)
- 10.3.3. Other Applications
- 10.4. Market Analysis, Insights and Forecast - by End User
- 10.4.1. Academic and Research Institutes
- 10.4.2. Pharmaceutical and Biotechnology Companies
- 10.4.3. Clinical Research Laboratories
- 10.4.4. Other End Users
- 10.1. Market Analysis, Insights and Forecast - by Product and Services
- 11. Competitive Analysis
- 11.1. Global Market Share Analysis 2024
- 11.2. Company Profiles
- 11.2.1 Illumina Inc
- 11.2.1.1. Overview
- 11.2.1.2. Products
- 11.2.1.3. SWOT Analysis
- 11.2.1.4. Recent Developments
- 11.2.1.5. Financials (Based on Availability)
- 11.2.2 Thermo Fisher Scientific Inc
- 11.2.2.1. Overview
- 11.2.2.2. Products
- 11.2.2.3. SWOT Analysis
- 11.2.2.4. Recent Developments
- 11.2.2.5. Financials (Based on Availability)
- 11.2.3 BGI (Beijing Genomics Institute)
- 11.2.3.1. Overview
- 11.2.3.2. Products
- 11.2.3.3. SWOT Analysis
- 11.2.3.4. Recent Developments
- 11.2.3.5. Financials (Based on Availability)
- 11.2.4 Agilent Technologies
- 11.2.4.1. Overview
- 11.2.4.2. Products
- 11.2.4.3. SWOT Analysis
- 11.2.4.4. Recent Developments
- 11.2.4.5. Financials (Based on Availability)
- 11.2.5 QIAGEN
- 11.2.5.1. Overview
- 11.2.5.2. Products
- 11.2.5.3. SWOT Analysis
- 11.2.5.4. Recent Developments
- 11.2.5.5. Financials (Based on Availability)
- 11.2.6 F Hoffmann-La Roche Ltd
- 11.2.6.1. Overview
- 11.2.6.2. Products
- 11.2.6.3. SWOT Analysis
- 11.2.6.4. Recent Developments
- 11.2.6.5. Financials (Based on Availability)
- 11.2.7 Pacific Biosciences (PacBio)
- 11.2.7.1. Overview
- 11.2.7.2. Products
- 11.2.7.3. SWOT Analysis
- 11.2.7.4. Recent Developments
- 11.2.7.5. Financials (Based on Availability)
- 11.2.8 10x Geonomics
- 11.2.8.1. Overview
- 11.2.8.2. Products
- 11.2.8.3. SWOT Analysis
- 11.2.8.4. Recent Developments
- 11.2.8.5. Financials (Based on Availability)
- 11.2.9 Oxford Nanopore Technologies PLC
- 11.2.9.1. Overview
- 11.2.9.2. Products
- 11.2.9.3. SWOT Analysis
- 11.2.9.4. Recent Developments
- 11.2.9.5. Financials (Based on Availability)
- 11.2.10 Macrogen Inc
- 11.2.10.1. Overview
- 11.2.10.2. Products
- 11.2.10.3. SWOT Analysis
- 11.2.10.4. Recent Developments
- 11.2.10.5. Financials (Based on Availability)
- 11.2.11 PerkinElmer Inc *List Not Exhaustive
- 11.2.11.1. Overview
- 11.2.11.2. Products
- 11.2.11.3. SWOT Analysis
- 11.2.11.4. Recent Developments
- 11.2.11.5. Financials (Based on Availability)
- 11.2.1 Illumina Inc
List of Figures
- Figure 1: Global Short-Read Sequencing Industry Revenue Breakdown (Million, %) by Region 2024 & 2032
- Figure 2: Global Short-Read Sequencing Industry Volume Breakdown (Billion, %) by Region 2024 & 2032
- Figure 3: North America Short-Read Sequencing Industry Revenue (Million), by Product and Services 2024 & 2032
- Figure 4: North America Short-Read Sequencing Industry Volume (Billion), by Product and Services 2024 & 2032
- Figure 5: North America Short-Read Sequencing Industry Revenue Share (%), by Product and Services 2024 & 2032
- Figure 6: North America Short-Read Sequencing Industry Volume Share (%), by Product and Services 2024 & 2032
- Figure 7: North America Short-Read Sequencing Industry Revenue (Million), by Platform 2024 & 2032
- Figure 8: North America Short-Read Sequencing Industry Volume (Billion), by Platform 2024 & 2032
- Figure 9: North America Short-Read Sequencing Industry Revenue Share (%), by Platform 2024 & 2032
- Figure 10: North America Short-Read Sequencing Industry Volume Share (%), by Platform 2024 & 2032
- Figure 11: North America Short-Read Sequencing Industry Revenue (Million), by Application 2024 & 2032
- Figure 12: North America Short-Read Sequencing Industry Volume (Billion), by Application 2024 & 2032
- Figure 13: North America Short-Read Sequencing Industry Revenue Share (%), by Application 2024 & 2032
- Figure 14: North America Short-Read Sequencing Industry Volume Share (%), by Application 2024 & 2032
- Figure 15: North America Short-Read Sequencing Industry Revenue (Million), by End User 2024 & 2032
- Figure 16: North America Short-Read Sequencing Industry Volume (Billion), by End User 2024 & 2032
- Figure 17: North America Short-Read Sequencing Industry Revenue Share (%), by End User 2024 & 2032
- Figure 18: North America Short-Read Sequencing Industry Volume Share (%), by End User 2024 & 2032
- Figure 19: North America Short-Read Sequencing Industry Revenue (Million), by Country 2024 & 2032
- Figure 20: North America Short-Read Sequencing Industry Volume (Billion), by Country 2024 & 2032
- Figure 21: North America Short-Read Sequencing Industry Revenue Share (%), by Country 2024 & 2032
- Figure 22: North America Short-Read Sequencing Industry Volume Share (%), by Country 2024 & 2032
- Figure 23: Europe Short-Read Sequencing Industry Revenue (Million), by Product and Services 2024 & 2032
- Figure 24: Europe Short-Read Sequencing Industry Volume (Billion), by Product and Services 2024 & 2032
- Figure 25: Europe Short-Read Sequencing Industry Revenue Share (%), by Product and Services 2024 & 2032
- Figure 26: Europe Short-Read Sequencing Industry Volume Share (%), by Product and Services 2024 & 2032
- Figure 27: Europe Short-Read Sequencing Industry Revenue (Million), by Platform 2024 & 2032
- Figure 28: Europe Short-Read Sequencing Industry Volume (Billion), by Platform 2024 & 2032
- Figure 29: Europe Short-Read Sequencing Industry Revenue Share (%), by Platform 2024 & 2032
- Figure 30: Europe Short-Read Sequencing Industry Volume Share (%), by Platform 2024 & 2032
- Figure 31: Europe Short-Read Sequencing Industry Revenue (Million), by Application 2024 & 2032
- Figure 32: Europe Short-Read Sequencing Industry Volume (Billion), by Application 2024 & 2032
- Figure 33: Europe Short-Read Sequencing Industry Revenue Share (%), by Application 2024 & 2032
- Figure 34: Europe Short-Read Sequencing Industry Volume Share (%), by Application 2024 & 2032
- Figure 35: Europe Short-Read Sequencing Industry Revenue (Million), by End User 2024 & 2032
- Figure 36: Europe Short-Read Sequencing Industry Volume (Billion), by End User 2024 & 2032
- Figure 37: Europe Short-Read Sequencing Industry Revenue Share (%), by End User 2024 & 2032
- Figure 38: Europe Short-Read Sequencing Industry Volume Share (%), by End User 2024 & 2032
- Figure 39: Europe Short-Read Sequencing Industry Revenue (Million), by Country 2024 & 2032
- Figure 40: Europe Short-Read Sequencing Industry Volume (Billion), by Country 2024 & 2032
- Figure 41: Europe Short-Read Sequencing Industry Revenue Share (%), by Country 2024 & 2032
- Figure 42: Europe Short-Read Sequencing Industry Volume Share (%), by Country 2024 & 2032
- Figure 43: Asia Pacific Short-Read Sequencing Industry Revenue (Million), by Product and Services 2024 & 2032
- Figure 44: Asia Pacific Short-Read Sequencing Industry Volume (Billion), by Product and Services 2024 & 2032
- Figure 45: Asia Pacific Short-Read Sequencing Industry Revenue Share (%), by Product and Services 2024 & 2032
- Figure 46: Asia Pacific Short-Read Sequencing Industry Volume Share (%), by Product and Services 2024 & 2032
- Figure 47: Asia Pacific Short-Read Sequencing Industry Revenue (Million), by Platform 2024 & 2032
- Figure 48: Asia Pacific Short-Read Sequencing Industry Volume (Billion), by Platform 2024 & 2032
- Figure 49: Asia Pacific Short-Read Sequencing Industry Revenue Share (%), by Platform 2024 & 2032
- Figure 50: Asia Pacific Short-Read Sequencing Industry Volume Share (%), by Platform 2024 & 2032
- Figure 51: Asia Pacific Short-Read Sequencing Industry Revenue (Million), by Application 2024 & 2032
- Figure 52: Asia Pacific Short-Read Sequencing Industry Volume (Billion), by Application 2024 & 2032
- Figure 53: Asia Pacific Short-Read Sequencing Industry Revenue Share (%), by Application 2024 & 2032
- Figure 54: Asia Pacific Short-Read Sequencing Industry Volume Share (%), by Application 2024 & 2032
- Figure 55: Asia Pacific Short-Read Sequencing Industry Revenue (Million), by End User 2024 & 2032
- Figure 56: Asia Pacific Short-Read Sequencing Industry Volume (Billion), by End User 2024 & 2032
- Figure 57: Asia Pacific Short-Read Sequencing Industry Revenue Share (%), by End User 2024 & 2032
- Figure 58: Asia Pacific Short-Read Sequencing Industry Volume Share (%), by End User 2024 & 2032
- Figure 59: Asia Pacific Short-Read Sequencing Industry Revenue (Million), by Country 2024 & 2032
- Figure 60: Asia Pacific Short-Read Sequencing Industry Volume (Billion), by Country 2024 & 2032
- Figure 61: Asia Pacific Short-Read Sequencing Industry Revenue Share (%), by Country 2024 & 2032
- Figure 62: Asia Pacific Short-Read Sequencing Industry Volume Share (%), by Country 2024 & 2032
- Figure 63: Middle East and Africa Short-Read Sequencing Industry Revenue (Million), by Product and Services 2024 & 2032
- Figure 64: Middle East and Africa Short-Read Sequencing Industry Volume (Billion), by Product and Services 2024 & 2032
- Figure 65: Middle East and Africa Short-Read Sequencing Industry Revenue Share (%), by Product and Services 2024 & 2032
- Figure 66: Middle East and Africa Short-Read Sequencing Industry Volume Share (%), by Product and Services 2024 & 2032
- Figure 67: Middle East and Africa Short-Read Sequencing Industry Revenue (Million), by Platform 2024 & 2032
- Figure 68: Middle East and Africa Short-Read Sequencing Industry Volume (Billion), by Platform 2024 & 2032
- Figure 69: Middle East and Africa Short-Read Sequencing Industry Revenue Share (%), by Platform 2024 & 2032
- Figure 70: Middle East and Africa Short-Read Sequencing Industry Volume Share (%), by Platform 2024 & 2032
- Figure 71: Middle East and Africa Short-Read Sequencing Industry Revenue (Million), by Application 2024 & 2032
- Figure 72: Middle East and Africa Short-Read Sequencing Industry Volume (Billion), by Application 2024 & 2032
- Figure 73: Middle East and Africa Short-Read Sequencing Industry Revenue Share (%), by Application 2024 & 2032
- Figure 74: Middle East and Africa Short-Read Sequencing Industry Volume Share (%), by Application 2024 & 2032
- Figure 75: Middle East and Africa Short-Read Sequencing Industry Revenue (Million), by End User 2024 & 2032
- Figure 76: Middle East and Africa Short-Read Sequencing Industry Volume (Billion), by End User 2024 & 2032
- Figure 77: Middle East and Africa Short-Read Sequencing Industry Revenue Share (%), by End User 2024 & 2032
- Figure 78: Middle East and Africa Short-Read Sequencing Industry Volume Share (%), by End User 2024 & 2032
- Figure 79: Middle East and Africa Short-Read Sequencing Industry Revenue (Million), by Country 2024 & 2032
- Figure 80: Middle East and Africa Short-Read Sequencing Industry Volume (Billion), by Country 2024 & 2032
- Figure 81: Middle East and Africa Short-Read Sequencing Industry Revenue Share (%), by Country 2024 & 2032
- Figure 82: Middle East and Africa Short-Read Sequencing Industry Volume Share (%), by Country 2024 & 2032
- Figure 83: South America Short-Read Sequencing Industry Revenue (Million), by Product and Services 2024 & 2032
- Figure 84: South America Short-Read Sequencing Industry Volume (Billion), by Product and Services 2024 & 2032
- Figure 85: South America Short-Read Sequencing Industry Revenue Share (%), by Product and Services 2024 & 2032
- Figure 86: South America Short-Read Sequencing Industry Volume Share (%), by Product and Services 2024 & 2032
- Figure 87: South America Short-Read Sequencing Industry Revenue (Million), by Platform 2024 & 2032
- Figure 88: South America Short-Read Sequencing Industry Volume (Billion), by Platform 2024 & 2032
- Figure 89: South America Short-Read Sequencing Industry Revenue Share (%), by Platform 2024 & 2032
- Figure 90: South America Short-Read Sequencing Industry Volume Share (%), by Platform 2024 & 2032
- Figure 91: South America Short-Read Sequencing Industry Revenue (Million), by Application 2024 & 2032
- Figure 92: South America Short-Read Sequencing Industry Volume (Billion), by Application 2024 & 2032
- Figure 93: South America Short-Read Sequencing Industry Revenue Share (%), by Application 2024 & 2032
- Figure 94: South America Short-Read Sequencing Industry Volume Share (%), by Application 2024 & 2032
- Figure 95: South America Short-Read Sequencing Industry Revenue (Million), by End User 2024 & 2032
- Figure 96: South America Short-Read Sequencing Industry Volume (Billion), by End User 2024 & 2032
- Figure 97: South America Short-Read Sequencing Industry Revenue Share (%), by End User 2024 & 2032
- Figure 98: South America Short-Read Sequencing Industry Volume Share (%), by End User 2024 & 2032
- Figure 99: South America Short-Read Sequencing Industry Revenue (Million), by Country 2024 & 2032
- Figure 100: South America Short-Read Sequencing Industry Volume (Billion), by Country 2024 & 2032
- Figure 101: South America Short-Read Sequencing Industry Revenue Share (%), by Country 2024 & 2032
- Figure 102: South America Short-Read Sequencing Industry Volume Share (%), by Country 2024 & 2032
List of Tables
- Table 1: Global Short-Read Sequencing Industry Revenue Million Forecast, by Region 2019 & 2032
- Table 2: Global Short-Read Sequencing Industry Volume Billion Forecast, by Region 2019 & 2032
- Table 3: Global Short-Read Sequencing Industry Revenue Million Forecast, by Product and Services 2019 & 2032
- Table 4: Global Short-Read Sequencing Industry Volume Billion Forecast, by Product and Services 2019 & 2032
- Table 5: Global Short-Read Sequencing Industry Revenue Million Forecast, by Platform 2019 & 2032
- Table 6: Global Short-Read Sequencing Industry Volume Billion Forecast, by Platform 2019 & 2032
- Table 7: Global Short-Read Sequencing Industry Revenue Million Forecast, by Application 2019 & 2032
- Table 8: Global Short-Read Sequencing Industry Volume Billion Forecast, by Application 2019 & 2032
- Table 9: Global Short-Read Sequencing Industry Revenue Million Forecast, by End User 2019 & 2032
- Table 10: Global Short-Read Sequencing Industry Volume Billion Forecast, by End User 2019 & 2032
- Table 11: Global Short-Read Sequencing Industry Revenue Million Forecast, by Region 2019 & 2032
- Table 12: Global Short-Read Sequencing Industry Volume Billion Forecast, by Region 2019 & 2032
- Table 13: Global Short-Read Sequencing Industry Revenue Million Forecast, by Product and Services 2019 & 2032
- Table 14: Global Short-Read Sequencing Industry Volume Billion Forecast, by Product and Services 2019 & 2032
- Table 15: Global Short-Read Sequencing Industry Revenue Million Forecast, by Platform 2019 & 2032
- Table 16: Global Short-Read Sequencing Industry Volume Billion Forecast, by Platform 2019 & 2032
- Table 17: Global Short-Read Sequencing Industry Revenue Million Forecast, by Application 2019 & 2032
- Table 18: Global Short-Read Sequencing Industry Volume Billion Forecast, by Application 2019 & 2032
- Table 19: Global Short-Read Sequencing Industry Revenue Million Forecast, by End User 2019 & 2032
- Table 20: Global Short-Read Sequencing Industry Volume Billion Forecast, by End User 2019 & 2032
- Table 21: Global Short-Read Sequencing Industry Revenue Million Forecast, by Country 2019 & 2032
- Table 22: Global Short-Read Sequencing Industry Volume Billion Forecast, by Country 2019 & 2032
- Table 23: United States Short-Read Sequencing Industry Revenue (Million) Forecast, by Application 2019 & 2032
- Table 24: United States Short-Read Sequencing Industry Volume (Billion) Forecast, by Application 2019 & 2032
- Table 25: Canada Short-Read Sequencing Industry Revenue (Million) Forecast, by Application 2019 & 2032
- Table 26: Canada Short-Read Sequencing Industry Volume (Billion) Forecast, by Application 2019 & 2032
- Table 27: Mexico Short-Read Sequencing Industry Revenue (Million) Forecast, by Application 2019 & 2032
- Table 28: Mexico Short-Read Sequencing Industry Volume (Billion) Forecast, by Application 2019 & 2032
- Table 29: Global Short-Read Sequencing Industry Revenue Million Forecast, by Product and Services 2019 & 2032
- Table 30: Global Short-Read Sequencing Industry Volume Billion Forecast, by Product and Services 2019 & 2032
- Table 31: Global Short-Read Sequencing Industry Revenue Million Forecast, by Platform 2019 & 2032
- Table 32: Global Short-Read Sequencing Industry Volume Billion Forecast, by Platform 2019 & 2032
- Table 33: Global Short-Read Sequencing Industry Revenue Million Forecast, by Application 2019 & 2032
- Table 34: Global Short-Read Sequencing Industry Volume Billion Forecast, by Application 2019 & 2032
- Table 35: Global Short-Read Sequencing Industry Revenue Million Forecast, by End User 2019 & 2032
- Table 36: Global Short-Read Sequencing Industry Volume Billion Forecast, by End User 2019 & 2032
- Table 37: Global Short-Read Sequencing Industry Revenue Million Forecast, by Country 2019 & 2032
- Table 38: Global Short-Read Sequencing Industry Volume Billion Forecast, by Country 2019 & 2032
- Table 39: Germany Short-Read Sequencing Industry Revenue (Million) Forecast, by Application 2019 & 2032
- Table 40: Germany Short-Read Sequencing Industry Volume (Billion) Forecast, by Application 2019 & 2032
- Table 41: United Kingdom Short-Read Sequencing Industry Revenue (Million) Forecast, by Application 2019 & 2032
- Table 42: United Kingdom Short-Read Sequencing Industry Volume (Billion) Forecast, by Application 2019 & 2032
- Table 43: France Short-Read Sequencing Industry Revenue (Million) Forecast, by Application 2019 & 2032
- Table 44: France Short-Read Sequencing Industry Volume (Billion) Forecast, by Application 2019 & 2032
- Table 45: Italy Short-Read Sequencing Industry Revenue (Million) Forecast, by Application 2019 & 2032
- Table 46: Italy Short-Read Sequencing Industry Volume (Billion) Forecast, by Application 2019 & 2032
- Table 47: Spain Short-Read Sequencing Industry Revenue (Million) Forecast, by Application 2019 & 2032
- Table 48: Spain Short-Read Sequencing Industry Volume (Billion) Forecast, by Application 2019 & 2032
- Table 49: Rest of Europe Short-Read Sequencing Industry Revenue (Million) Forecast, by Application 2019 & 2032
- Table 50: Rest of Europe Short-Read Sequencing Industry Volume (Billion) Forecast, by Application 2019 & 2032
- Table 51: Global Short-Read Sequencing Industry Revenue Million Forecast, by Product and Services 2019 & 2032
- Table 52: Global Short-Read Sequencing Industry Volume Billion Forecast, by Product and Services 2019 & 2032
- Table 53: Global Short-Read Sequencing Industry Revenue Million Forecast, by Platform 2019 & 2032
- Table 54: Global Short-Read Sequencing Industry Volume Billion Forecast, by Platform 2019 & 2032
- Table 55: Global Short-Read Sequencing Industry Revenue Million Forecast, by Application 2019 & 2032
- Table 56: Global Short-Read Sequencing Industry Volume Billion Forecast, by Application 2019 & 2032
- Table 57: Global Short-Read Sequencing Industry Revenue Million Forecast, by End User 2019 & 2032
- Table 58: Global Short-Read Sequencing Industry Volume Billion Forecast, by End User 2019 & 2032
- Table 59: Global Short-Read Sequencing Industry Revenue Million Forecast, by Country 2019 & 2032
- Table 60: Global Short-Read Sequencing Industry Volume Billion Forecast, by Country 2019 & 2032
- Table 61: China Short-Read Sequencing Industry Revenue (Million) Forecast, by Application 2019 & 2032
- Table 62: China Short-Read Sequencing Industry Volume (Billion) Forecast, by Application 2019 & 2032
- Table 63: Japan Short-Read Sequencing Industry Revenue (Million) Forecast, by Application 2019 & 2032
- Table 64: Japan Short-Read Sequencing Industry Volume (Billion) Forecast, by Application 2019 & 2032
- Table 65: India Short-Read Sequencing Industry Revenue (Million) Forecast, by Application 2019 & 2032
- Table 66: India Short-Read Sequencing Industry Volume (Billion) Forecast, by Application 2019 & 2032
- Table 67: Australia Short-Read Sequencing Industry Revenue (Million) Forecast, by Application 2019 & 2032
- Table 68: Australia Short-Read Sequencing Industry Volume (Billion) Forecast, by Application 2019 & 2032
- Table 69: South Korea Short-Read Sequencing Industry Revenue (Million) Forecast, by Application 2019 & 2032
- Table 70: South Korea Short-Read Sequencing Industry Volume (Billion) Forecast, by Application 2019 & 2032
- Table 71: Rest of Asia Pacific Short-Read Sequencing Industry Revenue (Million) Forecast, by Application 2019 & 2032
- Table 72: Rest of Asia Pacific Short-Read Sequencing Industry Volume (Billion) Forecast, by Application 2019 & 2032
- Table 73: Global Short-Read Sequencing Industry Revenue Million Forecast, by Product and Services 2019 & 2032
- Table 74: Global Short-Read Sequencing Industry Volume Billion Forecast, by Product and Services 2019 & 2032
- Table 75: Global Short-Read Sequencing Industry Revenue Million Forecast, by Platform 2019 & 2032
- Table 76: Global Short-Read Sequencing Industry Volume Billion Forecast, by Platform 2019 & 2032
- Table 77: Global Short-Read Sequencing Industry Revenue Million Forecast, by Application 2019 & 2032
- Table 78: Global Short-Read Sequencing Industry Volume Billion Forecast, by Application 2019 & 2032
- Table 79: Global Short-Read Sequencing Industry Revenue Million Forecast, by End User 2019 & 2032
- Table 80: Global Short-Read Sequencing Industry Volume Billion Forecast, by End User 2019 & 2032
- Table 81: Global Short-Read Sequencing Industry Revenue Million Forecast, by Country 2019 & 2032
- Table 82: Global Short-Read Sequencing Industry Volume Billion Forecast, by Country 2019 & 2032
- Table 83: GCC Short-Read Sequencing Industry Revenue (Million) Forecast, by Application 2019 & 2032
- Table 84: GCC Short-Read Sequencing Industry Volume (Billion) Forecast, by Application 2019 & 2032
- Table 85: South Africa Short-Read Sequencing Industry Revenue (Million) Forecast, by Application 2019 & 2032
- Table 86: South Africa Short-Read Sequencing Industry Volume (Billion) Forecast, by Application 2019 & 2032
- Table 87: Rest of Middle East and Africa Short-Read Sequencing Industry Revenue (Million) Forecast, by Application 2019 & 2032
- Table 88: Rest of Middle East and Africa Short-Read Sequencing Industry Volume (Billion) Forecast, by Application 2019 & 2032
- Table 89: Global Short-Read Sequencing Industry Revenue Million Forecast, by Product and Services 2019 & 2032
- Table 90: Global Short-Read Sequencing Industry Volume Billion Forecast, by Product and Services 2019 & 2032
- Table 91: Global Short-Read Sequencing Industry Revenue Million Forecast, by Platform 2019 & 2032
- Table 92: Global Short-Read Sequencing Industry Volume Billion Forecast, by Platform 2019 & 2032
- Table 93: Global Short-Read Sequencing Industry Revenue Million Forecast, by Application 2019 & 2032
- Table 94: Global Short-Read Sequencing Industry Volume Billion Forecast, by Application 2019 & 2032
- Table 95: Global Short-Read Sequencing Industry Revenue Million Forecast, by End User 2019 & 2032
- Table 96: Global Short-Read Sequencing Industry Volume Billion Forecast, by End User 2019 & 2032
- Table 97: Global Short-Read Sequencing Industry Revenue Million Forecast, by Country 2019 & 2032
- Table 98: Global Short-Read Sequencing Industry Volume Billion Forecast, by Country 2019 & 2032
- Table 99: Brazil Short-Read Sequencing Industry Revenue (Million) Forecast, by Application 2019 & 2032
- Table 100: Brazil Short-Read Sequencing Industry Volume (Billion) Forecast, by Application 2019 & 2032
- Table 101: Argentina Short-Read Sequencing Industry Revenue (Million) Forecast, by Application 2019 & 2032
- Table 102: Argentina Short-Read Sequencing Industry Volume (Billion) Forecast, by Application 2019 & 2032
- Table 103: Rest of South America Short-Read Sequencing Industry Revenue (Million) Forecast, by Application 2019 & 2032
- Table 104: Rest of South America Short-Read Sequencing Industry Volume (Billion) Forecast, by Application 2019 & 2032
Frequently Asked Questions
1. What is the projected Compound Annual Growth Rate (CAGR) of the Short-Read Sequencing Industry?
The projected CAGR is approximately 16.40%.
2. Which companies are prominent players in the Short-Read Sequencing Industry?
Key companies in the market include Illumina Inc, Thermo Fisher Scientific Inc, BGI (Beijing Genomics Institute), Agilent Technologies, QIAGEN, F Hoffmann-La Roche Ltd, Pacific Biosciences (PacBio), 10x Geonomics, Oxford Nanopore Technologies PLC, Macrogen Inc, PerkinElmer Inc *List Not Exhaustive.
3. What are the main segments of the Short-Read Sequencing Industry?
The market segments include Product and Services, Platform, Application, End User.
4. Can you provide details about the market size?
The market size is estimated to be USD 7.90 Million as of 2022.
5. What are some drivers contributing to market growth?
Rising Demand for Precision Medicine; Continuous Advancements in Genomics Research; Cost-Effectiveness and Efficiency of Short-read Sequencing Technologies.
6. What are the notable trends driving market growth?
The Whole Genome Sequencing (WGS) Application Segment is Expected to Have a Significant Share in the Market During the Forecast Period.
7. Are there any restraints impacting market growth?
Rising Demand for Precision Medicine; Continuous Advancements in Genomics Research; Cost-Effectiveness and Efficiency of Short-read Sequencing Technologies.
8. Can you provide examples of recent developments in the market?
December 2023: Firalis Molecular Precision, a contract research organization (CRO), significantly bolstered its genomics capabilities by acquiring the cutting-edge Illumina NovaSeq X Plus Sequencing System. This system offers dual flow cell sequencing, enabling refinement and scaling-up of short-read sequencing technology.
9. What pricing options are available for accessing the report?
Pricing options include single-user, multi-user, and enterprise licenses priced at USD 4750, USD 5250, and USD 8750 respectively.
10. Is the market size provided in terms of value or volume?
The market size is provided in terms of value, measured in Million and volume, measured in Billion.
11. Are there any specific market keywords associated with the report?
Yes, the market keyword associated with the report is "Short-Read Sequencing Industry," which aids in identifying and referencing the specific market segment covered.
12. How do I determine which pricing option suits my needs best?
The pricing options vary based on user requirements and access needs. Individual users may opt for single-user licenses, while businesses requiring broader access may choose multi-user or enterprise licenses for cost-effective access to the report.
13. Are there any additional resources or data provided in the Short-Read Sequencing Industry report?
While the report offers comprehensive insights, it's advisable to review the specific contents or supplementary materials provided to ascertain if additional resources or data are available.
14. How can I stay updated on further developments or reports in the Short-Read Sequencing Industry?
To stay informed about further developments, trends, and reports in the Short-Read Sequencing Industry, consider subscribing to industry newsletters, following relevant companies and organizations, or regularly checking reputable industry news sources and publications.
Methodology
Step 1 - Identification of Relevant Samples Size from Population Database


Step 2 - Approaches for Defining Global Market Size (Value, Volume* & Price*)

Note*: In applicable scenarios
Step 3 - Data Sources
Primary Research
- Web Analytics
- Survey Reports
- Research Institute
- Latest Research Reports
- Opinion Leaders
Secondary Research
- Annual Reports
- White Paper
- Latest Press Release
- Industry Association
- Paid Database
- Investor Presentations

Step 4 - Data Triangulation
Involves using different sources of information in order to increase the validity of a study
These sources are likely to be stakeholders in a program - participants, other researchers, program staff, other community members, and so on.
Then we put all data in single framework & apply various statistical tools to find out the dynamic on the market.
During the analysis stage, feedback from the stakeholder groups would be compared to determine areas of agreement as well as areas of divergence


