Shale Oil Industry Market’s Technological Evolution: Trends and Analysis 2025-2033

Shale Oil Industry by Production Analysis, by Consumption Analysis, by Import Market Analysis (Value & Volume), by Export Market Analysis (Value & Volume), by Price Trend Analysis, by North America, by South America, by Europe, by Asia Pacific, by Middle East and Africa Forecast 2025-2033

Jun 26 2025
Base Year: 2024

234 Pages
Main Logo

Shale Oil Industry Market’s Technological Evolution: Trends and Analysis 2025-2033


Home
Industries
Energy & Power
sponsor image
sponsor image
sponsor image
sponsor image
sponsor image

Tailored for you

  • In-depth Analysis Tailored to Specified Regions or Segments
  • Company Profiles Customized to User Preferences
  • Comprehensive Insights Focused on Specific Segments or Regions
  • Customized Evaluation of Competitive Landscape to Meet Your Needs
  • Tailored Customization to Address Other Specific Requirements
Ask for customization


Key Insights

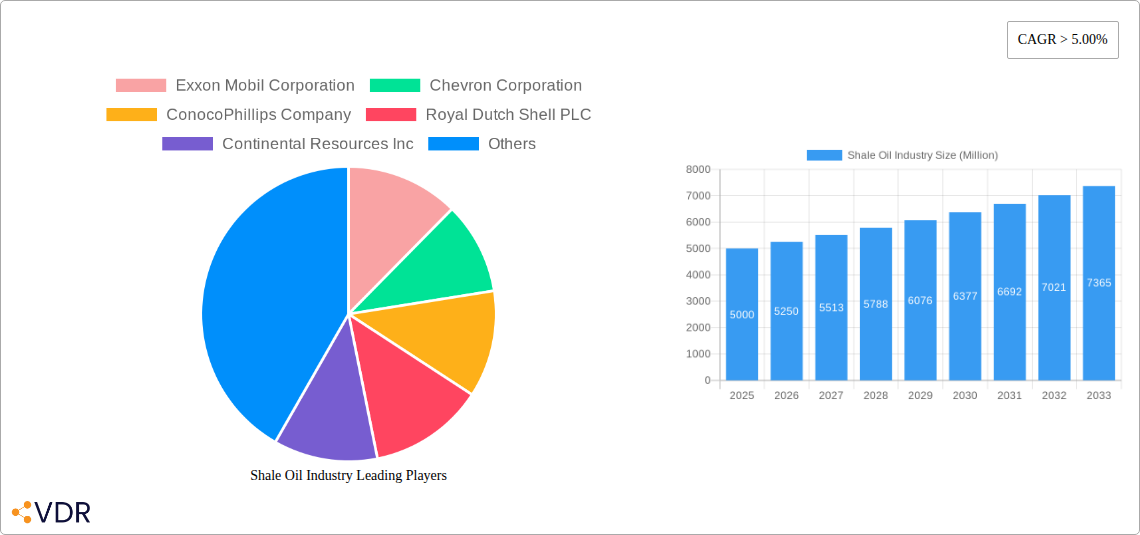
The shale oil industry, characterized by its unconventional extraction methods, is experiencing robust growth, projected to maintain a Compound Annual Growth Rate (CAGR) exceeding 5% from 2025 to 2033. This expansion is fueled by several key drivers. Increased global energy demand, particularly from developing economies, necessitates a continuous supply of crude oil, making shale oil a critical component of the energy mix. Technological advancements in horizontal drilling and hydraulic fracturing have significantly reduced extraction costs and improved efficiency, further stimulating production. Furthermore, favorable government policies in key regions, aimed at boosting domestic energy production and reducing reliance on foreign oil, are contributing to the industry's growth. However, challenges remain. Fluctuating oil prices represent a significant risk, impacting profitability and investment decisions. Environmental concerns surrounding water usage, greenhouse gas emissions, and potential seismic activity associated with hydraulic fracturing continue to generate public scrutiny and regulatory hurdles. The industry is also facing increasing pressure to adopt sustainable practices and mitigate its environmental footprint. Competition among established players and new entrants also keeps margins under pressure.

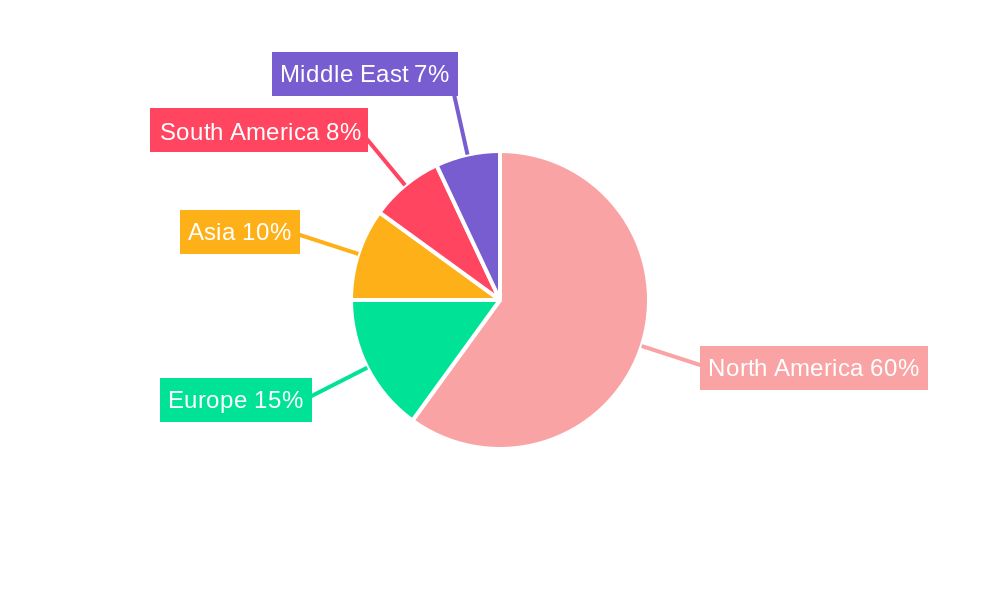
Market segmentation reveals a diverse landscape, with North America dominating the market share due to its established infrastructure and vast shale reserves. However, other regions, particularly parts of Europe, South America, and the Middle East, are witnessing emerging shale oil production, presenting significant growth opportunities. Major players, including ExxonMobil, Chevron, ConocoPhillips, and Shell, are strategically investing in shale oil operations, leveraging their technological expertise and financial resources to secure market dominance. While the list of companies is not exhaustive, these dominant players significantly shape market dynamics. The forecast period (2025-2033) will witness intense competition and a continuous push for technological innovation, efficiency gains, and environmentally responsible practices to ensure sustainable growth in the face of increasing global scrutiny. The industry's success will hinge on its ability to balance economic growth with environmental stewardship and responsible resource management.

Shale Oil Industry Research Report - Market Size, Growth & Forecast

Shale Oil Industry Market Report: 2019-2033

This comprehensive report provides a detailed analysis of the global shale oil industry, encompassing market dynamics, growth trends, regional dominance, product landscape, key players, and future outlook. The study period covers 2019-2033, with 2025 as the base and estimated year. This report is essential for industry professionals, investors, and anyone seeking a deep understanding of this dynamic sector. The parent market is the Oil and Gas industry, with Shale Oil being a key child market.

Shale Oil Industry Market Dynamics & Structure

This section analyzes the competitive landscape of the shale oil industry, examining market concentration, technological advancements, regulatory influences, and market dynamics. The report delves into the impact of mergers and acquisitions (M&A) activities, evaluating their effects on market share and competitive positioning.

  • Market Concentration: The market is characterized by a moderately concentrated structure, with a few major players holding significant market share. ExxonMobil, Chevron, and ConocoPhillips collectively account for approximately xx% of global shale oil production (2024 data). Smaller independent players like Continental Resources and Murphy Oil also contribute significantly.
  • Technological Innovation: Continuous innovation in hydraulic fracturing, horizontal drilling, and data analytics drives efficiency gains and reduces production costs. However, barriers to entry remain significant due to high capital investment needs.
  • Regulatory Frameworks: Government regulations, particularly concerning environmental protection and emission standards, significantly impact operational costs and profitability. Variations in regulatory frameworks across different regions create diverse market conditions.
  • Competitive Product Substitutes: Renewable energy sources and other fossil fuels pose competitive threats, depending on pricing and environmental policies.
  • M&A Trends: The last five years witnessed xx M&A deals in the shale oil sector, primarily focused on consolidation and resource acquisition, impacting market concentration and competition.

Shale Oil Industry Growth Trends & Insights

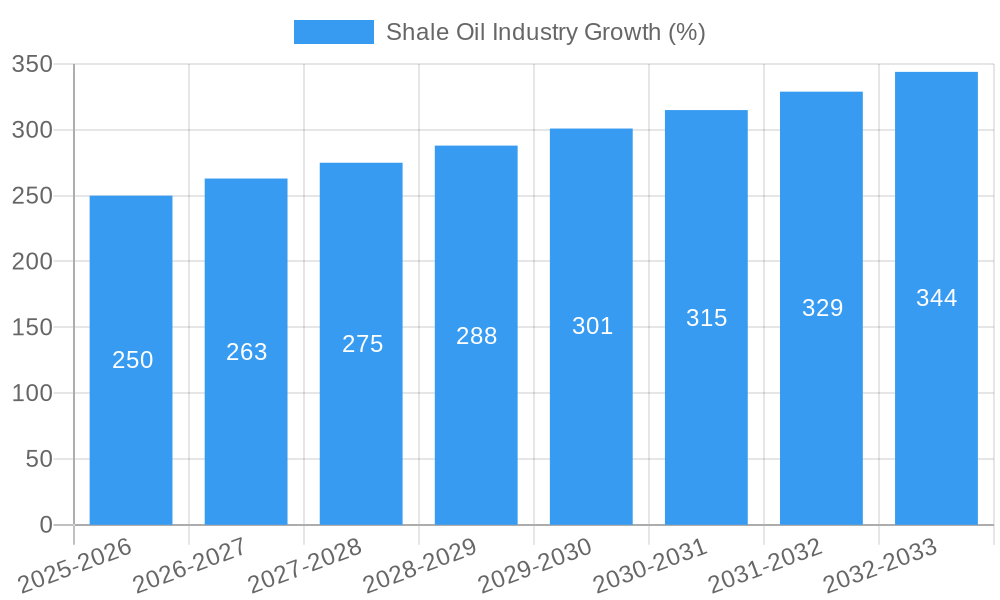
This section provides a comprehensive analysis of the shale oil industry's historical growth trajectory and its projected expansion. Data presented includes Compound Annual Growth Rate (CAGR) figures and market penetration insights. We consider factors such as technological advancements, evolving consumer preferences and global economic shifts. Our analysis projects a CAGR of xx% for the forecast period (2025-2033), driven by increasing global energy demand and ongoing technological improvements. Market size is projected to reach xx million units by 2033, up from xx million units in 2024. Specific factors affecting adoption rates and market penetration will be detailed within the full report.

Shale Oil Industry Growth

Dominant Regions, Countries, or Segments in Shale Oil Industry

This section identifies the leading regions and countries driving shale oil market growth. The analysis considers economic policies, infrastructure development, and resource availability. The United States continues to be the dominant player, accounting for approximately xx% of global shale oil production in 2024, mainly attributed to the Permian and Bakken basins. However, growth is anticipated in other regions like Canada, Argentina, and parts of the Middle East and Asia as technological advancements reduce production costs and unlock previously inaccessible reserves.

  • Key Drivers:
    • Favorable Government Policies: Supportive regulatory frameworks in certain regions encourage investment and exploration.
    • Robust Infrastructure: Efficient infrastructure for transportation and processing of shale oil contributes to cost-effectiveness.
    • Abundant Resources: Significant shale oil reserves in specific geographical areas drive production growth.

Shale Oil Industry Product Landscape

This section examines the product innovations, applications and performance metrics, highlighting unique selling propositions and advancements in shale oil extraction and processing technologies. The focus is on enhancing efficiency, minimizing environmental impact, and maximizing production yields. Recent advancements include improved drilling techniques, enhanced fracturing fluids, and sophisticated data analytics for real-time optimization of extraction processes.

Key Drivers, Barriers & Challenges in Shale Oil Industry

Key Drivers:

  • Technological advancements in extraction techniques.
  • Rising global energy demand.
  • Favorable government policies in certain regions.

Key Challenges:

  • Volatile oil prices and their impact on investment decisions.
  • Environmental concerns and regulations.
  • Water scarcity and its effect on hydraulic fracturing.
  • Supply chain disruptions influencing production costs.

Emerging Opportunities in Shale Oil Industry

Emerging opportunities lie in several areas, including the exploration of untapped reserves in under-developed regions, the development of more environmentally-friendly extraction techniques and the application of AI and machine learning for enhanced efficiency and reduced operating costs. There is also potential for growth through strategic partnerships and joint ventures which will allow for greater access to capital and resources.

Growth Accelerators in the Shale Oil Industry Industry

Technological breakthroughs in horizontal drilling and hydraulic fracturing continue to fuel growth. Strategic partnerships and mergers and acquisitions are streamlining operations and expanding market reach, particularly for companies seeking greater access to resources or enhancing technological capabilities. The expansion into new geographical regions with significant shale reserves further accelerates industry growth.

Key Players Shaping the Shale Oil Industry Market

  • Exxon Mobil Corporation
  • Chevron Corporation
  • ConocoPhillips Company
  • Royal Dutch Shell PLC
  • Continental Resources Inc
  • Murphy Oil Corporation
  • Occidental Petroleum Corporation
  • Marathon Oil Corporation
  • Schlumberger Limited
  • Halliburton Company

Notable Milestones in Shale Oil Industry Sector

  • July 2022: Oilex and Schlumberger secure a contract for hydraulic fracturing services in Gujarat, India.
  • April 2022: CNX Resources Corporation and Evolution Well Services extend their contract for electric fracturing technology.

In-Depth Shale Oil Industry Market Outlook

The shale oil industry is poised for continued growth, driven by technological advancements, strategic partnerships, and expansion into new markets. The industry's future success hinges on addressing environmental concerns and ensuring responsible resource management to maintain long-term sustainability and market acceptance. The anticipated increase in global energy demand will remain a key driver of growth, coupled with further reductions in production costs.

Shale Oil Industry Segmentation

  • 1. Production Analysis
  • 2. Consumption Analysis
  • 3. Import Market Analysis (Value & Volume)
  • 4. Export Market Analysis (Value & Volume)
  • 5. Price Trend Analysis

Shale Oil Industry Segmentation By Geography

  • 1. North America
  • 2. South America
  • 3. Europe
  • 4. Asia Pacific
  • 5. Middle East and Africa
Shale Oil Industry Regional Share


Shale Oil Industry REPORT HIGHLIGHTS

AspectsDetails
Study Period 2019-2033
Base Year 2024
Estimated Year 2025
Forecast Period2025-2033
Historical Period2019-2024
Growth RateCAGR of > 5.00% from 2019-2033
Segmentation
    • By Production Analysis
    • By Consumption Analysis
    • By Import Market Analysis (Value & Volume)
    • By Export Market Analysis (Value & Volume)
    • By Price Trend Analysis
  • By Geography
    • North America
    • South America
    • Europe
    • Asia Pacific
    • Middle East and Africa


Table of Contents

  1. 1. Introduction
    • 1.1. Research Scope
    • 1.2. Market Segmentation
    • 1.3. Research Methodology
    • 1.4. Definitions and Assumptions
  2. 2. Executive Summary
    • 2.1. Introduction
  3. 3. Market Dynamics
    • 3.1. Introduction
      • 3.2. Market Drivers
      • 3.3. Market Restrains
      • 3.4. Market Trends
        • 3.4.1. Growing Petrochemical Industry to Drive the Market
  4. 4. Market Factor Analysis
    • 4.1. Porters Five Forces
    • 4.2. Supply/Value Chain
    • 4.3. PESTEL analysis
    • 4.4. Market Entropy
    • 4.5. Patent/Trademark Analysis
  5. 5. Global Shale Oil Industry Analysis, Insights and Forecast, 2019-2031
    • 5.1. Market Analysis, Insights and Forecast - by Production Analysis
      • 5.2. Market Analysis, Insights and Forecast - by Consumption Analysis
        • 5.3. Market Analysis, Insights and Forecast - by Import Market Analysis (Value & Volume)
          • 5.4. Market Analysis, Insights and Forecast - by Export Market Analysis (Value & Volume)
            • 5.5. Market Analysis, Insights and Forecast - by Price Trend Analysis
              • 5.6. Market Analysis, Insights and Forecast - by Region
                • 5.6.1. North America
                • 5.6.2. South America
                • 5.6.3. Europe
                • 5.6.4. Asia Pacific
                • 5.6.5. Middle East and Africa
            • 6. North America Shale Oil Industry Analysis, Insights and Forecast, 2019-2031
              • 6.1. Market Analysis, Insights and Forecast - by Production Analysis
                • 6.2. Market Analysis, Insights and Forecast - by Consumption Analysis
                  • 6.3. Market Analysis, Insights and Forecast - by Import Market Analysis (Value & Volume)
                    • 6.4. Market Analysis, Insights and Forecast - by Export Market Analysis (Value & Volume)
                      • 6.5. Market Analysis, Insights and Forecast - by Price Trend Analysis
                      • 7. South America Shale Oil Industry Analysis, Insights and Forecast, 2019-2031
                        • 7.1. Market Analysis, Insights and Forecast - by Production Analysis
                          • 7.2. Market Analysis, Insights and Forecast - by Consumption Analysis
                            • 7.3. Market Analysis, Insights and Forecast - by Import Market Analysis (Value & Volume)
                              • 7.4. Market Analysis, Insights and Forecast - by Export Market Analysis (Value & Volume)
                                • 7.5. Market Analysis, Insights and Forecast - by Price Trend Analysis
                                • 8. Europe Shale Oil Industry Analysis, Insights and Forecast, 2019-2031
                                  • 8.1. Market Analysis, Insights and Forecast - by Production Analysis
                                    • 8.2. Market Analysis, Insights and Forecast - by Consumption Analysis
                                      • 8.3. Market Analysis, Insights and Forecast - by Import Market Analysis (Value & Volume)
                                        • 8.4. Market Analysis, Insights and Forecast - by Export Market Analysis (Value & Volume)
                                          • 8.5. Market Analysis, Insights and Forecast - by Price Trend Analysis
                                          • 9. Asia Pacific Shale Oil Industry Analysis, Insights and Forecast, 2019-2031
                                            • 9.1. Market Analysis, Insights and Forecast - by Production Analysis
                                              • 9.2. Market Analysis, Insights and Forecast - by Consumption Analysis
                                                • 9.3. Market Analysis, Insights and Forecast - by Import Market Analysis (Value & Volume)
                                                  • 9.4. Market Analysis, Insights and Forecast - by Export Market Analysis (Value & Volume)
                                                    • 9.5. Market Analysis, Insights and Forecast - by Price Trend Analysis
                                                    • 10. Middle East and Africa Shale Oil Industry Analysis, Insights and Forecast, 2019-2031
                                                      • 10.1. Market Analysis, Insights and Forecast - by Production Analysis
                                                        • 10.2. Market Analysis, Insights and Forecast - by Consumption Analysis
                                                          • 10.3. Market Analysis, Insights and Forecast - by Import Market Analysis (Value & Volume)
                                                            • 10.4. Market Analysis, Insights and Forecast - by Export Market Analysis (Value & Volume)
                                                              • 10.5. Market Analysis, Insights and Forecast - by Price Trend Analysis
                                                              • 11. Competitive Analysis
                                                                • 11.1. Global Market Share Analysis 2024
                                                                  • 11.2. Company Profiles
                                                                    • 11.2.1 Exxon Mobil Corporation
                                                                      • 11.2.1.1. Overview
                                                                      • 11.2.1.2. Products
                                                                      • 11.2.1.3. SWOT Analysis
                                                                      • 11.2.1.4. Recent Developments
                                                                      • 11.2.1.5. Financials (Based on Availability)
                                                                    • 11.2.2 Chevron Corporation
                                                                      • 11.2.2.1. Overview
                                                                      • 11.2.2.2. Products
                                                                      • 11.2.2.3. SWOT Analysis
                                                                      • 11.2.2.4. Recent Developments
                                                                      • 11.2.2.5. Financials (Based on Availability)
                                                                    • 11.2.3 ConocoPhillips Company
                                                                      • 11.2.3.1. Overview
                                                                      • 11.2.3.2. Products
                                                                      • 11.2.3.3. SWOT Analysis
                                                                      • 11.2.3.4. Recent Developments
                                                                      • 11.2.3.5. Financials (Based on Availability)
                                                                    • 11.2.4 Royal Dutch Shell PLC
                                                                      • 11.2.4.1. Overview
                                                                      • 11.2.4.2. Products
                                                                      • 11.2.4.3. SWOT Analysis
                                                                      • 11.2.4.4. Recent Developments
                                                                      • 11.2.4.5. Financials (Based on Availability)
                                                                    • 11.2.5 Continental Resources Inc
                                                                      • 11.2.5.1. Overview
                                                                      • 11.2.5.2. Products
                                                                      • 11.2.5.3. SWOT Analysis
                                                                      • 11.2.5.4. Recent Developments
                                                                      • 11.2.5.5. Financials (Based on Availability)
                                                                    • 11.2.6 Murphy Oil Corporation
                                                                      • 11.2.6.1. Overview
                                                                      • 11.2.6.2. Products
                                                                      • 11.2.6.3. SWOT Analysis
                                                                      • 11.2.6.4. Recent Developments
                                                                      • 11.2.6.5. Financials (Based on Availability)
                                                                    • 11.2.7 Occidental Petroleum Corporation
                                                                      • 11.2.7.1. Overview
                                                                      • 11.2.7.2. Products
                                                                      • 11.2.7.3. SWOT Analysis
                                                                      • 11.2.7.4. Recent Developments
                                                                      • 11.2.7.5. Financials (Based on Availability)
                                                                    • 11.2.8 Marathon Oil Corporation
                                                                      • 11.2.8.1. Overview
                                                                      • 11.2.8.2. Products
                                                                      • 11.2.8.3. SWOT Analysis
                                                                      • 11.2.8.4. Recent Developments
                                                                      • 11.2.8.5. Financials (Based on Availability)
                                                                    • 11.2.9 Schlumberger Limited
                                                                      • 11.2.9.1. Overview
                                                                      • 11.2.9.2. Products
                                                                      • 11.2.9.3. SWOT Analysis
                                                                      • 11.2.9.4. Recent Developments
                                                                      • 11.2.9.5. Financials (Based on Availability)
                                                                    • 11.2.10 Halliburton Company*List Not Exhaustive
                                                                      • 11.2.10.1. Overview
                                                                      • 11.2.10.2. Products
                                                                      • 11.2.10.3. SWOT Analysis
                                                                      • 11.2.10.4. Recent Developments
                                                                      • 11.2.10.5. Financials (Based on Availability)

                                                              List of Figures

                                                              1. Figure 1: Global Shale Oil Industry Revenue Breakdown (Million, %) by Region 2024 & 2032
                                                              2. Figure 2: North America Shale Oil Industry Revenue (Million), by Production Analysis 2024 & 2032
                                                              3. Figure 3: North America Shale Oil Industry Revenue Share (%), by Production Analysis 2024 & 2032
                                                              4. Figure 4: North America Shale Oil Industry Revenue (Million), by Consumption Analysis 2024 & 2032
                                                              5. Figure 5: North America Shale Oil Industry Revenue Share (%), by Consumption Analysis 2024 & 2032
                                                              6. Figure 6: North America Shale Oil Industry Revenue (Million), by Import Market Analysis (Value & Volume) 2024 & 2032
                                                              7. Figure 7: North America Shale Oil Industry Revenue Share (%), by Import Market Analysis (Value & Volume) 2024 & 2032
                                                              8. Figure 8: North America Shale Oil Industry Revenue (Million), by Export Market Analysis (Value & Volume) 2024 & 2032
                                                              9. Figure 9: North America Shale Oil Industry Revenue Share (%), by Export Market Analysis (Value & Volume) 2024 & 2032
                                                              10. Figure 10: North America Shale Oil Industry Revenue (Million), by Price Trend Analysis 2024 & 2032
                                                              11. Figure 11: North America Shale Oil Industry Revenue Share (%), by Price Trend Analysis 2024 & 2032
                                                              12. Figure 12: North America Shale Oil Industry Revenue (Million), by Country 2024 & 2032
                                                              13. Figure 13: North America Shale Oil Industry Revenue Share (%), by Country 2024 & 2032
                                                              14. Figure 14: South America Shale Oil Industry Revenue (Million), by Production Analysis 2024 & 2032
                                                              15. Figure 15: South America Shale Oil Industry Revenue Share (%), by Production Analysis 2024 & 2032
                                                              16. Figure 16: South America Shale Oil Industry Revenue (Million), by Consumption Analysis 2024 & 2032
                                                              17. Figure 17: South America Shale Oil Industry Revenue Share (%), by Consumption Analysis 2024 & 2032
                                                              18. Figure 18: South America Shale Oil Industry Revenue (Million), by Import Market Analysis (Value & Volume) 2024 & 2032
                                                              19. Figure 19: South America Shale Oil Industry Revenue Share (%), by Import Market Analysis (Value & Volume) 2024 & 2032
                                                              20. Figure 20: South America Shale Oil Industry Revenue (Million), by Export Market Analysis (Value & Volume) 2024 & 2032
                                                              21. Figure 21: South America Shale Oil Industry Revenue Share (%), by Export Market Analysis (Value & Volume) 2024 & 2032
                                                              22. Figure 22: South America Shale Oil Industry Revenue (Million), by Price Trend Analysis 2024 & 2032
                                                              23. Figure 23: South America Shale Oil Industry Revenue Share (%), by Price Trend Analysis 2024 & 2032
                                                              24. Figure 24: South America Shale Oil Industry Revenue (Million), by Country 2024 & 2032
                                                              25. Figure 25: South America Shale Oil Industry Revenue Share (%), by Country 2024 & 2032
                                                              26. Figure 26: Europe Shale Oil Industry Revenue (Million), by Production Analysis 2024 & 2032
                                                              27. Figure 27: Europe Shale Oil Industry Revenue Share (%), by Production Analysis 2024 & 2032
                                                              28. Figure 28: Europe Shale Oil Industry Revenue (Million), by Consumption Analysis 2024 & 2032
                                                              29. Figure 29: Europe Shale Oil Industry Revenue Share (%), by Consumption Analysis 2024 & 2032
                                                              30. Figure 30: Europe Shale Oil Industry Revenue (Million), by Import Market Analysis (Value & Volume) 2024 & 2032
                                                              31. Figure 31: Europe Shale Oil Industry Revenue Share (%), by Import Market Analysis (Value & Volume) 2024 & 2032
                                                              32. Figure 32: Europe Shale Oil Industry Revenue (Million), by Export Market Analysis (Value & Volume) 2024 & 2032
                                                              33. Figure 33: Europe Shale Oil Industry Revenue Share (%), by Export Market Analysis (Value & Volume) 2024 & 2032
                                                              34. Figure 34: Europe Shale Oil Industry Revenue (Million), by Price Trend Analysis 2024 & 2032
                                                              35. Figure 35: Europe Shale Oil Industry Revenue Share (%), by Price Trend Analysis 2024 & 2032
                                                              36. Figure 36: Europe Shale Oil Industry Revenue (Million), by Country 2024 & 2032
                                                              37. Figure 37: Europe Shale Oil Industry Revenue Share (%), by Country 2024 & 2032
                                                              38. Figure 38: Asia Pacific Shale Oil Industry Revenue (Million), by Production Analysis 2024 & 2032
                                                              39. Figure 39: Asia Pacific Shale Oil Industry Revenue Share (%), by Production Analysis 2024 & 2032
                                                              40. Figure 40: Asia Pacific Shale Oil Industry Revenue (Million), by Consumption Analysis 2024 & 2032
                                                              41. Figure 41: Asia Pacific Shale Oil Industry Revenue Share (%), by Consumption Analysis 2024 & 2032
                                                              42. Figure 42: Asia Pacific Shale Oil Industry Revenue (Million), by Import Market Analysis (Value & Volume) 2024 & 2032
                                                              43. Figure 43: Asia Pacific Shale Oil Industry Revenue Share (%), by Import Market Analysis (Value & Volume) 2024 & 2032
                                                              44. Figure 44: Asia Pacific Shale Oil Industry Revenue (Million), by Export Market Analysis (Value & Volume) 2024 & 2032
                                                              45. Figure 45: Asia Pacific Shale Oil Industry Revenue Share (%), by Export Market Analysis (Value & Volume) 2024 & 2032
                                                              46. Figure 46: Asia Pacific Shale Oil Industry Revenue (Million), by Price Trend Analysis 2024 & 2032
                                                              47. Figure 47: Asia Pacific Shale Oil Industry Revenue Share (%), by Price Trend Analysis 2024 & 2032
                                                              48. Figure 48: Asia Pacific Shale Oil Industry Revenue (Million), by Country 2024 & 2032
                                                              49. Figure 49: Asia Pacific Shale Oil Industry Revenue Share (%), by Country 2024 & 2032
                                                              50. Figure 50: Middle East and Africa Shale Oil Industry Revenue (Million), by Production Analysis 2024 & 2032
                                                              51. Figure 51: Middle East and Africa Shale Oil Industry Revenue Share (%), by Production Analysis 2024 & 2032
                                                              52. Figure 52: Middle East and Africa Shale Oil Industry Revenue (Million), by Consumption Analysis 2024 & 2032
                                                              53. Figure 53: Middle East and Africa Shale Oil Industry Revenue Share (%), by Consumption Analysis 2024 & 2032
                                                              54. Figure 54: Middle East and Africa Shale Oil Industry Revenue (Million), by Import Market Analysis (Value & Volume) 2024 & 2032
                                                              55. Figure 55: Middle East and Africa Shale Oil Industry Revenue Share (%), by Import Market Analysis (Value & Volume) 2024 & 2032
                                                              56. Figure 56: Middle East and Africa Shale Oil Industry Revenue (Million), by Export Market Analysis (Value & Volume) 2024 & 2032
                                                              57. Figure 57: Middle East and Africa Shale Oil Industry Revenue Share (%), by Export Market Analysis (Value & Volume) 2024 & 2032
                                                              58. Figure 58: Middle East and Africa Shale Oil Industry Revenue (Million), by Price Trend Analysis 2024 & 2032
                                                              59. Figure 59: Middle East and Africa Shale Oil Industry Revenue Share (%), by Price Trend Analysis 2024 & 2032
                                                              60. Figure 60: Middle East and Africa Shale Oil Industry Revenue (Million), by Country 2024 & 2032
                                                              61. Figure 61: Middle East and Africa Shale Oil Industry Revenue Share (%), by Country 2024 & 2032

                                                              List of Tables

                                                              1. Table 1: Global Shale Oil Industry Revenue Million Forecast, by Region 2019 & 2032
                                                              2. Table 2: Global Shale Oil Industry Revenue Million Forecast, by Production Analysis 2019 & 2032
                                                              3. Table 3: Global Shale Oil Industry Revenue Million Forecast, by Consumption Analysis 2019 & 2032
                                                              4. Table 4: Global Shale Oil Industry Revenue Million Forecast, by Import Market Analysis (Value & Volume) 2019 & 2032
                                                              5. Table 5: Global Shale Oil Industry Revenue Million Forecast, by Export Market Analysis (Value & Volume) 2019 & 2032
                                                              6. Table 6: Global Shale Oil Industry Revenue Million Forecast, by Price Trend Analysis 2019 & 2032
                                                              7. Table 7: Global Shale Oil Industry Revenue Million Forecast, by Region 2019 & 2032
                                                              8. Table 8: Global Shale Oil Industry Revenue Million Forecast, by Production Analysis 2019 & 2032
                                                              9. Table 9: Global Shale Oil Industry Revenue Million Forecast, by Consumption Analysis 2019 & 2032
                                                              10. Table 10: Global Shale Oil Industry Revenue Million Forecast, by Import Market Analysis (Value & Volume) 2019 & 2032
                                                              11. Table 11: Global Shale Oil Industry Revenue Million Forecast, by Export Market Analysis (Value & Volume) 2019 & 2032
                                                              12. Table 12: Global Shale Oil Industry Revenue Million Forecast, by Price Trend Analysis 2019 & 2032
                                                              13. Table 13: Global Shale Oil Industry Revenue Million Forecast, by Country 2019 & 2032
                                                              14. Table 14: Global Shale Oil Industry Revenue Million Forecast, by Production Analysis 2019 & 2032
                                                              15. Table 15: Global Shale Oil Industry Revenue Million Forecast, by Consumption Analysis 2019 & 2032
                                                              16. Table 16: Global Shale Oil Industry Revenue Million Forecast, by Import Market Analysis (Value & Volume) 2019 & 2032
                                                              17. Table 17: Global Shale Oil Industry Revenue Million Forecast, by Export Market Analysis (Value & Volume) 2019 & 2032
                                                              18. Table 18: Global Shale Oil Industry Revenue Million Forecast, by Price Trend Analysis 2019 & 2032
                                                              19. Table 19: Global Shale Oil Industry Revenue Million Forecast, by Country 2019 & 2032
                                                              20. Table 20: Global Shale Oil Industry Revenue Million Forecast, by Production Analysis 2019 & 2032
                                                              21. Table 21: Global Shale Oil Industry Revenue Million Forecast, by Consumption Analysis 2019 & 2032
                                                              22. Table 22: Global Shale Oil Industry Revenue Million Forecast, by Import Market Analysis (Value & Volume) 2019 & 2032
                                                              23. Table 23: Global Shale Oil Industry Revenue Million Forecast, by Export Market Analysis (Value & Volume) 2019 & 2032
                                                              24. Table 24: Global Shale Oil Industry Revenue Million Forecast, by Price Trend Analysis 2019 & 2032
                                                              25. Table 25: Global Shale Oil Industry Revenue Million Forecast, by Country 2019 & 2032
                                                              26. Table 26: Global Shale Oil Industry Revenue Million Forecast, by Production Analysis 2019 & 2032
                                                              27. Table 27: Global Shale Oil Industry Revenue Million Forecast, by Consumption Analysis 2019 & 2032
                                                              28. Table 28: Global Shale Oil Industry Revenue Million Forecast, by Import Market Analysis (Value & Volume) 2019 & 2032
                                                              29. Table 29: Global Shale Oil Industry Revenue Million Forecast, by Export Market Analysis (Value & Volume) 2019 & 2032
                                                              30. Table 30: Global Shale Oil Industry Revenue Million Forecast, by Price Trend Analysis 2019 & 2032
                                                              31. Table 31: Global Shale Oil Industry Revenue Million Forecast, by Country 2019 & 2032
                                                              32. Table 32: Global Shale Oil Industry Revenue Million Forecast, by Production Analysis 2019 & 2032
                                                              33. Table 33: Global Shale Oil Industry Revenue Million Forecast, by Consumption Analysis 2019 & 2032
                                                              34. Table 34: Global Shale Oil Industry Revenue Million Forecast, by Import Market Analysis (Value & Volume) 2019 & 2032
                                                              35. Table 35: Global Shale Oil Industry Revenue Million Forecast, by Export Market Analysis (Value & Volume) 2019 & 2032
                                                              36. Table 36: Global Shale Oil Industry Revenue Million Forecast, by Price Trend Analysis 2019 & 2032
                                                              37. Table 37: Global Shale Oil Industry Revenue Million Forecast, by Country 2019 & 2032


                                                              Frequently Asked Questions

                                                              1. What is the projected Compound Annual Growth Rate (CAGR) of the Shale Oil Industry?

                                                              The projected CAGR is approximately > 5.00%.

                                                              2. Which companies are prominent players in the Shale Oil Industry?

                                                              Key companies in the market include Exxon Mobil Corporation, Chevron Corporation, ConocoPhillips Company, Royal Dutch Shell PLC, Continental Resources Inc, Murphy Oil Corporation, Occidental Petroleum Corporation, Marathon Oil Corporation, Schlumberger Limited, Halliburton Company*List Not Exhaustive.

                                                              3. What are the main segments of the Shale Oil Industry?

                                                              The market segments include Production Analysis, Consumption Analysis, Import Market Analysis (Value & Volume), Export Market Analysis (Value & Volume), Price Trend Analysis.

                                                              4. Can you provide details about the market size?

                                                              The market size is estimated to be USD XX Million as of 2022.

                                                              5. What are some drivers contributing to market growth?

                                                              N/A

                                                              6. What are the notable trends driving market growth?

                                                              Growing Petrochemical Industry to Drive the Market.

                                                              7. Are there any restraints impacting market growth?

                                                              N/A

                                                              8. Can you provide examples of recent developments in the market?

                                                              In July 2022, Oilex and Schlumberger won a contract for the supply by Schlumberger of hydraulic fracturing services, coiled tubing and nitrogen services, and perforation services for the planned re-frac of the Cambay C-77H well in Gujarat, India.

                                                              9. What pricing options are available for accessing the report?

                                                              Pricing options include single-user, multi-user, and enterprise licenses priced at USD 4750, USD 5250, and USD 8750 respectively.

                                                              10. Is the market size provided in terms of value or volume?

                                                              The market size is provided in terms of value, measured in Million.

                                                              11. Are there any specific market keywords associated with the report?

                                                              Yes, the market keyword associated with the report is "Shale Oil Industry," which aids in identifying and referencing the specific market segment covered.

                                                              12. How do I determine which pricing option suits my needs best?

                                                              The pricing options vary based on user requirements and access needs. Individual users may opt for single-user licenses, while businesses requiring broader access may choose multi-user or enterprise licenses for cost-effective access to the report.

                                                              13. Are there any additional resources or data provided in the Shale Oil Industry report?

                                                              While the report offers comprehensive insights, it's advisable to review the specific contents or supplementary materials provided to ascertain if additional resources or data are available.

                                                              14. How can I stay updated on further developments or reports in the Shale Oil Industry?

                                                              To stay informed about further developments, trends, and reports in the Shale Oil Industry, consider subscribing to industry newsletters, following relevant companies and organizations, or regularly checking reputable industry news sources and publications.


                                                              Methodology

                                                              Step 1 - Identification of Relevant Samples Size from Population Database

                                                              Step Chart
                                                              Bar Chart
                                                              Method Chart

                                                              Step 2 - Approaches for Defining Global Market Size (Value, Volume* & Price*)

                                                              Approach Chart
                                                              Top-down and bottom-up approaches are used to validate the global market size and estimate the market size for manufactures, regional segments, product, and application.

                                                              Note*: In applicable scenarios

                                                              Step 3 - Data Sources

                                                              Primary Research

                                                              • Web Analytics
                                                              • Survey Reports
                                                              • Research Institute
                                                              • Latest Research Reports
                                                              • Opinion Leaders

                                                              Secondary Research

                                                              • Annual Reports
                                                              • White Paper
                                                              • Latest Press Release
                                                              • Industry Association
                                                              • Paid Database
                                                              • Investor Presentations
                                                              Analyst Chart

                                                              Step 4 - Data Triangulation

                                                              Involves using different sources of information in order to increase the validity of a study

                                                              These sources are likely to be stakeholders in a program - participants, other researchers, program staff, other community members, and so on.

                                                              Then we put all data in single framework & apply various statistical tools to find out the dynamic on the market.

                                                              During the analysis stage, feedback from the stakeholder groups would be compared to determine areas of agreement as well as areas of divergence

                                                              Additionally, after gathering mixed and scattered data from a wide range of sources, data is triangulated and correlated to come up with estimated figures which are further validated through primary mediums or industry experts, opinion leaders.

                                                              About Visionary Data Reports

                                                              Visionary Data Reports provides future-focused market research, advanced analytics, and strategic insights for technology, healthcare, green energy, and finance. Our reports help you anticipate trends, innovate, and lead in your industry. Our expert team combines primary research, data science, and industry knowledge to deliver actionable intelligence. We offer syndicated reports, custom analytics, and consulting services tailored to your business needs. At Visionary Data Reports, we are committed to quality, transparency, and client satisfaction. Every report is rigorously validated to ensure accuracy and relevance. Our global perspective and forward-thinking approach help you understand both current and emerging market dynamics.

                                                              Stay ahead with Visionary Data Reports. Subscribe to our newsletter for the latest insights and research highlights, and follow us on social media for real-time updates. Visionary Data Reports – Your Guide to Tomorrow’s Opportunities.

                                                              artwork spiralartwork spiralRelated Reports
                                                              artwork underline

                                                              Gabon Power Industry Insights: Growth at XX CAGR Through 2033

                                                              Discover the lucrative growth opportunities in Gabon's booming power industry. This comprehensive market analysis reveals key drivers, trends, and challenges shaping the sector's future, including hydropower, natural gas, and the role of major players like Engie and Wartsila. Explore the projected market size, CAGR, and regional breakdowns for informed investment decisions. Invest in Gabon's energy future.

                                                              July 2025
                                                              Base Year: 2024
                                                              No Of Pages: 197
                                                              Price: $3800

                                                              Algeria Power Market Market’s Consumer Insights and Trends

                                                              Discover the booming Algerian power market, projected to grow at a CAGR exceeding 8.5% until 2033. This in-depth analysis reveals key drivers, trends, and challenges, highlighting opportunities for investment in renewable energy and grid modernization. Explore market size, segmentation, and key players shaping this dynamic sector.

                                                              July 2025
                                                              Base Year: 2024
                                                              No Of Pages: 197
                                                              Price: $3800

                                                              US Fixed-tilt Solar PV Industry 2025-2033 Analysis: Trends, Competitor Dynamics, and Growth Opportunities

                                                              Discover the booming US fixed-tilt solar PV market! This comprehensive analysis reveals a CAGR exceeding 13.60%, driven by strong demand, government incentives, and technological advancements. Learn about key trends, regional variations, leading companies, and future growth projections for 2025-2033.

                                                              July 2025
                                                              Base Year: 2024
                                                              No Of Pages: 197
                                                              Price: $3800

                                                              Artificial Lift Software Industry Strategic Insights: Analysis 2025 and Forecasts 2033

                                                              The Artificial Lift Systems market is booming, projected to reach $XX million by 2033 with a CAGR exceeding 4.50%. Driven by increasing oil & gas production and technological advancements in ESP, PCP, and Rod Lift systems, key players like Baker Hughes and Schlumberger are shaping this lucrative sector. Explore market trends and regional analysis in our comprehensive report.

                                                              July 2025
                                                              Base Year: 2024
                                                              No Of Pages: 234
                                                              Price: $4750

                                                              Middle East and Africa Bunker Fuel Industry: Disruptive Technologies Driving Market Growth 2025-2033

                                                              Discover the booming Middle East & Africa Bunker Fuel market! This comprehensive analysis reveals a CAGR exceeding 12%, driven by increasing maritime trade and the shift towards cleaner fuels like LNG. Learn about market trends, key players (Shell, ExxonMobil, Uniper), and regional growth forecasts for 2025-2033.

                                                              July 2025
                                                              Base Year: 2024
                                                              No Of Pages: 234
                                                              Price: $4750

                                                              Gas Generator Rental Industry Unlocking Growth Potential: 2025-2033 Analysis and Forecasts

                                                              The gas generator rental market is booming, projected to exceed a CAGR of 5.20% through 2033. Discover key drivers, regional trends, and leading companies shaping this dynamic industry. Explore market size, segmentation (oil & gas, construction, data centers), and future growth projections in our comprehensive analysis.

                                                              July 2025
                                                              Base Year: 2024
                                                              No Of Pages: 234
                                                              Price: $4750

                                                              Unveiling Oil and Gas CAPEX Outlook Industry Trends

                                                              Discover the latest Oil & Gas CAPEX Outlook, projecting a 4.27% CAGR through 2033. Analyze market trends, regional breakdowns (North America, Europe, Asia-Pacific), key players (Shell, ExxonMobil, CNPC), and investment drivers shaping this dynamic sector. Get the data-driven insights you need for strategic decision-making.

                                                              July 2025
                                                              Base Year: 2024
                                                              No Of Pages: 234
                                                              Price: $4750

                                                              Oil and Gas Market in Malaysia Market’s Consumer Insights and Trends

                                                              Discover the booming Malaysian oil and gas market! This comprehensive analysis reveals key trends, drivers, and challenges impacting this $15B+ sector through 2033, profiling major players like Petronas and Royal Vopak. Learn about growth projections, market segmentation (transportation, storage, LNG terminals), and investment opportunities.

                                                              July 2025
                                                              Base Year: 2024
                                                              No Of Pages: 197
                                                              Price: $3800

                                                              Navigating Asia-Pacific Completion Equipment and Services Market Market Growth 2025-2033

                                                              Discover the booming Asia-Pacific completion equipment and services market! This in-depth analysis reveals key trends, growth drivers, and leading companies shaping this dynamic sector, projected to reach significant value by 2033. Explore market segments, regional breakdowns, and future growth potential.

                                                              July 2025
                                                              Base Year: 2024
                                                              No Of Pages: 234
                                                              Price: $4750

                                                              Exploring Consumer Shifts in Gas Generator Industry Market 2025-2033

                                                              The global gas generator market is booming, projected to reach $XX million by 2033 with a 4.95% CAGR. Driven by industrialization and unreliable grids, this report analyzes market trends, segments (industrial, commercial, residential, power rating), key players (Cummins, Generac, Caterpillar), and regional growth (North America, Europe, Asia-Pacific). Discover insights into this expanding market.

                                                              July 2025
                                                              Base Year: 2024
                                                              No Of Pages: 234
                                                              Price: $4750

                                                              Decoding Tunisia Power Industry Consumer Preferences 2025-2033

                                                              Discover the booming Tunisian power industry! This comprehensive market analysis reveals a CAGR of 7.70%, driven by renewable energy adoption and infrastructure modernization. Explore market size, key players (STEG, Seeraj Energy, more), and future growth projections (2025-2033) in this insightful report.

                                                              July 2025
                                                              Base Year: 2024
                                                              No Of Pages: 197
                                                              Price: $3800

                                                              High Voltage Switchgear Market Market Trends and Insights

                                                              The global high-voltage switchgear market is booming, projected to reach [insert projected 2033 value based on chart data] by 2033, driven by renewable energy integration and grid modernization. Explore market trends, key players (ABB, Siemens, Schneider Electric), and regional insights in this comprehensive analysis.

                                                              July 2025
                                                              Base Year: 2024
                                                              No Of Pages: 234
                                                              Price: $4750

                                                              Regional Trends and Opportunities for Excitation Systems Industry Market

                                                              Discover the booming Excitation Systems market! This in-depth analysis reveals a CAGR exceeding 4.35% through 2033, driven by renewable energy and industrial growth. Explore market size, key players (ABB, Siemens, GE), regional trends, and future projections for synchronous generators, motors, static & brushless systems.

                                                              July 2025
                                                              Base Year: 2024
                                                              No Of Pages: 234
                                                              Price: $4750

                                                              Comprehensive Review of Residential Combined Heat & Power System Market Growth Potential

                                                              Discover the booming Residential Combined Heat & Power (CHP) System market! Explore key trends, growth drivers, leading companies, and regional insights for 2025-2033. Learn about fuel cell and engine-based systems, and the impact of government policies on this sustainable energy solution.

                                                              July 2025
                                                              Base Year: 2024
                                                              No Of Pages: 234
                                                              Price: $4750

                                                              Opportunities in Emerging Indonesia Oil & Gas Downstream Market Industry Markets

                                                              Discover the booming Indonesia Oil & Gas Downstream Market analysis revealing a CAGR exceeding 4% through 2033. This in-depth report covers key players, segments (refined products, natural gas, petrochemicals), and regional trends, offering invaluable insights for investors and industry professionals. Explore growth drivers, restraints, and future projections for this dynamic market.

                                                              July 2025
                                                              Base Year: 2024
                                                              No Of Pages: 197
                                                              Price: $3800

                                                              Europe Nuclear Power Plant and Equipment Industry Market Trends and Strategic Roadmap

                                                              Discover the latest market analysis on the thriving European Nuclear Power Plant & Equipment industry. Explore growth drivers, market size (€20B in 2025), key players (Westinghouse, Rosatom, Framatome), and future trends impacting PWR, PHWR, and SMR technologies. Learn about the investment opportunities and challenges in this dynamic sector.

                                                              July 2025
                                                              Base Year: 2024
                                                              No Of Pages: 234
                                                              Price: $4750

                                                              Europe Hydraulic Fracturing Fluids Market Market Expansion: Growth Outlook 2025-2033

                                                              Discover the latest trends in the European hydraulic fracturing fluids market. Our in-depth analysis reveals a steady growth trajectory driven by natural gas demand, despite environmental regulations. Learn about market segmentation, key players (Schlumberger, Halliburton, Baker Hughes), and future projections for 2025-2033.

                                                              July 2025
                                                              Base Year: 2024
                                                              No Of Pages: 180
                                                              Price: $4750

                                                              Consumer Battery Industry Market’s Strategic Roadmap: Insights for 2025-2033

                                                              Discover the booming consumer battery market! This in-depth analysis reveals a CAGR of 7.47% through 2033, driven by consumer electronics, EVs, and industrial demand. Explore market size, key players (Samsung SDI, LG Chem, Panasonic), and regional trends. Learn about lithium-ion, alkaline, and other battery types.

                                                              July 2025
                                                              Base Year: 2024
                                                              No Of Pages: 234
                                                              Price: $4750

                                                              Kuwait Oil & Gas Market Market Predictions: Growth and Size Trends to 2033

                                                              Discover the booming Kuwait Oil & Gas market forecast to 2033! This in-depth analysis reveals market size, growth drivers (upstream, midstream, downstream), key players (Kuwait Petroleum Corporation, Chevron, Shell), and challenges. Learn about investment opportunities and future trends in this dynamic sector.

                                                              July 2025
                                                              Base Year: 2024
                                                              No Of Pages: 197
                                                              Price: $3800

                                                              France Tidal Power Market 2025-2033 Trends and Competitor Dynamics: Unlocking Growth Opportunities

                                                              Discover the booming France Tidal Power Market! Explore its €175-200 million (2025 est.) size, 4.54% CAGR, key drivers, restraints, and top companies. Learn about tidal barrage, floating platforms, and stream generation technologies shaping this renewable energy sector.

                                                              July 2025
                                                              Base Year: 2024
                                                              No Of Pages: 197
                                                              Price: $3800
                                                              • Home
                                                              • About Us
                                                              • Industries
                                                                • Aerospace & Defense
                                                                • Agriculture
                                                                • Animal Nutrition & Wellness
                                                                • Automotive
                                                                • Chemicals & Materials
                                                                • Consumer Goods and Services
                                                                • Energy & Power
                                                                • Financial Services and Investment Intelligence
                                                                • Food & Beverage
                                                                • Home and Property Improvement
                                                                • Hospitality and Tourism
                                                                • Logistics
                                                                • Manufacturing Products and Services
                                                                • Packaging
                                                                • Professional and Commercial Services
                                                                • Real Estate and Construction
                                                                • Retail
                                                                • Technology, Media and Telecom
                                                                • Healthcare
                                                              • Services
                                                              • Contact
                                                              Main Logo
                                                              • Home
                                                              • About Us
                                                              • Industries
                                                                • Aerospace & Defense
                                                                • Agriculture
                                                                • Animal Nutrition & Wellness
                                                                • Automotive
                                                                • Chemicals & Materials
                                                                • Consumer Goods and Services
                                                                • Energy & Power
                                                                • Financial Services and Investment Intelligence
                                                                • Food & Beverage
                                                                • Home and Property Improvement
                                                                • Hospitality and Tourism
                                                                • Logistics
                                                                • Manufacturing Products and Services
                                                                • Packaging
                                                                • Professional and Commercial Services
                                                                • Real Estate and Construction
                                                                • Retail
                                                                • Technology, Media and Telecom
                                                                • Healthcare
                                                              • Services
                                                              • Contact
                                                              +17162654855
                                                              [email protected]

                                                              +17162654855

                                                              [email protected]

                                                              Business Address

                                                              Head Office

                                                              Office no. A 5010, fifth floor, Solitaire Business Hub, Near Phoenix mall, Pune, Maharashtra 411014

                                                              Contact Information

                                                              Craig Francis

                                                              Business Development Head

                                                              +17162654855

                                                              [email protected]

                                                              Connect With Us

                                                              Secure Payment Partners

                                                              payment image
                                                              RetailLogisticsPackagingAutomotiveHealthcareAgricultureEnergy & PowerFood & BeverageAerospace & DefenseChemicals & MaterialsHospitality and TourismAnimal Nutrition & WellnessConsumer Goods and ServicesReal Estate and ConstructionHome and Property ImprovementTechnology, Media and TelecomManufacturing Products and ServicesFinancial Services and Investment Intelligence

                                                              © 2025 All rights reserved


                                                              Privacy Policy
                                                              Terms and Conditions
                                                              FAQ