
Key Insights
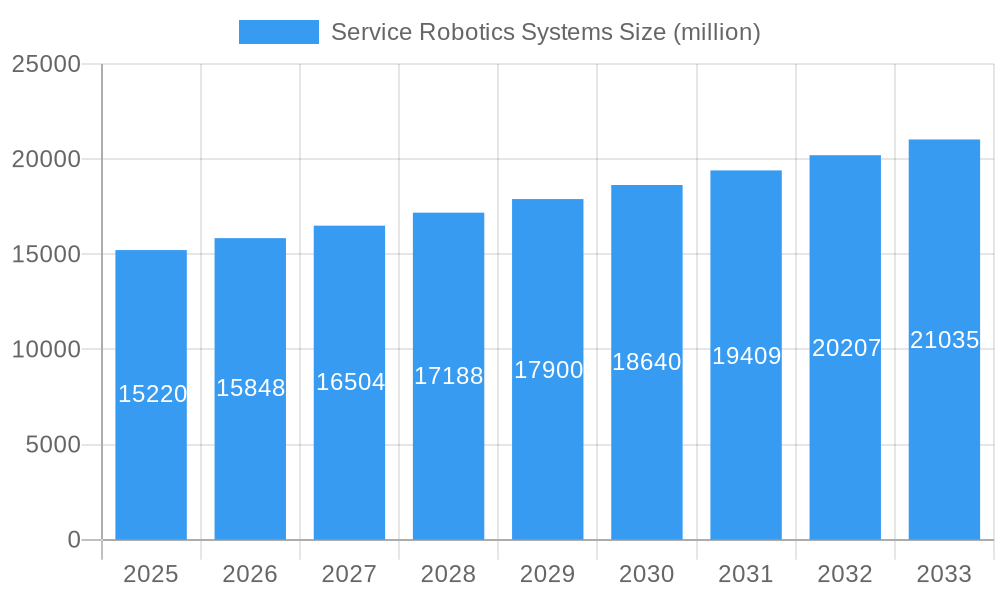
The global service robotics systems market, valued at approximately $15.22 billion in 2025, is projected to experience robust growth, driven by increasing automation across diverse sectors. The Compound Annual Growth Rate (CAGR) of 4.1% from 2025 to 2033 indicates a steady expansion, fueled by several key factors. The rising demand for enhanced efficiency and productivity in industries like healthcare (surgical robots, elderly care), logistics (autonomous delivery robots), and manufacturing (industrial automation) are significant drivers. Furthermore, technological advancements in areas such as artificial intelligence (AI), machine learning (ML), and computer vision are enabling the development of more sophisticated and capable service robots. This leads to increased adoption across various applications, including cleaning, inspection, and maintenance. While initial investment costs and regulatory hurdles might pose some constraints, the long-term benefits in terms of cost reduction, improved safety, and enhanced operational efficiency are expected to outweigh these challenges.
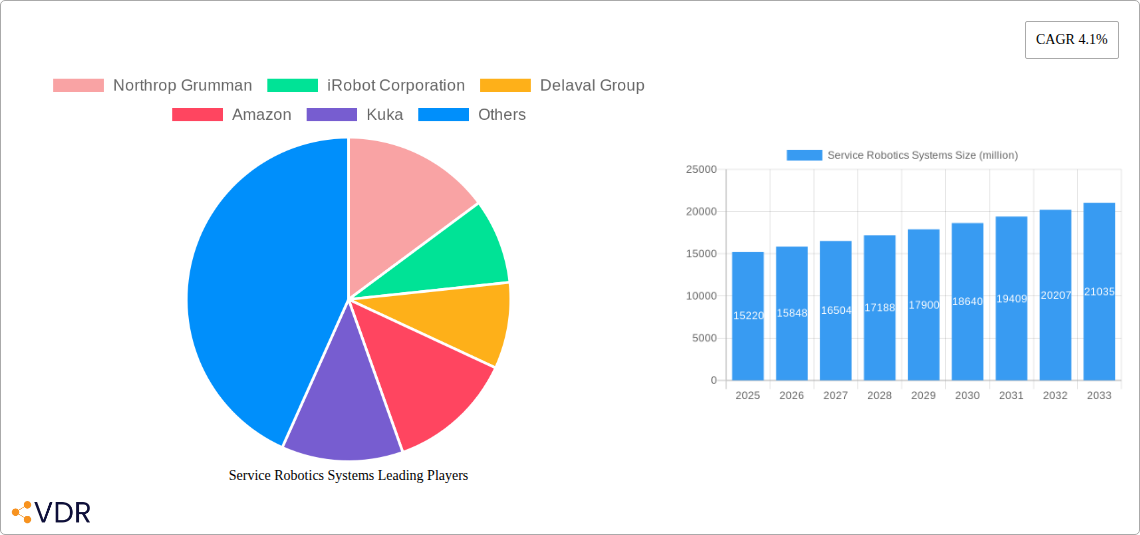
Service Robotics Systems Market Size (In Billion)

The market's segmentation, though not explicitly provided, is likely to encompass various robot types (e.g., mobile robots, collaborative robots, autonomous vehicles), application areas (e.g., healthcare, logistics, manufacturing, domestic use), and geographical regions. Leading companies like Northrop Grumman, iRobot, and Amazon are actively investing in research and development, driving innovation and competition. The market is characterized by a diverse range of players, from established technology giants to specialized robotics companies, indicating a dynamic and competitive landscape. The future growth trajectory will depend on factors such as technological advancements, government policies supporting automation, and consumer adoption rates. The increasing integration of service robots into various aspects of daily life and industrial processes is expected to further propel market expansion over the forecast period.
Service Robotics Systems Company Market Share
Service Robotics Systems Market Report: 2019-2033
This comprehensive report provides an in-depth analysis of the Service Robotics Systems market, encompassing market dynamics, growth trends, regional dominance, product landscape, key players, and future outlook. The study period spans 2019-2033, with a base year of 2025 and a forecast period of 2025-2033. The report leverages extensive primary and secondary research to deliver actionable insights for industry professionals, investors, and stakeholders. The market is segmented by application (parent market) and further into sub-applications (child markets), providing a granular view of market opportunities.
Service Robotics Systems Market Dynamics & Structure
The global service robotics systems market is characterized by moderate concentration, with key players holding significant market share. However, the emergence of innovative startups and technological advancements are driving increased competition. The market is influenced by technological innovation (e.g., AI, machine learning), evolving regulatory frameworks across various regions, the availability of competitive product substitutes, and dynamic end-user demographics (e.g., aging population driving demand for healthcare robots). Mergers and acquisitions (M&A) activities are also shaping the market landscape, consolidating market power and accelerating technological integration. The estimated market size in 2025 is xx million units, with a projected CAGR of xx% during the forecast period.
- Market Concentration: Moderately concentrated, with top 5 players holding approximately xx% market share in 2025.
- Technological Innovation Drivers: AI, machine learning, computer vision, sensor technology, and advanced materials.
- Regulatory Frameworks: Vary across regions, impacting adoption rates and market entry barriers. Stringent safety and data privacy regulations are increasingly influencing market dynamics.
- Competitive Product Substitutes: Traditional manual labor and alternative automation technologies pose competitive threats.
- End-User Demographics: Aging populations in developed nations are driving demand for healthcare and eldercare robots. The rise of e-commerce fuels demand for logistics and delivery robots.
- M&A Trends: A significant increase in M&A activities observed from 2020-2024, with an estimated xx deals finalized. This trend is expected to continue, driven by the need for technological integration and expansion into new markets.
Service Robotics Systems Growth Trends & Insights
The service robotics systems market has witnessed substantial growth from 2019 to 2024, driven primarily by increasing automation across various industries and rising demand for improved efficiency and productivity. Adoption rates are accelerating, particularly in sectors like healthcare, logistics, and manufacturing. Technological disruptions, including the widespread adoption of AI and IoT, are creating new opportunities and reshaping market dynamics. Consumer behavior is shifting towards greater acceptance and reliance on service robots, driven by convenience, cost-effectiveness, and improved safety standards. The market size expanded from xx million units in 2019 to xx million units in 2024, exhibiting a CAGR of xx%. Market penetration in key sectors is projected to increase from xx% in 2025 to xx% by 2033.
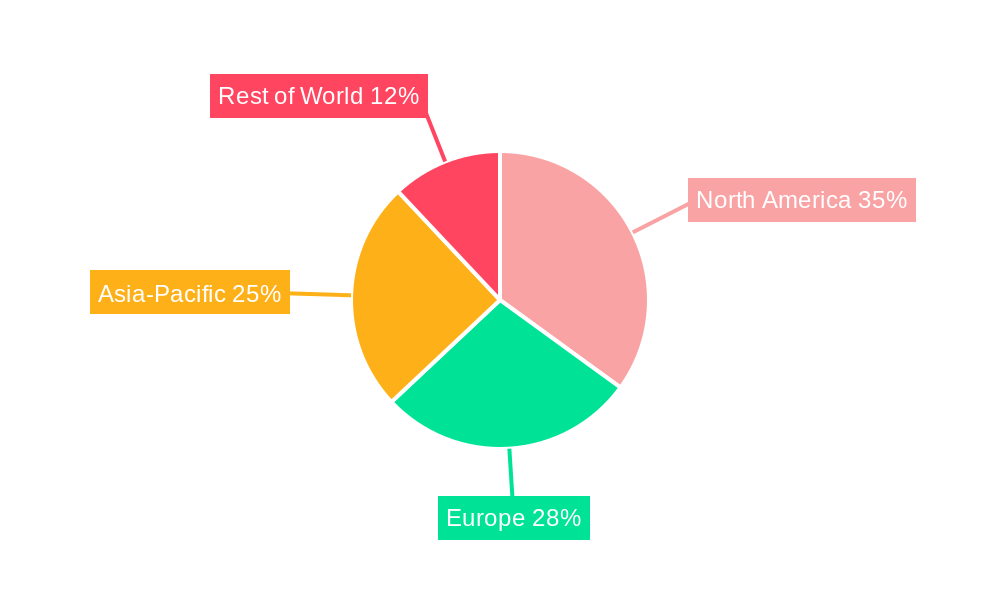
Dominant Regions, Countries, or Segments in Service Robotics Systems
North America and Europe currently dominate the service robotics systems market, driven by strong technological innovation, high adoption rates, and favorable regulatory environments. However, the Asia-Pacific region is experiencing rapid growth, fueled by expanding industrialization, increasing investments in automation, and a burgeoning middle class. Specific countries like Japan, South Korea, and China are emerging as significant market players, driven by government support and investments in robotics research and development.
- North America: High adoption rates in healthcare and logistics, strong R&D capabilities, and early adoption of advanced technologies.
- Europe: Focus on automation in manufacturing and service sectors, supportive government policies, and a skilled workforce.
- Asia-Pacific: Rapid industrialization, increasing investments in robotics, and a large consumer base driving demand.
- Key Drivers: Government support, technological advancements, favorable economic conditions, and increasing labor costs.
- Dominance Factors: High market penetration, strong technological capabilities, and favorable regulatory environments.
Service Robotics Systems Product Landscape
Service robotics systems encompass a diverse range of products, including mobile robots, collaborative robots (cobots), autonomous guided vehicles (AGVs), and specialized robots for specific applications (e.g., surgical robots, delivery robots). These products are characterized by advanced features such as AI-powered navigation, object recognition, and human-robot interaction capabilities. Key performance indicators include speed, payload capacity, autonomy levels, and safety features. Continuous innovation focuses on improving efficiency, reliability, and cost-effectiveness.
Key Drivers, Barriers & Challenges in Service Robotics Systems
Key Drivers:
- Technological advancements in AI, machine learning, and sensor technologies.
- Increasing demand for automation across various industries.
- Rising labor costs and skilled labor shortages.
- Government initiatives and financial incentives promoting robotic adoption.
Key Challenges:
- High initial investment costs and implementation complexities.
- Concerns regarding job displacement and social impact.
- Safety and security considerations related to autonomous systems.
- Interoperability and standardization challenges across different robotic systems. These result in estimated xx million units lost opportunity cost in 2025.
Emerging Opportunities in Service Robotics Systems
- Expanding applications in healthcare, eldercare, and home assistance.
- Growth in e-commerce and logistics fueling demand for delivery and warehouse robots.
- Increasing adoption of service robots in agriculture and construction.
- Development of specialized robots for niche applications (e.g., underwater robots, inspection robots).
Growth Accelerators in the Service Robotics Systems Industry
Technological breakthroughs in AI, sensor technology, and battery life are significantly accelerating market growth. Strategic partnerships between robotics companies and end-user industries are creating new market opportunities. Government investments in robotics research and infrastructure development are driving innovation and adoption. Expansion into emerging markets with high growth potential further fuels market expansion.
Key Players Shaping the Service Robotics Systems Market
- Northrop Grumman
- iRobot Corporation
- Delaval Group
- Amazon
- Kuka
- Yaskawa Electric
- Lely Group
- Adept Technology
- Honda Motor
- Kongsberg Maritime
- Aethon
- Geckosystems Intl
- Bluefin Robotics
- ECA Group
Notable Milestones in Service Robotics Systems Sector
- 2020: Increased investment in AI-powered service robotics.
- 2021: Significant M&A activity among key players.
- 2022: Launch of several new collaborative robots for manufacturing applications.
- 2023: Regulatory approvals for autonomous delivery robots in several countries.
- 2024: Significant advancements in battery technology extending operational time.
In-Depth Service Robotics Systems Market Outlook
The service robotics systems market is poised for robust growth over the next decade, driven by continuous technological innovation, expanding applications, and increasing demand across various industries. Strategic partnerships, targeted investments, and expansion into untapped markets will be crucial for sustained growth. The convergence of AI, IoT, and robotics will unlock new possibilities, creating opportunities for significant market expansion and value creation. The market is projected to reach xx million units by 2033, creating substantial opportunities for both established players and emerging companies.
Service Robotics Systems Segmentation
-
1. Application
- 1.1. BFSI
- 1.2. Consumer Goods and Retail
- 1.3. Manufacturing
- 1.4. Healthcare
- 1.5. Government
- 1.6. Others
-
2. Type
- 2.1. Ground Service Robotics System
- 2.2. Aerial Service Robotics System
- 2.3. Underwater Service Robotics System
- 2.4. Mobile Service Robotics System
- 2.5. Others
Service Robotics Systems Segmentation By Geography
-
1. North America
- 1.1. United States
- 1.2. Canada
- 1.3. Mexico
-
2. South America
- 2.1. Brazil
- 2.2. Argentina
- 2.3. Rest of South America
-
3. Europe
- 3.1. United Kingdom
- 3.2. Germany
- 3.3. France
- 3.4. Italy
- 3.5. Spain
- 3.6. Russia
- 3.7. Benelux
- 3.8. Nordics
- 3.9. Rest of Europe
-
4. Middle East & Africa
- 4.1. Turkey
- 4.2. Israel
- 4.3. GCC
- 4.4. North Africa
- 4.5. South Africa
- 4.6. Rest of Middle East & Africa
-
5. Asia Pacific
- 5.1. China
- 5.2. India
- 5.3. Japan
- 5.4. South Korea
- 5.5. ASEAN
- 5.6. Oceania
- 5.7. Rest of Asia Pacific
Service Robotics Systems Regional Market Share
Geographic Coverage of Service Robotics Systems
Service Robotics Systems REPORT HIGHLIGHTS
| Aspects | Details |
|---|---|
| Study Period | 2020-2034 |
| Base Year | 2025 |
| Estimated Year | 2026 |
| Forecast Period | 2026-2034 |
| Historical Period | 2020-2025 |
| Growth Rate | CAGR of 4.1% from 2020-2034 |
| Segmentation |
|
Table of Contents
- 1. Introduction
- 1.1. Research Scope
- 1.2. Market Segmentation
- 1.3. Research Methodology
- 1.4. Definitions and Assumptions
- 2. Executive Summary
- 2.1. Introduction
- 3. Market Dynamics
- 3.1. Introduction
- 3.2. Market Drivers
- 3.3. Market Restrains
- 3.4. Market Trends
- 4. Market Factor Analysis
- 4.1. Porters Five Forces
- 4.2. Supply/Value Chain
- 4.3. PESTEL analysis
- 4.4. Market Entropy
- 4.5. Patent/Trademark Analysis
- 5. Global Service Robotics Systems Analysis, Insights and Forecast, 2020-2032
- 5.1. Market Analysis, Insights and Forecast - by Application
- 5.1.1. BFSI
- 5.1.2. Consumer Goods and Retail
- 5.1.3. Manufacturing
- 5.1.4. Healthcare
- 5.1.5. Government
- 5.1.6. Others
- 5.2. Market Analysis, Insights and Forecast - by Type
- 5.2.1. Ground Service Robotics System
- 5.2.2. Aerial Service Robotics System
- 5.2.3. Underwater Service Robotics System
- 5.2.4. Mobile Service Robotics System
- 5.2.5. Others
- 5.3. Market Analysis, Insights and Forecast - by Region
- 5.3.1. North America
- 5.3.2. South America
- 5.3.3. Europe
- 5.3.4. Middle East & Africa
- 5.3.5. Asia Pacific
- 5.1. Market Analysis, Insights and Forecast - by Application
- 6. North America Service Robotics Systems Analysis, Insights and Forecast, 2020-2032
- 6.1. Market Analysis, Insights and Forecast - by Application
- 6.1.1. BFSI
- 6.1.2. Consumer Goods and Retail
- 6.1.3. Manufacturing
- 6.1.4. Healthcare
- 6.1.5. Government
- 6.1.6. Others
- 6.2. Market Analysis, Insights and Forecast - by Type
- 6.2.1. Ground Service Robotics System
- 6.2.2. Aerial Service Robotics System
- 6.2.3. Underwater Service Robotics System
- 6.2.4. Mobile Service Robotics System
- 6.2.5. Others
- 6.1. Market Analysis, Insights and Forecast - by Application
- 7. South America Service Robotics Systems Analysis, Insights and Forecast, 2020-2032
- 7.1. Market Analysis, Insights and Forecast - by Application
- 7.1.1. BFSI
- 7.1.2. Consumer Goods and Retail
- 7.1.3. Manufacturing
- 7.1.4. Healthcare
- 7.1.5. Government
- 7.1.6. Others
- 7.2. Market Analysis, Insights and Forecast - by Type
- 7.2.1. Ground Service Robotics System
- 7.2.2. Aerial Service Robotics System
- 7.2.3. Underwater Service Robotics System
- 7.2.4. Mobile Service Robotics System
- 7.2.5. Others
- 7.1. Market Analysis, Insights and Forecast - by Application
- 8. Europe Service Robotics Systems Analysis, Insights and Forecast, 2020-2032
- 8.1. Market Analysis, Insights and Forecast - by Application
- 8.1.1. BFSI
- 8.1.2. Consumer Goods and Retail
- 8.1.3. Manufacturing
- 8.1.4. Healthcare
- 8.1.5. Government
- 8.1.6. Others
- 8.2. Market Analysis, Insights and Forecast - by Type
- 8.2.1. Ground Service Robotics System
- 8.2.2. Aerial Service Robotics System
- 8.2.3. Underwater Service Robotics System
- 8.2.4. Mobile Service Robotics System
- 8.2.5. Others
- 8.1. Market Analysis, Insights and Forecast - by Application
- 9. Middle East & Africa Service Robotics Systems Analysis, Insights and Forecast, 2020-2032
- 9.1. Market Analysis, Insights and Forecast - by Application
- 9.1.1. BFSI
- 9.1.2. Consumer Goods and Retail
- 9.1.3. Manufacturing
- 9.1.4. Healthcare
- 9.1.5. Government
- 9.1.6. Others
- 9.2. Market Analysis, Insights and Forecast - by Type
- 9.2.1. Ground Service Robotics System
- 9.2.2. Aerial Service Robotics System
- 9.2.3. Underwater Service Robotics System
- 9.2.4. Mobile Service Robotics System
- 9.2.5. Others
- 9.1. Market Analysis, Insights and Forecast - by Application
- 10. Asia Pacific Service Robotics Systems Analysis, Insights and Forecast, 2020-2032
- 10.1. Market Analysis, Insights and Forecast - by Application
- 10.1.1. BFSI
- 10.1.2. Consumer Goods and Retail
- 10.1.3. Manufacturing
- 10.1.4. Healthcare
- 10.1.5. Government
- 10.1.6. Others
- 10.2. Market Analysis, Insights and Forecast - by Type
- 10.2.1. Ground Service Robotics System
- 10.2.2. Aerial Service Robotics System
- 10.2.3. Underwater Service Robotics System
- 10.2.4. Mobile Service Robotics System
- 10.2.5. Others
- 10.1. Market Analysis, Insights and Forecast - by Application
- 11. Competitive Analysis
- 11.1. Global Market Share Analysis 2025
- 11.2. Company Profiles
- 11.2.1 Northrop Grumman
- 11.2.1.1. Overview
- 11.2.1.2. Products
- 11.2.1.3. SWOT Analysis
- 11.2.1.4. Recent Developments
- 11.2.1.5. Financials (Based on Availability)
- 11.2.2 iRobot Corporation
- 11.2.2.1. Overview
- 11.2.2.2. Products
- 11.2.2.3. SWOT Analysis
- 11.2.2.4. Recent Developments
- 11.2.2.5. Financials (Based on Availability)
- 11.2.3 Delaval Group
- 11.2.3.1. Overview
- 11.2.3.2. Products
- 11.2.3.3. SWOT Analysis
- 11.2.3.4. Recent Developments
- 11.2.3.5. Financials (Based on Availability)
- 11.2.4 Amazon
- 11.2.4.1. Overview
- 11.2.4.2. Products
- 11.2.4.3. SWOT Analysis
- 11.2.4.4. Recent Developments
- 11.2.4.5. Financials (Based on Availability)
- 11.2.5 Kuka
- 11.2.5.1. Overview
- 11.2.5.2. Products
- 11.2.5.3. SWOT Analysis
- 11.2.5.4. Recent Developments
- 11.2.5.5. Financials (Based on Availability)
- 11.2.6 Yaskawa Electric
- 11.2.6.1. Overview
- 11.2.6.2. Products
- 11.2.6.3. SWOT Analysis
- 11.2.6.4. Recent Developments
- 11.2.6.5. Financials (Based on Availability)
- 11.2.7 Lely Group
- 11.2.7.1. Overview
- 11.2.7.2. Products
- 11.2.7.3. SWOT Analysis
- 11.2.7.4. Recent Developments
- 11.2.7.5. Financials (Based on Availability)
- 11.2.8 Adept Technology
- 11.2.8.1. Overview
- 11.2.8.2. Products
- 11.2.8.3. SWOT Analysis
- 11.2.8.4. Recent Developments
- 11.2.8.5. Financials (Based on Availability)
- 11.2.9 Honda Motor
- 11.2.9.1. Overview
- 11.2.9.2. Products
- 11.2.9.3. SWOT Analysis
- 11.2.9.4. Recent Developments
- 11.2.9.5. Financials (Based on Availability)
- 11.2.10 Kongsberg Maritime
- 11.2.10.1. Overview
- 11.2.10.2. Products
- 11.2.10.3. SWOT Analysis
- 11.2.10.4. Recent Developments
- 11.2.10.5. Financials (Based on Availability)
- 11.2.11 Aethon
- 11.2.11.1. Overview
- 11.2.11.2. Products
- 11.2.11.3. SWOT Analysis
- 11.2.11.4. Recent Developments
- 11.2.11.5. Financials (Based on Availability)
- 11.2.12 Geckosystems Intl
- 11.2.12.1. Overview
- 11.2.12.2. Products
- 11.2.12.3. SWOT Analysis
- 11.2.12.4. Recent Developments
- 11.2.12.5. Financials (Based on Availability)
- 11.2.13 Google
- 11.2.13.1. Overview
- 11.2.13.2. Products
- 11.2.13.3. SWOT Analysis
- 11.2.13.4. Recent Developments
- 11.2.13.5. Financials (Based on Availability)
- 11.2.14 Bluefin Robotics
- 11.2.14.1. Overview
- 11.2.14.2. Products
- 11.2.14.3. SWOT Analysis
- 11.2.14.4. Recent Developments
- 11.2.14.5. Financials (Based on Availability)
- 11.2.15 ECA Group
- 11.2.15.1. Overview
- 11.2.15.2. Products
- 11.2.15.3. SWOT Analysis
- 11.2.15.4. Recent Developments
- 11.2.15.5. Financials (Based on Availability)
- 11.2.1 Northrop Grumman
List of Figures
- Figure 1: Global Service Robotics Systems Revenue Breakdown (million, %) by Region 2025 & 2033
- Figure 2: North America Service Robotics Systems Revenue (million), by Application 2025 & 2033
- Figure 3: North America Service Robotics Systems Revenue Share (%), by Application 2025 & 2033
- Figure 4: North America Service Robotics Systems Revenue (million), by Type 2025 & 2033
- Figure 5: North America Service Robotics Systems Revenue Share (%), by Type 2025 & 2033
- Figure 6: North America Service Robotics Systems Revenue (million), by Country 2025 & 2033
- Figure 7: North America Service Robotics Systems Revenue Share (%), by Country 2025 & 2033
- Figure 8: South America Service Robotics Systems Revenue (million), by Application 2025 & 2033
- Figure 9: South America Service Robotics Systems Revenue Share (%), by Application 2025 & 2033
- Figure 10: South America Service Robotics Systems Revenue (million), by Type 2025 & 2033
- Figure 11: South America Service Robotics Systems Revenue Share (%), by Type 2025 & 2033
- Figure 12: South America Service Robotics Systems Revenue (million), by Country 2025 & 2033
- Figure 13: South America Service Robotics Systems Revenue Share (%), by Country 2025 & 2033
- Figure 14: Europe Service Robotics Systems Revenue (million), by Application 2025 & 2033
- Figure 15: Europe Service Robotics Systems Revenue Share (%), by Application 2025 & 2033
- Figure 16: Europe Service Robotics Systems Revenue (million), by Type 2025 & 2033
- Figure 17: Europe Service Robotics Systems Revenue Share (%), by Type 2025 & 2033
- Figure 18: Europe Service Robotics Systems Revenue (million), by Country 2025 & 2033
- Figure 19: Europe Service Robotics Systems Revenue Share (%), by Country 2025 & 2033
- Figure 20: Middle East & Africa Service Robotics Systems Revenue (million), by Application 2025 & 2033
- Figure 21: Middle East & Africa Service Robotics Systems Revenue Share (%), by Application 2025 & 2033
- Figure 22: Middle East & Africa Service Robotics Systems Revenue (million), by Type 2025 & 2033
- Figure 23: Middle East & Africa Service Robotics Systems Revenue Share (%), by Type 2025 & 2033
- Figure 24: Middle East & Africa Service Robotics Systems Revenue (million), by Country 2025 & 2033
- Figure 25: Middle East & Africa Service Robotics Systems Revenue Share (%), by Country 2025 & 2033
- Figure 26: Asia Pacific Service Robotics Systems Revenue (million), by Application 2025 & 2033
- Figure 27: Asia Pacific Service Robotics Systems Revenue Share (%), by Application 2025 & 2033
- Figure 28: Asia Pacific Service Robotics Systems Revenue (million), by Type 2025 & 2033
- Figure 29: Asia Pacific Service Robotics Systems Revenue Share (%), by Type 2025 & 2033
- Figure 30: Asia Pacific Service Robotics Systems Revenue (million), by Country 2025 & 2033
- Figure 31: Asia Pacific Service Robotics Systems Revenue Share (%), by Country 2025 & 2033
List of Tables
- Table 1: Global Service Robotics Systems Revenue million Forecast, by Application 2020 & 2033
- Table 2: Global Service Robotics Systems Revenue million Forecast, by Type 2020 & 2033
- Table 3: Global Service Robotics Systems Revenue million Forecast, by Region 2020 & 2033
- Table 4: Global Service Robotics Systems Revenue million Forecast, by Application 2020 & 2033
- Table 5: Global Service Robotics Systems Revenue million Forecast, by Type 2020 & 2033
- Table 6: Global Service Robotics Systems Revenue million Forecast, by Country 2020 & 2033
- Table 7: United States Service Robotics Systems Revenue (million) Forecast, by Application 2020 & 2033
- Table 8: Canada Service Robotics Systems Revenue (million) Forecast, by Application 2020 & 2033
- Table 9: Mexico Service Robotics Systems Revenue (million) Forecast, by Application 2020 & 2033
- Table 10: Global Service Robotics Systems Revenue million Forecast, by Application 2020 & 2033
- Table 11: Global Service Robotics Systems Revenue million Forecast, by Type 2020 & 2033
- Table 12: Global Service Robotics Systems Revenue million Forecast, by Country 2020 & 2033
- Table 13: Brazil Service Robotics Systems Revenue (million) Forecast, by Application 2020 & 2033
- Table 14: Argentina Service Robotics Systems Revenue (million) Forecast, by Application 2020 & 2033
- Table 15: Rest of South America Service Robotics Systems Revenue (million) Forecast, by Application 2020 & 2033
- Table 16: Global Service Robotics Systems Revenue million Forecast, by Application 2020 & 2033
- Table 17: Global Service Robotics Systems Revenue million Forecast, by Type 2020 & 2033
- Table 18: Global Service Robotics Systems Revenue million Forecast, by Country 2020 & 2033
- Table 19: United Kingdom Service Robotics Systems Revenue (million) Forecast, by Application 2020 & 2033
- Table 20: Germany Service Robotics Systems Revenue (million) Forecast, by Application 2020 & 2033
- Table 21: France Service Robotics Systems Revenue (million) Forecast, by Application 2020 & 2033
- Table 22: Italy Service Robotics Systems Revenue (million) Forecast, by Application 2020 & 2033
- Table 23: Spain Service Robotics Systems Revenue (million) Forecast, by Application 2020 & 2033
- Table 24: Russia Service Robotics Systems Revenue (million) Forecast, by Application 2020 & 2033
- Table 25: Benelux Service Robotics Systems Revenue (million) Forecast, by Application 2020 & 2033
- Table 26: Nordics Service Robotics Systems Revenue (million) Forecast, by Application 2020 & 2033
- Table 27: Rest of Europe Service Robotics Systems Revenue (million) Forecast, by Application 2020 & 2033
- Table 28: Global Service Robotics Systems Revenue million Forecast, by Application 2020 & 2033
- Table 29: Global Service Robotics Systems Revenue million Forecast, by Type 2020 & 2033
- Table 30: Global Service Robotics Systems Revenue million Forecast, by Country 2020 & 2033
- Table 31: Turkey Service Robotics Systems Revenue (million) Forecast, by Application 2020 & 2033
- Table 32: Israel Service Robotics Systems Revenue (million) Forecast, by Application 2020 & 2033
- Table 33: GCC Service Robotics Systems Revenue (million) Forecast, by Application 2020 & 2033
- Table 34: North Africa Service Robotics Systems Revenue (million) Forecast, by Application 2020 & 2033
- Table 35: South Africa Service Robotics Systems Revenue (million) Forecast, by Application 2020 & 2033
- Table 36: Rest of Middle East & Africa Service Robotics Systems Revenue (million) Forecast, by Application 2020 & 2033
- Table 37: Global Service Robotics Systems Revenue million Forecast, by Application 2020 & 2033
- Table 38: Global Service Robotics Systems Revenue million Forecast, by Type 2020 & 2033
- Table 39: Global Service Robotics Systems Revenue million Forecast, by Country 2020 & 2033
- Table 40: China Service Robotics Systems Revenue (million) Forecast, by Application 2020 & 2033
- Table 41: India Service Robotics Systems Revenue (million) Forecast, by Application 2020 & 2033
- Table 42: Japan Service Robotics Systems Revenue (million) Forecast, by Application 2020 & 2033
- Table 43: South Korea Service Robotics Systems Revenue (million) Forecast, by Application 2020 & 2033
- Table 44: ASEAN Service Robotics Systems Revenue (million) Forecast, by Application 2020 & 2033
- Table 45: Oceania Service Robotics Systems Revenue (million) Forecast, by Application 2020 & 2033
- Table 46: Rest of Asia Pacific Service Robotics Systems Revenue (million) Forecast, by Application 2020 & 2033
Frequently Asked Questions
1. What is the projected Compound Annual Growth Rate (CAGR) of the Service Robotics Systems?
The projected CAGR is approximately 4.1%.
2. Which companies are prominent players in the Service Robotics Systems?
Key companies in the market include Northrop Grumman, iRobot Corporation, Delaval Group, Amazon, Kuka, Yaskawa Electric, Lely Group, Adept Technology, Honda Motor, Kongsberg Maritime, Aethon, Geckosystems Intl, Google, Bluefin Robotics, ECA Group.
3. What are the main segments of the Service Robotics Systems?
The market segments include Application, Type.
4. Can you provide details about the market size?
The market size is estimated to be USD 15220 million as of 2022.
5. What are some drivers contributing to market growth?
N/A
6. What are the notable trends driving market growth?
N/A
7. Are there any restraints impacting market growth?
N/A
8. Can you provide examples of recent developments in the market?
N/A
9. What pricing options are available for accessing the report?
Pricing options include single-user, multi-user, and enterprise licenses priced at USD 3950.00, USD 5925.00, and USD 7900.00 respectively.
10. Is the market size provided in terms of value or volume?
The market size is provided in terms of value, measured in million.
11. Are there any specific market keywords associated with the report?
Yes, the market keyword associated with the report is "Service Robotics Systems," which aids in identifying and referencing the specific market segment covered.
12. How do I determine which pricing option suits my needs best?
The pricing options vary based on user requirements and access needs. Individual users may opt for single-user licenses, while businesses requiring broader access may choose multi-user or enterprise licenses for cost-effective access to the report.
13. Are there any additional resources or data provided in the Service Robotics Systems report?
While the report offers comprehensive insights, it's advisable to review the specific contents or supplementary materials provided to ascertain if additional resources or data are available.
14. How can I stay updated on further developments or reports in the Service Robotics Systems?
To stay informed about further developments, trends, and reports in the Service Robotics Systems, consider subscribing to industry newsletters, following relevant companies and organizations, or regularly checking reputable industry news sources and publications.
Methodology
Step 1 - Identification of Relevant Samples Size from Population Database


Step 2 - Approaches for Defining Global Market Size (Value, Volume* & Price*)

Note*: In applicable scenarios
Step 3 - Data Sources
Primary Research
- Web Analytics
- Survey Reports
- Research Institute
- Latest Research Reports
- Opinion Leaders
Secondary Research
- Annual Reports
- White Paper
- Latest Press Release
- Industry Association
- Paid Database
- Investor Presentations

Step 4 - Data Triangulation
Involves using different sources of information in order to increase the validity of a study
These sources are likely to be stakeholders in a program - participants, other researchers, program staff, other community members, and so on.
Then we put all data in single framework & apply various statistical tools to find out the dynamic on the market.
During the analysis stage, feedback from the stakeholder groups would be compared to determine areas of agreement as well as areas of divergence

