

Key Insights
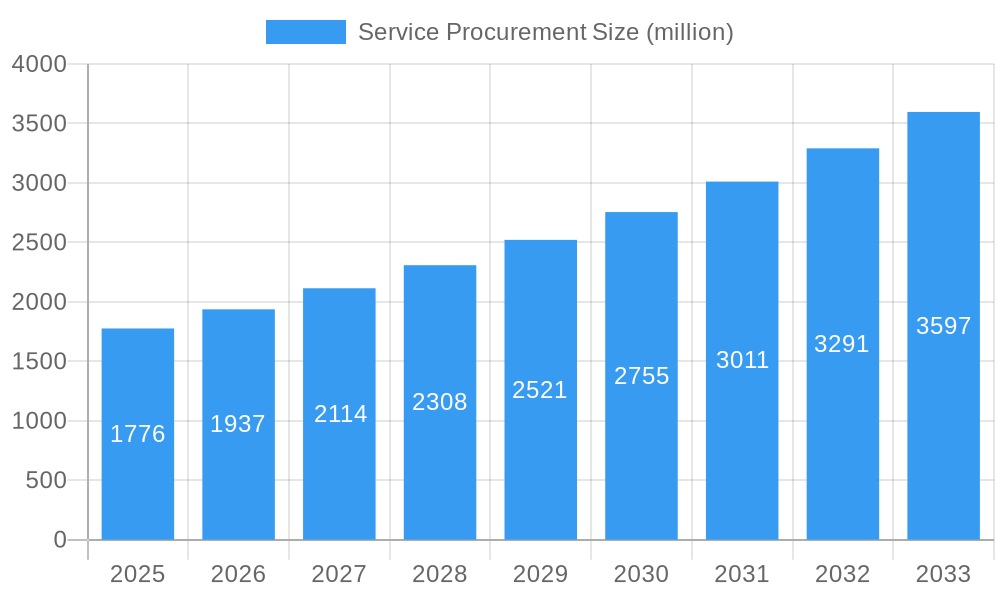
The global Service Procurement market is poised for robust expansion, projected to reach a substantial valuation of USD 1776 million by 2025. This significant growth is underpinned by a compelling Compound Annual Growth Rate (CAGR) of 9.1% anticipated from 2025 through 2033. The escalating need for streamlined vendor management, enhanced operational efficiency, and improved compliance across diverse industries is the primary engine driving this upward trajectory. Organizations are increasingly recognizing the strategic imperative of effectively managing their contingent workforce and external services to optimize costs and leverage specialized expertise. Key market drivers include the rising adoption of digital procurement platforms, the growing complexity of global supply chains, and the persistent demand for agile talent solutions. Furthermore, the shift towards remote work models and the gig economy further amplifies the reliance on flexible external resources, directly fueling the service procurement ecosystem.
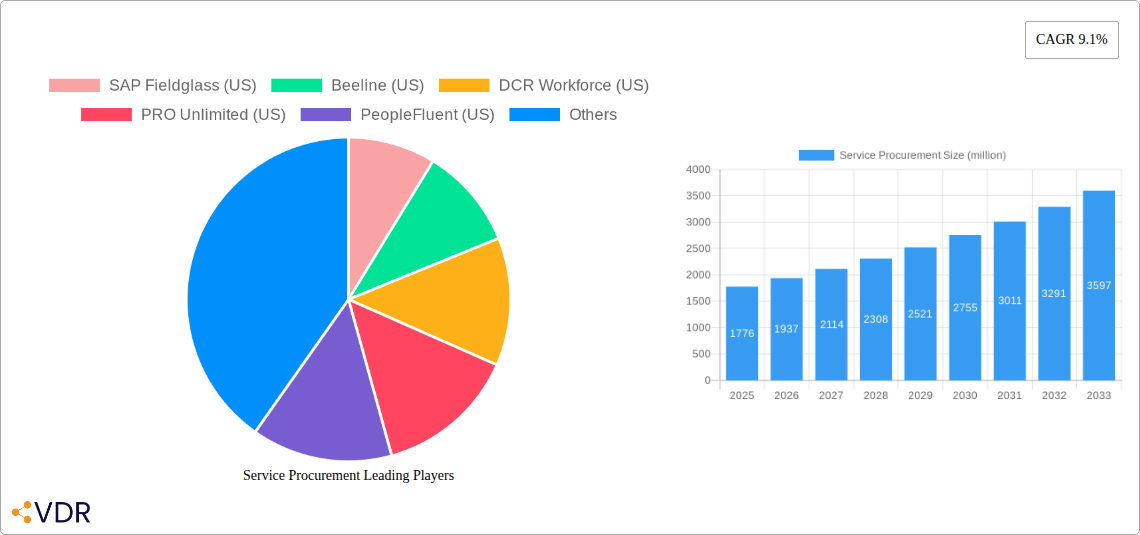
Service Procurement Market Size (In Billion)
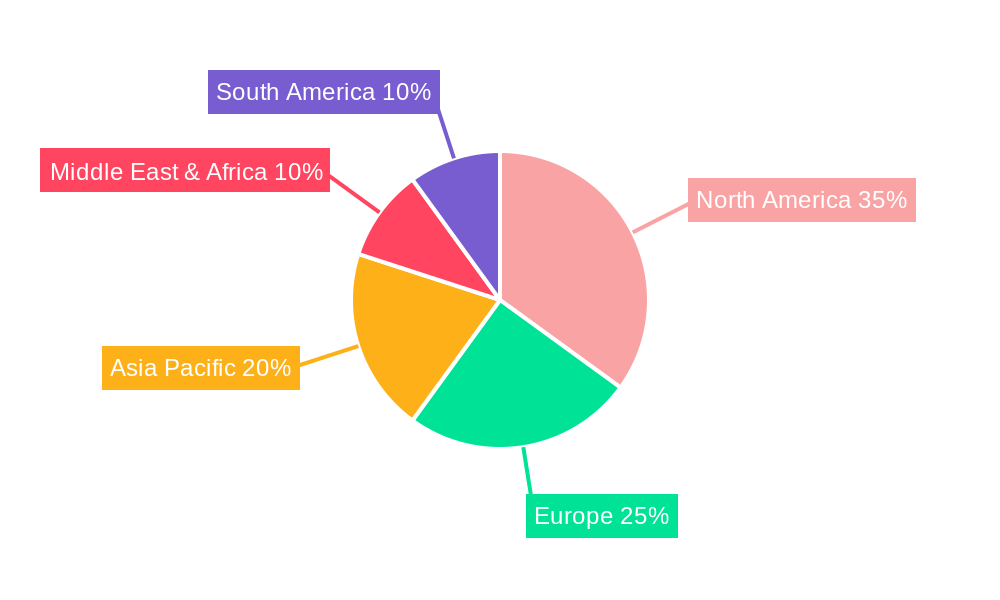
The market is segmented across various applications, with Banking, Financial Services, and Insurance (BFSI) and Telecom and IT sectors expected to lead adoption due to their high reliance on specialized external talent and complex project-based work. Manufacturing and Retail & Consumer Goods sectors are also exhibiting strong growth as they embrace service procurement for specialized projects and fluctuating operational needs. On the technology front, Contingent Workforce Management and Freelancer Management solutions are pivotal, enabling organizations to source, onboard, and manage external talent efficiently. Statement of Work (SOW) Procurement is gaining traction for its ability to define project scope, deliverables, and pricing more precisely. Geographically, North America is anticipated to maintain its dominant position, driven by early adoption and the presence of major players. However, the Asia Pacific region is expected to witness the fastest growth, propelled by rapid digitalization and increasing foreign investment. The competitive landscape is characterized by established players like SAP Fieldglass and Beeline, alongside emerging innovators, all contributing to a dynamic and evolving market.
Service Procurement Company Market Share
Comprehensive Report: Global Service Procurement Market Analysis 2025-2033
This in-depth report provides a strategic analysis of the global Service Procurement market, essential for understanding its evolving dynamics and forecasting future growth. We deliver critical insights into market structure, key players, growth trends, regional dominance, and product innovation, all presented with actionable data and expert analysis. Leveraging a robust dataset, this report covers the historical period from 2019-2024, with a base year of 2025 and a forecast period extending to 2033. Gain a competitive edge by understanding the parent and child market influences, technological advancements, and regulatory landscapes shaping this critical business function.
Service Procurement Market Dynamics & Structure
The global Service Procurement market is characterized by a dynamic and evolving structure, influenced by a confluence of technological innovation, stringent regulatory frameworks, and the constant need for competitive differentiation. Market concentration varies across segments, with some areas witnessing consolidation and others fostering a more fragmented competitive landscape. Technological advancements are the primary drivers, enabling greater efficiency in sourcing, engagement, and management of external services. Artificial intelligence, machine learning, and advanced analytics are revolutionizing how organizations identify, vet, and manage service providers, particularly in contingent workforce management and Statement of Work (SOW) procurement.
- Market Concentration: Moderately concentrated, with increasing consolidation in core areas like Contingent Workforce Management.
- Technological Innovation Drivers: AI-powered sourcing platforms, blockchain for contract transparency, predictive analytics for vendor performance.
- Regulatory Frameworks: Increasing compliance demands in data privacy (GDPR, CCPA), labor laws, and ethical sourcing practices.
- Competitive Product Substitutes: Internal resource management for certain services, broader ERP solutions with integrated procurement modules.
- End-User Demographics: Growing adoption by enterprises of all sizes seeking to optimize spend, improve agility, and access specialized talent.
- M&A Trends: Active consolidation driven by companies seeking to expand service offerings, gain market share, and acquire innovative technologies. Notable deal volume in the last three years is estimated at over $500 million, with several strategic acquisitions focused on expanding freelancer management capabilities and SOW procurement platforms.
Service Procurement Growth Trends & Insights
The global Service Procurement market is experiencing robust growth, driven by the increasing reliance of enterprises on flexible talent pools and specialized services to navigate complex business environments. The market size is projected to expand significantly, propelled by higher adoption rates of advanced procurement solutions. Technological disruptions are continuously reshaping the landscape, with cloud-based platforms becoming the standard for enhanced accessibility and scalability. Consumer behavior shifts, particularly the rise of the gig economy and remote work, have further accelerated the demand for sophisticated freelancer management and contingent workforce solutions. This evolution signifies a fundamental change in how organizations approach talent acquisition and service delivery.
- Market Size Evolution: The market is projected to grow from an estimated $45,000 million in 2025 to over $90,000 million by 2033, exhibiting a Compound Annual Growth Rate (CAGR) of approximately 9%.
- Adoption Rates: High and accelerating adoption of integrated Service Procurement platforms across all major industries, driven by cost savings and operational efficiency mandates.
- Technological Disruptions: The integration of AI for intelligent sourcing, automated contract management, and real-time performance analytics is becoming mainstream. Blockchain technology is gaining traction for enhanced transparency and security in SOW procurement.
- Consumer Behavior Shifts: Increased preference for flexible work arrangements by talent, leading enterprises to adopt platforms supporting freelance and gig economy workers. Demand for specialized skills is driving growth in niche talent marketplaces.
- Market Penetration: Estimated market penetration for comprehensive Service Procurement solutions stands at 65% in developed economies and is rapidly growing in emerging markets.
- Digital Transformation Impact: The broader digital transformation initiatives within enterprises are a key catalyst, pushing for modernization of procurement processes and greater integration with HR and finance functions.
Dominant Regions, Countries, or Segments in Service Procurement
The global Service Procurement market's dominance is multifaceted, with specific regions, countries, and industry segments acting as key growth engines. North America, particularly the United States, continues to lead due to its mature market for contingent workforce management and a high concentration of large enterprises with sophisticated procurement needs. The Banking, Financial Services, and Insurance (BFSI) sector consistently exhibits strong demand for service procurement solutions, driven by regulatory pressures, the need for specialized IT expertise, and the continuous evolution of financial technologies. Within the "Type" segment, Contingent Workforce Management remains the largest and most influential, encompassing a broad range of services and talent acquisition strategies.
- Leading Region: North America, driven by early adoption and innovation in the US market.
- Key Country: United States, accounting for over 50% of the global market value in 2025.
- Dominant Application Segment: Banking, Financial Services, and Insurance (BFSI) sector, valued at an estimated $12,000 million in 2025, due to its critical reliance on specialized IT, compliance, and consulting services.
- Dominant Type Segment: Contingent Workforce Management, representing over 40% of the total market value. This segment is critical for managing flexible labor, reducing overheads, and accessing diverse skill sets.
- Growth Potential in Telecom and IT: The Telecom and IT sector is a significant growth driver, with an estimated market size of $9,500 million in 2025, fueled by digital transformation initiatives and the demand for advanced technology services.
- Emerging Market Dynamics: Asia-Pacific, particularly countries like India and China, is showing rapid growth in Service Procurement adoption, driven by economic expansion and increasing foreign investment.
- Government Sector Focus: The Government segment, estimated at $6,000 million in 2025, is increasingly leveraging service procurement for specialized projects and digital service delivery, adhering to strict procurement regulations.
- Manufacturing Sector Needs: The Manufacturing sector, valued at $7,000 million in 2025, utilizes service procurement for specialized engineering, maintenance, and operational support, aiming for greater efficiency and reduced production costs.
- Healthcare and Life Sciences Adoption: This segment, worth $7,500 million in 2025, is seeing increased adoption of service procurement for R&D, clinical trials, and specialized IT solutions, with a strong emphasis on compliance and data security.
Service Procurement Product Landscape
The Service Procurement product landscape is characterized by continuous innovation, focusing on delivering enhanced efficiency, transparency, and strategic value. Key product advancements include AI-driven sourcing engines that intelligently match needs with providers, predictive analytics for vendor performance assessment, and robust compliance modules ensuring adherence to labor laws and data privacy regulations. Statement of Work (SOW) procurement platforms are evolving to offer end-to-end management, from project definition and budgeting to execution oversight and payment. Unique selling propositions often lie in the seamless integration of these functionalities, providing a unified view of all external service engagements. Performance metrics are increasingly sophisticated, measuring not just cost savings but also talent quality, speed to market, and risk mitigation.
Key Drivers, Barriers & Challenges in Service Procurement
The global Service Procurement market is propelled by several key drivers, including the relentless pursuit of cost optimization by enterprises, the growing need for specialized skills in a rapidly changing technological landscape, and the inherent flexibility offered by contingent workforce models. Government initiatives promoting digitalization and the increasing trend of outsourcing non-core functions further fuel market expansion. Technological advancements, particularly in AI and automation, are making service procurement more efficient and data-driven.
However, the market also faces significant barriers and challenges. Supply chain disruptions, exacerbated by global events, can impact the availability and cost of specialized services. Navigating complex regulatory environments across different geographies and ensuring compliance with labor laws are persistent hurdles. Intense competitive pressures and the potential for poor vendor performance can also restrain growth. The challenge of managing data security and privacy when engaging external service providers, especially in sensitive sectors like BFSI and Healthcare, remains a critical concern, impacting adoption rates and requiring robust security protocols.
Emerging Opportunities in Service Procurement
Emerging opportunities in the Service Procurement market are abundant, driven by evolving business models and technological advancements. The expanding gig economy presents a vast untapped market for platforms that can effectively source, manage, and onboard freelance talent for specialized projects. Innovative applications of AI and machine learning in predictive analytics for talent acquisition and vendor risk assessment offer significant growth potential. Furthermore, the increasing demand for sustainability and ethical sourcing in procurement processes creates opportunities for platforms that can verify and report on these aspects of service providers. The growing emphasis on diverse supplier inclusion also opens new avenues for specialized sourcing solutions.
Growth Accelerators in the Service Procurement Industry
Several catalysts are accelerating long-term growth in the Service Procurement industry. Technological breakthroughs, such as advanced AI algorithms for talent matching and automated contract negotiation, are significantly enhancing operational efficiency and cost-effectiveness. Strategic partnerships between service procurement technology providers and HR tech companies are creating integrated ecosystems, offering end-to-end workforce solutions. Furthermore, market expansion strategies targeting emerging economies, coupled with the increasing digitalization of businesses worldwide, are creating substantial opportunities for growth. The growing recognition of service procurement as a strategic function, rather than just an operational task, is also a major growth accelerator.
Key Players Shaping the Service Procurement Market
- SAP Fieldglass
- Beeline
- DCR Workforce
- PRO Unlimited
- PeopleFluent
- Provade
- PIXID
- Upwork
- Field Nation
- WorkMarket
- Superior Group
- Enlighta
- TargetRecruit
Notable Milestones in Service Procurement Sector
- 2020: Increased adoption of remote work technologies, boosting demand for virtual collaboration tools within service procurement.
- 2021: Enhanced focus on AI and automation in sourcing and vendor management platforms, leading to more efficient operations.
- 2022: Significant M&A activity, with larger players acquiring innovative startups to expand capabilities in freelancer management and SOW procurement.
- 2023: Growing regulatory scrutiny around data privacy and gig worker classifications, prompting enhanced compliance features in procurement solutions.
- 2024: Introduction of advanced analytics dashboards for real-time spend visibility and performance benchmarking across external services.
In-Depth Service Procurement Market Outlook
The future of the Service Procurement market is exceptionally promising, driven by the ongoing digital transformation across industries and the persistent need for agile, specialized talent. Growth accelerators, including advanced AI for talent acquisition, strategic partnerships creating integrated workforce solutions, and expansive market penetration into emerging economies, will continue to fuel expansion. The evolving preference for flexible work models will further solidify the importance of robust contingent workforce and freelancer management solutions. Strategic opportunities lie in developing hyper-personalized sourcing capabilities, enhancing end-to-end SOW management with blockchain integration, and providing comprehensive analytics for strategic decision-making, all contributing to a projected market valuation of over $90,000 million by 2033.
Service Procurement Segmentation
-
1. Application
- 1.1. Banking, Financial Services, and Insurance
- 1.2. Telecom and IT
- 1.3. Manufacturing
- 1.4. Retail and Consumer goods
- 1.5. Government
- 1.6. Healthcare and Life Sciences
- 1.7. Transportation and Logistics
- 1.8. Energy and Utilities
- 1.9. Others
-
2. Type
- 2.1. Contingent Workforce Management
- 2.2. Freelancer Management
- 2.3. Statement of Work Procurement
- 2.4. Services Governance and MSA Management
- 2.5. Analytics and Reporting
- 2.6. Resource Sourcing and Tracking
Service Procurement Segmentation By Geography
-
1. North America
- 1.1. United States
- 1.2. Canada
- 1.3. Mexico
-
2. South America
- 2.1. Brazil
- 2.2. Argentina
- 2.3. Rest of South America
-
3. Europe
- 3.1. United Kingdom
- 3.2. Germany
- 3.3. France
- 3.4. Italy
- 3.5. Spain
- 3.6. Russia
- 3.7. Benelux
- 3.8. Nordics
- 3.9. Rest of Europe
-
4. Middle East & Africa
- 4.1. Turkey
- 4.2. Israel
- 4.3. GCC
- 4.4. North Africa
- 4.5. South Africa
- 4.6. Rest of Middle East & Africa
-
5. Asia Pacific
- 5.1. China
- 5.2. India
- 5.3. Japan
- 5.4. South Korea
- 5.5. ASEAN
- 5.6. Oceania
- 5.7. Rest of Asia Pacific
Service Procurement Regional Market Share
Geographic Coverage of Service Procurement
Service Procurement REPORT HIGHLIGHTS
| Aspects | Details |
|---|---|
| Study Period | 2020-2034 |
| Base Year | 2025 |
| Estimated Year | 2026 |
| Forecast Period | 2026-2034 |
| Historical Period | 2020-2025 |
| Growth Rate | CAGR of 9.1% from 2020-2034 |
| Segmentation |
|
Table of Contents
- 1. Introduction
- 1.1. Research Scope
- 1.2. Market Segmentation
- 1.3. Research Objective
- 1.4. Definitions and Assumptions
- 2. Executive Summary
- 2.1. Market Snapshot
- 3. Market Dynamics
- 3.1. Market Drivers
- 3.2. Market Restrains
- 3.3. Market Trends
- 3.4. Market Opportunities
- 4. Market Factor Analysis
- 4.1. Porters Five Forces
- 4.1.1. Bargaining Power of Suppliers
- 4.1.2. Bargaining Power of Buyers
- 4.1.3. Threat of New Entrants
- 4.1.4. Threat of Substitutes
- 4.1.5. Competitive Rivalry
- 4.2. PESTEL analysis
- 4.3. BCG Analysis
- 4.3.1. Stars (High Growth, High Market Share)
- 4.3.2. Cash Cows (Low Growth, High Market Share)
- 4.3.3. Question Mark (High Growth, Low Market Share)
- 4.3.4. Dogs (Low Growth, Low Market Share)
- 4.4. Ansoff Matrix Analysis
- 4.5. Supply Chain Analysis
- 4.6. Regulatory Landscape
- 4.7. Current Market Potential and Opportunity Assessment (TAM–SAM–SOM Framework)
- 4.8. VDR Analyst Note
- 4.1. Porters Five Forces
- 5. Market Analysis, Insights and Forecast 2021-2033
- 5.1. Market Analysis, Insights and Forecast - by Application
- 5.1.1. Banking, Financial Services, and Insurance
- 5.1.2. Telecom and IT
- 5.1.3. Manufacturing
- 5.1.4. Retail and Consumer goods
- 5.1.5. Government
- 5.1.6. Healthcare and Life Sciences
- 5.1.7. Transportation and Logistics
- 5.1.8. Energy and Utilities
- 5.1.9. Others
- 5.2. Market Analysis, Insights and Forecast - by Type
- 5.2.1. Contingent Workforce Management
- 5.2.2. Freelancer Management
- 5.2.3. Statement of Work Procurement
- 5.2.4. Services Governance and MSA Management
- 5.2.5. Analytics and Reporting
- 5.2.6. Resource Sourcing and Tracking
- 5.3. Market Analysis, Insights and Forecast - by Region
- 5.3.1. North America
- 5.3.2. South America
- 5.3.3. Europe
- 5.3.4. Middle East & Africa
- 5.3.5. Asia Pacific
- 5.1. Market Analysis, Insights and Forecast - by Application
- 6. Global Service Procurement Analysis, Insights and Forecast, 2021-2033
- 6.1. Market Analysis, Insights and Forecast - by Application
- 6.1.1. Banking, Financial Services, and Insurance
- 6.1.2. Telecom and IT
- 6.1.3. Manufacturing
- 6.1.4. Retail and Consumer goods
- 6.1.5. Government
- 6.1.6. Healthcare and Life Sciences
- 6.1.7. Transportation and Logistics
- 6.1.8. Energy and Utilities
- 6.1.9. Others
- 6.2. Market Analysis, Insights and Forecast - by Type
- 6.2.1. Contingent Workforce Management
- 6.2.2. Freelancer Management
- 6.2.3. Statement of Work Procurement
- 6.2.4. Services Governance and MSA Management
- 6.2.5. Analytics and Reporting
- 6.2.6. Resource Sourcing and Tracking
- 6.1. Market Analysis, Insights and Forecast - by Application
- 7. North America Service Procurement Analysis, Insights and Forecast, 2021-2033
- 7.1. Market Analysis, Insights and Forecast - by Application
- 7.1.1. Banking, Financial Services, and Insurance
- 7.1.2. Telecom and IT
- 7.1.3. Manufacturing
- 7.1.4. Retail and Consumer goods
- 7.1.5. Government
- 7.1.6. Healthcare and Life Sciences
- 7.1.7. Transportation and Logistics
- 7.1.8. Energy and Utilities
- 7.1.9. Others
- 7.2. Market Analysis, Insights and Forecast - by Type
- 7.2.1. Contingent Workforce Management
- 7.2.2. Freelancer Management
- 7.2.3. Statement of Work Procurement
- 7.2.4. Services Governance and MSA Management
- 7.2.5. Analytics and Reporting
- 7.2.6. Resource Sourcing and Tracking
- 7.1. Market Analysis, Insights and Forecast - by Application
- 8. South America Service Procurement Analysis, Insights and Forecast, 2021-2033
- 8.1. Market Analysis, Insights and Forecast - by Application
- 8.1.1. Banking, Financial Services, and Insurance
- 8.1.2. Telecom and IT
- 8.1.3. Manufacturing
- 8.1.4. Retail and Consumer goods
- 8.1.5. Government
- 8.1.6. Healthcare and Life Sciences
- 8.1.7. Transportation and Logistics
- 8.1.8. Energy and Utilities
- 8.1.9. Others
- 8.2. Market Analysis, Insights and Forecast - by Type
- 8.2.1. Contingent Workforce Management
- 8.2.2. Freelancer Management
- 8.2.3. Statement of Work Procurement
- 8.2.4. Services Governance and MSA Management
- 8.2.5. Analytics and Reporting
- 8.2.6. Resource Sourcing and Tracking
- 8.1. Market Analysis, Insights and Forecast - by Application
- 9. Europe Service Procurement Analysis, Insights and Forecast, 2021-2033
- 9.1. Market Analysis, Insights and Forecast - by Application
- 9.1.1. Banking, Financial Services, and Insurance
- 9.1.2. Telecom and IT
- 9.1.3. Manufacturing
- 9.1.4. Retail and Consumer goods
- 9.1.5. Government
- 9.1.6. Healthcare and Life Sciences
- 9.1.7. Transportation and Logistics
- 9.1.8. Energy and Utilities
- 9.1.9. Others
- 9.2. Market Analysis, Insights and Forecast - by Type
- 9.2.1. Contingent Workforce Management
- 9.2.2. Freelancer Management
- 9.2.3. Statement of Work Procurement
- 9.2.4. Services Governance and MSA Management
- 9.2.5. Analytics and Reporting
- 9.2.6. Resource Sourcing and Tracking
- 9.1. Market Analysis, Insights and Forecast - by Application
- 10. Middle East & Africa Service Procurement Analysis, Insights and Forecast, 2021-2033
- 10.1. Market Analysis, Insights and Forecast - by Application
- 10.1.1. Banking, Financial Services, and Insurance
- 10.1.2. Telecom and IT
- 10.1.3. Manufacturing
- 10.1.4. Retail and Consumer goods
- 10.1.5. Government
- 10.1.6. Healthcare and Life Sciences
- 10.1.7. Transportation and Logistics
- 10.1.8. Energy and Utilities
- 10.1.9. Others
- 10.2. Market Analysis, Insights and Forecast - by Type
- 10.2.1. Contingent Workforce Management
- 10.2.2. Freelancer Management
- 10.2.3. Statement of Work Procurement
- 10.2.4. Services Governance and MSA Management
- 10.2.5. Analytics and Reporting
- 10.2.6. Resource Sourcing and Tracking
- 10.1. Market Analysis, Insights and Forecast - by Application
- 11. Asia Pacific Service Procurement Analysis, Insights and Forecast, 2021-2033
- 11.1. Market Analysis, Insights and Forecast - by Application
- 11.1.1. Banking, Financial Services, and Insurance
- 11.1.2. Telecom and IT
- 11.1.3. Manufacturing
- 11.1.4. Retail and Consumer goods
- 11.1.5. Government
- 11.1.6. Healthcare and Life Sciences
- 11.1.7. Transportation and Logistics
- 11.1.8. Energy and Utilities
- 11.1.9. Others
- 11.2. Market Analysis, Insights and Forecast - by Type
- 11.2.1. Contingent Workforce Management
- 11.2.2. Freelancer Management
- 11.2.3. Statement of Work Procurement
- 11.2.4. Services Governance and MSA Management
- 11.2.5. Analytics and Reporting
- 11.2.6. Resource Sourcing and Tracking
- 11.1. Market Analysis, Insights and Forecast - by Application
- 12. Competitive Analysis
- 12.1. Company Profiles
- 12.1.1 SAP Fieldglass (US)
- 12.1.1.1. Company Overview
- 12.1.1.2. Products
- 12.1.1.3. Company Financials
- 12.1.1.4. SWOT Analysis
- 12.1.2 Beeline (US)
- 12.1.2.1. Company Overview
- 12.1.2.2. Products
- 12.1.2.3. Company Financials
- 12.1.2.4. SWOT Analysis
- 12.1.3 DCR Workforce (US)
- 12.1.3.1. Company Overview
- 12.1.3.2. Products
- 12.1.3.3. Company Financials
- 12.1.3.4. SWOT Analysis
- 12.1.4 PRO Unlimited (US)
- 12.1.4.1. Company Overview
- 12.1.4.2. Products
- 12.1.4.3. Company Financials
- 12.1.4.4. SWOT Analysis
- 12.1.5 PeopleFluent (US)
- 12.1.5.1. Company Overview
- 12.1.5.2. Products
- 12.1.5.3. Company Financials
- 12.1.5.4. SWOT Analysis
- 12.1.6 Provade (US)
- 12.1.6.1. Company Overview
- 12.1.6.2. Products
- 12.1.6.3. Company Financials
- 12.1.6.4. SWOT Analysis
- 12.1.7 PIXID (France)
- 12.1.7.1. Company Overview
- 12.1.7.2. Products
- 12.1.7.3. Company Financials
- 12.1.7.4. SWOT Analysis
- 12.1.8 Upwork (US)
- 12.1.8.1. Company Overview
- 12.1.8.2. Products
- 12.1.8.3. Company Financials
- 12.1.8.4. SWOT Analysis
- 12.1.9 Field Nation (US)
- 12.1.9.1. Company Overview
- 12.1.9.2. Products
- 12.1.9.3. Company Financials
- 12.1.9.4. SWOT Analysis
- 12.1.10 WorkMarket (US)
- 12.1.10.1. Company Overview
- 12.1.10.2. Products
- 12.1.10.3. Company Financials
- 12.1.10.4. SWOT Analysis
- 12.1.11 Superior Group (US)
- 12.1.11.1. Company Overview
- 12.1.11.2. Products
- 12.1.11.3. Company Financials
- 12.1.11.4. SWOT Analysis
- 12.1.12 Enlighta (US)
- 12.1.12.1. Company Overview
- 12.1.12.2. Products
- 12.1.12.3. Company Financials
- 12.1.12.4. SWOT Analysis
- 12.1.13 TargetRecruit (US)
- 12.1.13.1. Company Overview
- 12.1.13.2. Products
- 12.1.13.3. Company Financials
- 12.1.13.4. SWOT Analysis
- 12.1.1 SAP Fieldglass (US)
- 12.2. Market Entropy
- 12.2.1 Company's Key Areas Served
- 12.2.2 Recent Developments
- 12.3. Company Market Share Analysis 2025
- 12.3.1 Top 5 Companies Market Share Analysis
- 12.3.2 Top 3 Companies Market Share Analysis
- 12.4. List of Potential Customers
- 13. Research Methodology
List of Figures
- Figure 1: Global Service Procurement Revenue Breakdown (undefined, %) by Region 2025 & 2033
- Figure 2: North America Service Procurement Revenue (undefined), by Application 2025 & 2033
- Figure 3: North America Service Procurement Revenue Share (%), by Application 2025 & 2033
- Figure 4: North America Service Procurement Revenue (undefined), by Type 2025 & 2033
- Figure 5: North America Service Procurement Revenue Share (%), by Type 2025 & 2033
- Figure 6: North America Service Procurement Revenue (undefined), by Country 2025 & 2033
- Figure 7: North America Service Procurement Revenue Share (%), by Country 2025 & 2033
- Figure 8: South America Service Procurement Revenue (undefined), by Application 2025 & 2033
- Figure 9: South America Service Procurement Revenue Share (%), by Application 2025 & 2033
- Figure 10: South America Service Procurement Revenue (undefined), by Type 2025 & 2033
- Figure 11: South America Service Procurement Revenue Share (%), by Type 2025 & 2033
- Figure 12: South America Service Procurement Revenue (undefined), by Country 2025 & 2033
- Figure 13: South America Service Procurement Revenue Share (%), by Country 2025 & 2033
- Figure 14: Europe Service Procurement Revenue (undefined), by Application 2025 & 2033
- Figure 15: Europe Service Procurement Revenue Share (%), by Application 2025 & 2033
- Figure 16: Europe Service Procurement Revenue (undefined), by Type 2025 & 2033
- Figure 17: Europe Service Procurement Revenue Share (%), by Type 2025 & 2033
- Figure 18: Europe Service Procurement Revenue (undefined), by Country 2025 & 2033
- Figure 19: Europe Service Procurement Revenue Share (%), by Country 2025 & 2033
- Figure 20: Middle East & Africa Service Procurement Revenue (undefined), by Application 2025 & 2033
- Figure 21: Middle East & Africa Service Procurement Revenue Share (%), by Application 2025 & 2033
- Figure 22: Middle East & Africa Service Procurement Revenue (undefined), by Type 2025 & 2033
- Figure 23: Middle East & Africa Service Procurement Revenue Share (%), by Type 2025 & 2033
- Figure 24: Middle East & Africa Service Procurement Revenue (undefined), by Country 2025 & 2033
- Figure 25: Middle East & Africa Service Procurement Revenue Share (%), by Country 2025 & 2033
- Figure 26: Asia Pacific Service Procurement Revenue (undefined), by Application 2025 & 2033
- Figure 27: Asia Pacific Service Procurement Revenue Share (%), by Application 2025 & 2033
- Figure 28: Asia Pacific Service Procurement Revenue (undefined), by Type 2025 & 2033
- Figure 29: Asia Pacific Service Procurement Revenue Share (%), by Type 2025 & 2033
- Figure 30: Asia Pacific Service Procurement Revenue (undefined), by Country 2025 & 2033
- Figure 31: Asia Pacific Service Procurement Revenue Share (%), by Country 2025 & 2033
List of Tables
- Table 1: Global Service Procurement Revenue undefined Forecast, by Application 2020 & 2033
- Table 2: Global Service Procurement Revenue undefined Forecast, by Type 2020 & 2033
- Table 3: Global Service Procurement Revenue undefined Forecast, by Region 2020 & 2033
- Table 4: Global Service Procurement Revenue undefined Forecast, by Application 2020 & 2033
- Table 5: Global Service Procurement Revenue undefined Forecast, by Type 2020 & 2033
- Table 6: Global Service Procurement Revenue undefined Forecast, by Country 2020 & 2033
- Table 7: United States Service Procurement Revenue (undefined) Forecast, by Application 2020 & 2033
- Table 8: Canada Service Procurement Revenue (undefined) Forecast, by Application 2020 & 2033
- Table 9: Mexico Service Procurement Revenue (undefined) Forecast, by Application 2020 & 2033
- Table 10: Global Service Procurement Revenue undefined Forecast, by Application 2020 & 2033
- Table 11: Global Service Procurement Revenue undefined Forecast, by Type 2020 & 2033
- Table 12: Global Service Procurement Revenue undefined Forecast, by Country 2020 & 2033
- Table 13: Brazil Service Procurement Revenue (undefined) Forecast, by Application 2020 & 2033
- Table 14: Argentina Service Procurement Revenue (undefined) Forecast, by Application 2020 & 2033
- Table 15: Rest of South America Service Procurement Revenue (undefined) Forecast, by Application 2020 & 2033
- Table 16: Global Service Procurement Revenue undefined Forecast, by Application 2020 & 2033
- Table 17: Global Service Procurement Revenue undefined Forecast, by Type 2020 & 2033
- Table 18: Global Service Procurement Revenue undefined Forecast, by Country 2020 & 2033
- Table 19: United Kingdom Service Procurement Revenue (undefined) Forecast, by Application 2020 & 2033
- Table 20: Germany Service Procurement Revenue (undefined) Forecast, by Application 2020 & 2033
- Table 21: France Service Procurement Revenue (undefined) Forecast, by Application 2020 & 2033
- Table 22: Italy Service Procurement Revenue (undefined) Forecast, by Application 2020 & 2033
- Table 23: Spain Service Procurement Revenue (undefined) Forecast, by Application 2020 & 2033
- Table 24: Russia Service Procurement Revenue (undefined) Forecast, by Application 2020 & 2033
- Table 25: Benelux Service Procurement Revenue (undefined) Forecast, by Application 2020 & 2033
- Table 26: Nordics Service Procurement Revenue (undefined) Forecast, by Application 2020 & 2033
- Table 27: Rest of Europe Service Procurement Revenue (undefined) Forecast, by Application 2020 & 2033
- Table 28: Global Service Procurement Revenue undefined Forecast, by Application 2020 & 2033
- Table 29: Global Service Procurement Revenue undefined Forecast, by Type 2020 & 2033
- Table 30: Global Service Procurement Revenue undefined Forecast, by Country 2020 & 2033
- Table 31: Turkey Service Procurement Revenue (undefined) Forecast, by Application 2020 & 2033
- Table 32: Israel Service Procurement Revenue (undefined) Forecast, by Application 2020 & 2033
- Table 33: GCC Service Procurement Revenue (undefined) Forecast, by Application 2020 & 2033
- Table 34: North Africa Service Procurement Revenue (undefined) Forecast, by Application 2020 & 2033
- Table 35: South Africa Service Procurement Revenue (undefined) Forecast, by Application 2020 & 2033
- Table 36: Rest of Middle East & Africa Service Procurement Revenue (undefined) Forecast, by Application 2020 & 2033
- Table 37: Global Service Procurement Revenue undefined Forecast, by Application 2020 & 2033
- Table 38: Global Service Procurement Revenue undefined Forecast, by Type 2020 & 2033
- Table 39: Global Service Procurement Revenue undefined Forecast, by Country 2020 & 2033
- Table 40: China Service Procurement Revenue (undefined) Forecast, by Application 2020 & 2033
- Table 41: India Service Procurement Revenue (undefined) Forecast, by Application 2020 & 2033
- Table 42: Japan Service Procurement Revenue (undefined) Forecast, by Application 2020 & 2033
- Table 43: South Korea Service Procurement Revenue (undefined) Forecast, by Application 2020 & 2033
- Table 44: ASEAN Service Procurement Revenue (undefined) Forecast, by Application 2020 & 2033
- Table 45: Oceania Service Procurement Revenue (undefined) Forecast, by Application 2020 & 2033
- Table 46: Rest of Asia Pacific Service Procurement Revenue (undefined) Forecast, by Application 2020 & 2033
Frequently Asked Questions
1. What is the projected Compound Annual Growth Rate (CAGR) of the Service Procurement?
The projected CAGR is approximately 9.1%.
2. Which companies are prominent players in the Service Procurement?
Key companies in the market include SAP Fieldglass (US), Beeline (US), DCR Workforce (US), PRO Unlimited (US), PeopleFluent (US), Provade (US), PIXID (France), Upwork (US), Field Nation (US), WorkMarket (US), Superior Group (US), Enlighta (US), TargetRecruit (US).
3. What are the main segments of the Service Procurement?
The market segments include Application, Type.
4. Can you provide details about the market size?
The market size is estimated to be USD XXX N/A as of 2022.
5. What are some drivers contributing to market growth?
N/A
6. What are the notable trends driving market growth?
N/A
7. Are there any restraints impacting market growth?
N/A
8. Can you provide examples of recent developments in the market?
N/A
9. What pricing options are available for accessing the report?
Pricing options include single-user, multi-user, and enterprise licenses priced at USD 3950.00, USD 5925.00, and USD 7900.00 respectively.
10. Is the market size provided in terms of value or volume?
The market size is provided in terms of value, measured in N/A.
11. Are there any specific market keywords associated with the report?
Yes, the market keyword associated with the report is "Service Procurement," which aids in identifying and referencing the specific market segment covered.
12. How do I determine which pricing option suits my needs best?
The pricing options vary based on user requirements and access needs. Individual users may opt for single-user licenses, while businesses requiring broader access may choose multi-user or enterprise licenses for cost-effective access to the report.
13. Are there any additional resources or data provided in the Service Procurement report?
While the report offers comprehensive insights, it's advisable to review the specific contents or supplementary materials provided to ascertain if additional resources or data are available.
14. How can I stay updated on further developments or reports in the Service Procurement?
To stay informed about further developments, trends, and reports in the Service Procurement, consider subscribing to industry newsletters, following relevant companies and organizations, or regularly checking reputable industry news sources and publications.
Methodology
Step 1 - Identification of Relevant Samples Size from Population Database


Step 2 - Approaches for Defining Global Market Size (Value, Volume* & Price*)

Note*: In applicable scenarios
Step 3 - Data Sources
Primary Research
- Web Analytics
- Survey Reports
- Research Institute
- Latest Research Reports
- Opinion Leaders
Secondary Research
- Annual Reports
- White Paper
- Latest Press Release
- Industry Association
- Paid Database
- Investor Presentations

Step 4 - Data Triangulation
Involves using different sources of information in order to increase the validity of a study
These sources are likely to be stakeholders in a program - participants, other researchers, program staff, other community members, and so on.
Then we put all data in single framework & apply various statistical tools to find out the dynamic on the market.
During the analysis stage, feedback from the stakeholder groups would be compared to determine areas of agreement as well as areas of divergence