
Key Insights
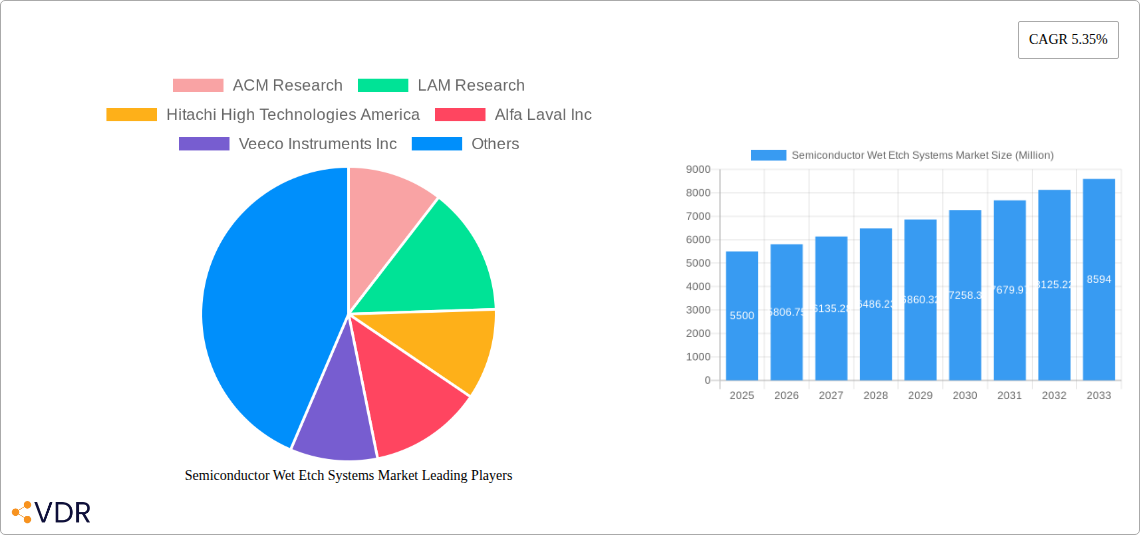
The Semiconductor Wet Etch Systems market is poised for robust growth, projected to reach a value of $5.5 billion in 2025 and exhibiting a Compound Annual Growth Rate (CAGR) of 5.35% from 2025 to 2033. This expansion is driven primarily by the surging demand for advanced semiconductor devices across various applications, including 5G infrastructure, high-performance computing (HPC), and artificial intelligence (AI). Miniaturization trends in semiconductor manufacturing necessitate increasingly precise and efficient etching processes, fueling the adoption of advanced wet etch systems. The increasing complexity of chip designs further contributes to market growth as manufacturers seek solutions to handle intricate patterns and materials. Technological advancements, such as the development of new chemistries and improved process control systems, are also contributing factors. However, challenges remain, including the high capital expenditure required for these systems and the need for skilled personnel to operate and maintain them. Furthermore, environmental regulations concerning the disposal of chemical etchants represent a potential constraint.
The competitive landscape is characterized by a mix of established players and emerging companies. Key players like ACM Research, LAM Research, and Hitachi High Technologies America hold significant market share, leveraging their extensive experience and technological expertise. However, innovative smaller companies are also emerging, particularly in niche areas focusing on specialized etching techniques and environmentally friendly solutions. Regional growth is expected to vary, with established semiconductor manufacturing hubs in North America and Asia experiencing the strongest growth, driven by robust investments in fabrication facilities and the increasing concentration of semiconductor production in these regions. The market's future trajectory will depend on several factors, including the pace of technological innovation, evolving industry regulations, and the overall health of the global semiconductor industry. Continued investment in research and development, alongside strategic partnerships and acquisitions, will be crucial for companies to maintain a competitive edge in this dynamic market.
Semiconductor Wet Etch Systems Market: A Comprehensive Report (2019-2033)
This in-depth report provides a comprehensive analysis of the Semiconductor Wet Etch Systems market, encompassing market dynamics, growth trends, regional dominance, product landscape, key challenges, emerging opportunities, and key players. The report covers the historical period (2019-2024), base year (2025), and forecast period (2025-2033), offering valuable insights for industry professionals, investors, and strategic decision-makers. The total market size is projected to reach xx Million by 2033.
Semiconductor Wet Etch Systems Market Dynamics & Structure
The Semiconductor Wet Etch Systems market, a crucial sub-segment within the broader semiconductor equipment market, is characterized by moderate concentration with key players holding significant market share. Technological innovation, particularly in advanced materials and process optimization, is a primary driver. Stringent regulatory frameworks concerning environmental impact and safety protocols influence manufacturing processes. Competitive pressures from alternative etching techniques and the emergence of substitute materials also impact market dynamics. The end-user base consists primarily of integrated device manufacturers (IDMs) and outsourced semiconductor assembly and test (OSAT) companies. The landscape is further shaped by strategic mergers and acquisitions (M&A), with xx M&A deals recorded in the past five years, indicating a consolidated market with high entry barriers.
- Market Concentration: Moderately concentrated, with top 5 players holding approximately xx% market share.
- Technological Innovation: Focus on increasing precision, reducing etch rates, and minimizing environmental impact.
- Regulatory Landscape: Stringent environmental regulations drive adoption of cleaner, more efficient technologies.
- Competitive Substitutes: Dry etching techniques present a competitive threat, however wet etching maintains its value proposition for specific applications.
- M&A Activity: xx M&A deals over the past five years demonstrate strategic consolidation within the sector.
- Innovation Barriers: High R&D costs and the need for specialized expertise create significant barriers to entry.
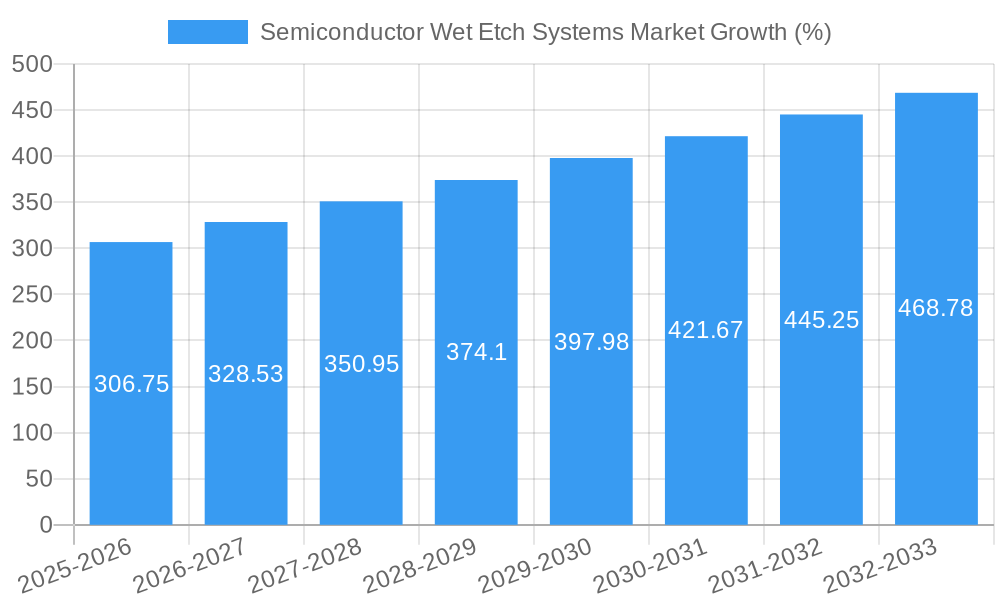
Semiconductor Wet Etch Systems Market Growth Trends & Insights
The Semiconductor Wet Etch Systems market has witnessed steady growth throughout the historical period (2019-2024), driven by the increasing demand for advanced semiconductor devices in diverse applications. The market size expanded from xx Million in 2019 to xx Million in 2024, exhibiting a CAGR of xx%. This growth trajectory is expected to continue during the forecast period (2025-2033), reaching xx Million by 2033. Market penetration remains relatively high in established markets, yet new applications and the rise of advanced packaging technologies are fueling further expansion. Technological disruptions, such as the introduction of novel wet etching chemistries and automation improvements, are accelerating adoption rates and enhancing efficiency. Shifting consumer preferences towards smaller, faster, and more energy-efficient devices contribute significantly to market growth.
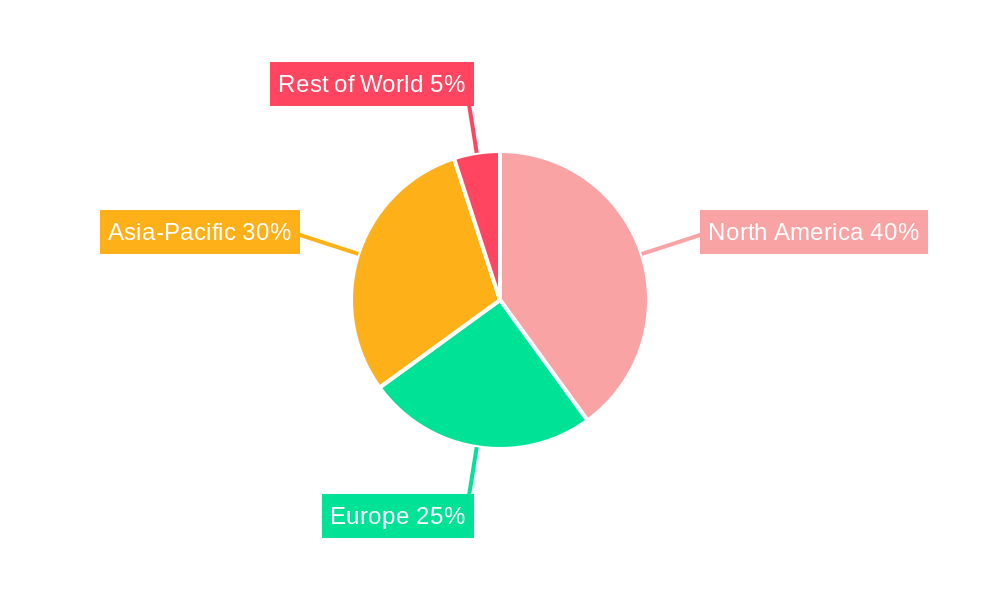
Dominant Regions, Countries, or Segments in Semiconductor Wet Etch Systems Market
The Asia-Pacific region, particularly Taiwan, South Korea, and China, dominates the Semiconductor Wet Etch Systems market due to the high concentration of semiconductor manufacturing facilities. This dominance is fueled by robust government support for the semiconductor industry, substantial investments in infrastructure, and a large pool of skilled labor. North America and Europe also hold significant market share, with strong presence of both equipment manufacturers and end-users. The advanced packaging segment is experiencing particularly strong growth, driven by the increasing demand for high-density and high-performance integrated circuits.
- Key Drivers (Asia-Pacific): Government incentives, robust infrastructure, skilled workforce, high concentration of semiconductor fabs.
- Key Drivers (North America & Europe): Strong R&D capabilities, established semiconductor industry, significant investments in advanced packaging.
- Market Share: Asia-Pacific holds approximately xx% of global market share, followed by North America at xx% and Europe at xx%.
- Growth Potential: The advanced packaging segment is poised for rapid growth in all regions, with a projected CAGR of xx%.
Semiconductor Wet Etch Systems Market Product Landscape
Semiconductor wet etch systems encompass a range of equipment designed for specific etching processes, including single-wafer and batch systems. Innovation focuses on improving precision, throughput, and minimizing chemical consumption. Advanced features like real-time process monitoring and automated control systems are enhancing performance and yield. Unique selling propositions often include superior uniformity, reduced defect rates, and compatibility with advanced materials. Technological advancements continue to push the boundaries of miniaturization and integration, driving the development of more efficient and sophisticated systems.
Key Drivers, Barriers & Challenges in Semiconductor Wet Etch Systems Market
Key Drivers: The increasing demand for advanced semiconductor devices across electronics sectors (e.g., smartphones, automobiles, IoT) is the primary driver. Technological advancements in etching chemistries and automation are further propelling market growth. Government incentives and investments in semiconductor manufacturing infrastructure also play a crucial role.
Key Challenges: The high cost of equipment and specialized expertise required for operation represent significant barriers to entry for new players. Supply chain disruptions, particularly concerning critical materials and components, can impact production and lead times. Intense competition and price pressures from established players also pose a challenge. Regulatory compliance and environmental concerns add to the complexities of manufacturing and operation.
Emerging Opportunities in Semiconductor Wet Etch Systems Market
Emerging opportunities lie in the burgeoning advanced packaging segment, particularly in fan-out panel-level packaging (FOPLP) and 3D integration. Untapped markets in emerging economies and the growing adoption of semiconductor devices in new applications (e.g., AI, high-performance computing) offer significant growth potential. The development of eco-friendly etching chemistries and the integration of AI-powered process optimization tools present significant opportunities for innovation and market expansion.
Growth Accelerators in the Semiconductor Wet Etch Systems Market Industry
Long-term growth will be fueled by continuous technological innovation, including the development of high-precision etching techniques and advanced automation solutions. Strategic partnerships and collaborations between equipment manufacturers and semiconductor companies will play a crucial role in accelerating market growth. Expansion into new geographical markets and the emergence of novel applications for semiconductor devices will further contribute to long-term expansion.
Key Players Shaping the Semiconductor Wet Etch Systems Market Market
- ACM Research
- LAM Research
- Hitachi High Technologies America
- Alfa Laval Inc
- Veeco Instruments Inc
- JST Manufacturing Inc
- Modutek Corporation
- Inseto
- Shenzhen Dragon Etching Co Ltd
- Micronit BV
Notable Milestones in Semiconductor Wet Etch Systems Market Sector
- September 2024: ACM Research Inc. launched the Ultra C bev-p panel bevel etching tool for FOPLP applications, enhancing efficiency and reliability in copper-related processes.
- August 2024: Veeco Instruments Inc. partnered with IBM, integrating its WaferStorm Wet Processing System into IBM's advanced packaging R&D at the Albany NanoTech Complex.
In-Depth Semiconductor Wet Etch Systems Market Market Outlook
The Semiconductor Wet Etch Systems market is poised for sustained growth, driven by the continued demand for advanced semiconductor devices and technological advancements in etching techniques. Strategic partnerships, expansion into emerging markets, and the increasing adoption of advanced packaging technologies will create lucrative opportunities for market players. Innovation in sustainable etching processes and the integration of AI-powered solutions will further shape the future of this dynamic market. The market is expected to exhibit a strong CAGR of xx% during the forecast period (2025-2033).
Semiconductor Wet Etch Systems Market Segmentation
-
1. Type
- 1.1. Isotropic Wet Etching
- 1.2. Anisotropic Wet Etching
-
2. Application
- 2.1. Logic and Memory
- 2.2. Power Device
- 2.3. MEMS
- 2.4. Other Applications
Semiconductor Wet Etch Systems Market Segmentation By Geography
- 1. North America
- 2. Europe
- 3. Asia
- 4. Australia and New Zealand
- 5. Latin America
- 6. Middle East and Africa
Semiconductor Wet Etch Systems Market REPORT HIGHLIGHTS
| Aspects | Details |
|---|---|
| Study Period | 2019-2033 |
| Base Year | 2024 |
| Estimated Year | 2025 |
| Forecast Period | 2025-2033 |
| Historical Period | 2019-2024 |
| Growth Rate | CAGR of 5.35% from 2019-2033 |
| Segmentation |
|
Table of Contents
- 1. Introduction
- 1.1. Research Scope
- 1.2. Market Segmentation
- 1.3. Research Methodology
- 1.4. Definitions and Assumptions
- 2. Executive Summary
- 2.1. Introduction
- 3. Market Dynamics
- 3.1. Introduction
- 3.2. Market Drivers
- 3.2.1 Increasing Application in Consumer Electronic Devices
- 3.2.2 Automotive
- 3.2.3 and Aerospace; Proliferation of Artificial Intelligence
- 3.2.4 IoT
- 3.2.5 and Connected Devices across Industry Verticals
- 3.3. Market Restrains
- 3.3.1 Increasing Application in Consumer Electronic Devices
- 3.3.2 Automotive
- 3.3.3 and Aerospace; Proliferation of Artificial Intelligence
- 3.3.4 IoT
- 3.3.5 and Connected Devices across Industry Verticals
- 3.4. Market Trends
- 3.4.1. The MEMS Segment is Expected to Observe Significant Growth
- 4. Market Factor Analysis
- 4.1. Porters Five Forces
- 4.2. Supply/Value Chain
- 4.3. PESTEL analysis
- 4.4. Market Entropy
- 4.5. Patent/Trademark Analysis
- 5. Global Semiconductor Wet Etch Systems Market Analysis, Insights and Forecast, 2019-2031
- 5.1. Market Analysis, Insights and Forecast - by Type
- 5.1.1. Isotropic Wet Etching
- 5.1.2. Anisotropic Wet Etching
- 5.2. Market Analysis, Insights and Forecast - by Application
- 5.2.1. Logic and Memory
- 5.2.2. Power Device
- 5.2.3. MEMS
- 5.2.4. Other Applications
- 5.3. Market Analysis, Insights and Forecast - by Region
- 5.3.1. North America
- 5.3.2. Europe
- 5.3.3. Asia
- 5.3.4. Australia and New Zealand
- 5.3.5. Latin America
- 5.3.6. Middle East and Africa
- 5.1. Market Analysis, Insights and Forecast - by Type
- 6. North America Semiconductor Wet Etch Systems Market Analysis, Insights and Forecast, 2019-2031
- 6.1. Market Analysis, Insights and Forecast - by Type
- 6.1.1. Isotropic Wet Etching
- 6.1.2. Anisotropic Wet Etching
- 6.2. Market Analysis, Insights and Forecast - by Application
- 6.2.1. Logic and Memory
- 6.2.2. Power Device
- 6.2.3. MEMS
- 6.2.4. Other Applications
- 6.1. Market Analysis, Insights and Forecast - by Type
- 7. Europe Semiconductor Wet Etch Systems Market Analysis, Insights and Forecast, 2019-2031
- 7.1. Market Analysis, Insights and Forecast - by Type
- 7.1.1. Isotropic Wet Etching
- 7.1.2. Anisotropic Wet Etching
- 7.2. Market Analysis, Insights and Forecast - by Application
- 7.2.1. Logic and Memory
- 7.2.2. Power Device
- 7.2.3. MEMS
- 7.2.4. Other Applications
- 7.1. Market Analysis, Insights and Forecast - by Type
- 8. Asia Semiconductor Wet Etch Systems Market Analysis, Insights and Forecast, 2019-2031
- 8.1. Market Analysis, Insights and Forecast - by Type
- 8.1.1. Isotropic Wet Etching
- 8.1.2. Anisotropic Wet Etching
- 8.2. Market Analysis, Insights and Forecast - by Application
- 8.2.1. Logic and Memory
- 8.2.2. Power Device
- 8.2.3. MEMS
- 8.2.4. Other Applications
- 8.1. Market Analysis, Insights and Forecast - by Type
- 9. Australia and New Zealand Semiconductor Wet Etch Systems Market Analysis, Insights and Forecast, 2019-2031
- 9.1. Market Analysis, Insights and Forecast - by Type
- 9.1.1. Isotropic Wet Etching
- 9.1.2. Anisotropic Wet Etching
- 9.2. Market Analysis, Insights and Forecast - by Application
- 9.2.1. Logic and Memory
- 9.2.2. Power Device
- 9.2.3. MEMS
- 9.2.4. Other Applications
- 9.1. Market Analysis, Insights and Forecast - by Type
- 10. Latin America Semiconductor Wet Etch Systems Market Analysis, Insights and Forecast, 2019-2031
- 10.1. Market Analysis, Insights and Forecast - by Type
- 10.1.1. Isotropic Wet Etching
- 10.1.2. Anisotropic Wet Etching
- 10.2. Market Analysis, Insights and Forecast - by Application
- 10.2.1. Logic and Memory
- 10.2.2. Power Device
- 10.2.3. MEMS
- 10.2.4. Other Applications
- 10.1. Market Analysis, Insights and Forecast - by Type
- 11. Middle East and Africa Semiconductor Wet Etch Systems Market Analysis, Insights and Forecast, 2019-2031
- 11.1. Market Analysis, Insights and Forecast - by Type
- 11.1.1. Isotropic Wet Etching
- 11.1.2. Anisotropic Wet Etching
- 11.2. Market Analysis, Insights and Forecast - by Application
- 11.2.1. Logic and Memory
- 11.2.2. Power Device
- 11.2.3. MEMS
- 11.2.4. Other Applications
- 11.1. Market Analysis, Insights and Forecast - by Type
- 12. Competitive Analysis
- 12.1. Global Market Share Analysis 2024
- 12.2. Company Profiles
- 12.2.1 ACM Research
- 12.2.1.1. Overview
- 12.2.1.2. Products
- 12.2.1.3. SWOT Analysis
- 12.2.1.4. Recent Developments
- 12.2.1.5. Financials (Based on Availability)
- 12.2.2 LAM Research
- 12.2.2.1. Overview
- 12.2.2.2. Products
- 12.2.2.3. SWOT Analysis
- 12.2.2.4. Recent Developments
- 12.2.2.5. Financials (Based on Availability)
- 12.2.3 Hitachi High Technologies America
- 12.2.3.1. Overview
- 12.2.3.2. Products
- 12.2.3.3. SWOT Analysis
- 12.2.3.4. Recent Developments
- 12.2.3.5. Financials (Based on Availability)
- 12.2.4 Alfa Laval Inc
- 12.2.4.1. Overview
- 12.2.4.2. Products
- 12.2.4.3. SWOT Analysis
- 12.2.4.4. Recent Developments
- 12.2.4.5. Financials (Based on Availability)
- 12.2.5 Veeco Instruments Inc
- 12.2.5.1. Overview
- 12.2.5.2. Products
- 12.2.5.3. SWOT Analysis
- 12.2.5.4. Recent Developments
- 12.2.5.5. Financials (Based on Availability)
- 12.2.6 JST Manufacturing Inc
- 12.2.6.1. Overview
- 12.2.6.2. Products
- 12.2.6.3. SWOT Analysis
- 12.2.6.4. Recent Developments
- 12.2.6.5. Financials (Based on Availability)
- 12.2.7 Modutek Corporation
- 12.2.7.1. Overview
- 12.2.7.2. Products
- 12.2.7.3. SWOT Analysis
- 12.2.7.4. Recent Developments
- 12.2.7.5. Financials (Based on Availability)
- 12.2.8 Inseto
- 12.2.8.1. Overview
- 12.2.8.2. Products
- 12.2.8.3. SWOT Analysis
- 12.2.8.4. Recent Developments
- 12.2.8.5. Financials (Based on Availability)
- 12.2.9 Shenzhen Dragon Etching Co Ltd
- 12.2.9.1. Overview
- 12.2.9.2. Products
- 12.2.9.3. SWOT Analysis
- 12.2.9.4. Recent Developments
- 12.2.9.5. Financials (Based on Availability)
- 12.2.10 Micronit BV*List Not Exhaustive
- 12.2.10.1. Overview
- 12.2.10.2. Products
- 12.2.10.3. SWOT Analysis
- 12.2.10.4. Recent Developments
- 12.2.10.5. Financials (Based on Availability)
- 12.2.1 ACM Research
List of Figures
- Figure 1: Global Semiconductor Wet Etch Systems Market Revenue Breakdown (Million, %) by Region 2024 & 2032
- Figure 2: Global Semiconductor Wet Etch Systems Market Volume Breakdown (Billion, %) by Region 2024 & 2032
- Figure 3: North America Semiconductor Wet Etch Systems Market Revenue (Million), by Type 2024 & 2032
- Figure 4: North America Semiconductor Wet Etch Systems Market Volume (Billion), by Type 2024 & 2032
- Figure 5: North America Semiconductor Wet Etch Systems Market Revenue Share (%), by Type 2024 & 2032
- Figure 6: North America Semiconductor Wet Etch Systems Market Volume Share (%), by Type 2024 & 2032
- Figure 7: North America Semiconductor Wet Etch Systems Market Revenue (Million), by Application 2024 & 2032
- Figure 8: North America Semiconductor Wet Etch Systems Market Volume (Billion), by Application 2024 & 2032
- Figure 9: North America Semiconductor Wet Etch Systems Market Revenue Share (%), by Application 2024 & 2032
- Figure 10: North America Semiconductor Wet Etch Systems Market Volume Share (%), by Application 2024 & 2032
- Figure 11: North America Semiconductor Wet Etch Systems Market Revenue (Million), by Country 2024 & 2032
- Figure 12: North America Semiconductor Wet Etch Systems Market Volume (Billion), by Country 2024 & 2032
- Figure 13: North America Semiconductor Wet Etch Systems Market Revenue Share (%), by Country 2024 & 2032
- Figure 14: North America Semiconductor Wet Etch Systems Market Volume Share (%), by Country 2024 & 2032
- Figure 15: Europe Semiconductor Wet Etch Systems Market Revenue (Million), by Type 2024 & 2032
- Figure 16: Europe Semiconductor Wet Etch Systems Market Volume (Billion), by Type 2024 & 2032
- Figure 17: Europe Semiconductor Wet Etch Systems Market Revenue Share (%), by Type 2024 & 2032
- Figure 18: Europe Semiconductor Wet Etch Systems Market Volume Share (%), by Type 2024 & 2032
- Figure 19: Europe Semiconductor Wet Etch Systems Market Revenue (Million), by Application 2024 & 2032
- Figure 20: Europe Semiconductor Wet Etch Systems Market Volume (Billion), by Application 2024 & 2032
- Figure 21: Europe Semiconductor Wet Etch Systems Market Revenue Share (%), by Application 2024 & 2032
- Figure 22: Europe Semiconductor Wet Etch Systems Market Volume Share (%), by Application 2024 & 2032
- Figure 23: Europe Semiconductor Wet Etch Systems Market Revenue (Million), by Country 2024 & 2032
- Figure 24: Europe Semiconductor Wet Etch Systems Market Volume (Billion), by Country 2024 & 2032
- Figure 25: Europe Semiconductor Wet Etch Systems Market Revenue Share (%), by Country 2024 & 2032
- Figure 26: Europe Semiconductor Wet Etch Systems Market Volume Share (%), by Country 2024 & 2032
- Figure 27: Asia Semiconductor Wet Etch Systems Market Revenue (Million), by Type 2024 & 2032
- Figure 28: Asia Semiconductor Wet Etch Systems Market Volume (Billion), by Type 2024 & 2032
- Figure 29: Asia Semiconductor Wet Etch Systems Market Revenue Share (%), by Type 2024 & 2032
- Figure 30: Asia Semiconductor Wet Etch Systems Market Volume Share (%), by Type 2024 & 2032
- Figure 31: Asia Semiconductor Wet Etch Systems Market Revenue (Million), by Application 2024 & 2032
- Figure 32: Asia Semiconductor Wet Etch Systems Market Volume (Billion), by Application 2024 & 2032
- Figure 33: Asia Semiconductor Wet Etch Systems Market Revenue Share (%), by Application 2024 & 2032
- Figure 34: Asia Semiconductor Wet Etch Systems Market Volume Share (%), by Application 2024 & 2032
- Figure 35: Asia Semiconductor Wet Etch Systems Market Revenue (Million), by Country 2024 & 2032
- Figure 36: Asia Semiconductor Wet Etch Systems Market Volume (Billion), by Country 2024 & 2032
- Figure 37: Asia Semiconductor Wet Etch Systems Market Revenue Share (%), by Country 2024 & 2032
- Figure 38: Asia Semiconductor Wet Etch Systems Market Volume Share (%), by Country 2024 & 2032
- Figure 39: Australia and New Zealand Semiconductor Wet Etch Systems Market Revenue (Million), by Type 2024 & 2032
- Figure 40: Australia and New Zealand Semiconductor Wet Etch Systems Market Volume (Billion), by Type 2024 & 2032
- Figure 41: Australia and New Zealand Semiconductor Wet Etch Systems Market Revenue Share (%), by Type 2024 & 2032
- Figure 42: Australia and New Zealand Semiconductor Wet Etch Systems Market Volume Share (%), by Type 2024 & 2032
- Figure 43: Australia and New Zealand Semiconductor Wet Etch Systems Market Revenue (Million), by Application 2024 & 2032
- Figure 44: Australia and New Zealand Semiconductor Wet Etch Systems Market Volume (Billion), by Application 2024 & 2032
- Figure 45: Australia and New Zealand Semiconductor Wet Etch Systems Market Revenue Share (%), by Application 2024 & 2032
- Figure 46: Australia and New Zealand Semiconductor Wet Etch Systems Market Volume Share (%), by Application 2024 & 2032
- Figure 47: Australia and New Zealand Semiconductor Wet Etch Systems Market Revenue (Million), by Country 2024 & 2032
- Figure 48: Australia and New Zealand Semiconductor Wet Etch Systems Market Volume (Billion), by Country 2024 & 2032
- Figure 49: Australia and New Zealand Semiconductor Wet Etch Systems Market Revenue Share (%), by Country 2024 & 2032
- Figure 50: Australia and New Zealand Semiconductor Wet Etch Systems Market Volume Share (%), by Country 2024 & 2032
- Figure 51: Latin America Semiconductor Wet Etch Systems Market Revenue (Million), by Type 2024 & 2032
- Figure 52: Latin America Semiconductor Wet Etch Systems Market Volume (Billion), by Type 2024 & 2032
- Figure 53: Latin America Semiconductor Wet Etch Systems Market Revenue Share (%), by Type 2024 & 2032
- Figure 54: Latin America Semiconductor Wet Etch Systems Market Volume Share (%), by Type 2024 & 2032
- Figure 55: Latin America Semiconductor Wet Etch Systems Market Revenue (Million), by Application 2024 & 2032
- Figure 56: Latin America Semiconductor Wet Etch Systems Market Volume (Billion), by Application 2024 & 2032
- Figure 57: Latin America Semiconductor Wet Etch Systems Market Revenue Share (%), by Application 2024 & 2032
- Figure 58: Latin America Semiconductor Wet Etch Systems Market Volume Share (%), by Application 2024 & 2032
- Figure 59: Latin America Semiconductor Wet Etch Systems Market Revenue (Million), by Country 2024 & 2032
- Figure 60: Latin America Semiconductor Wet Etch Systems Market Volume (Billion), by Country 2024 & 2032
- Figure 61: Latin America Semiconductor Wet Etch Systems Market Revenue Share (%), by Country 2024 & 2032
- Figure 62: Latin America Semiconductor Wet Etch Systems Market Volume Share (%), by Country 2024 & 2032
- Figure 63: Middle East and Africa Semiconductor Wet Etch Systems Market Revenue (Million), by Type 2024 & 2032
- Figure 64: Middle East and Africa Semiconductor Wet Etch Systems Market Volume (Billion), by Type 2024 & 2032
- Figure 65: Middle East and Africa Semiconductor Wet Etch Systems Market Revenue Share (%), by Type 2024 & 2032
- Figure 66: Middle East and Africa Semiconductor Wet Etch Systems Market Volume Share (%), by Type 2024 & 2032
- Figure 67: Middle East and Africa Semiconductor Wet Etch Systems Market Revenue (Million), by Application 2024 & 2032
- Figure 68: Middle East and Africa Semiconductor Wet Etch Systems Market Volume (Billion), by Application 2024 & 2032
- Figure 69: Middle East and Africa Semiconductor Wet Etch Systems Market Revenue Share (%), by Application 2024 & 2032
- Figure 70: Middle East and Africa Semiconductor Wet Etch Systems Market Volume Share (%), by Application 2024 & 2032
- Figure 71: Middle East and Africa Semiconductor Wet Etch Systems Market Revenue (Million), by Country 2024 & 2032
- Figure 72: Middle East and Africa Semiconductor Wet Etch Systems Market Volume (Billion), by Country 2024 & 2032
- Figure 73: Middle East and Africa Semiconductor Wet Etch Systems Market Revenue Share (%), by Country 2024 & 2032
- Figure 74: Middle East and Africa Semiconductor Wet Etch Systems Market Volume Share (%), by Country 2024 & 2032
List of Tables
- Table 1: Global Semiconductor Wet Etch Systems Market Revenue Million Forecast, by Region 2019 & 2032
- Table 2: Global Semiconductor Wet Etch Systems Market Volume Billion Forecast, by Region 2019 & 2032
- Table 3: Global Semiconductor Wet Etch Systems Market Revenue Million Forecast, by Type 2019 & 2032
- Table 4: Global Semiconductor Wet Etch Systems Market Volume Billion Forecast, by Type 2019 & 2032
- Table 5: Global Semiconductor Wet Etch Systems Market Revenue Million Forecast, by Application 2019 & 2032
- Table 6: Global Semiconductor Wet Etch Systems Market Volume Billion Forecast, by Application 2019 & 2032
- Table 7: Global Semiconductor Wet Etch Systems Market Revenue Million Forecast, by Region 2019 & 2032
- Table 8: Global Semiconductor Wet Etch Systems Market Volume Billion Forecast, by Region 2019 & 2032
- Table 9: Global Semiconductor Wet Etch Systems Market Revenue Million Forecast, by Type 2019 & 2032
- Table 10: Global Semiconductor Wet Etch Systems Market Volume Billion Forecast, by Type 2019 & 2032
- Table 11: Global Semiconductor Wet Etch Systems Market Revenue Million Forecast, by Application 2019 & 2032
- Table 12: Global Semiconductor Wet Etch Systems Market Volume Billion Forecast, by Application 2019 & 2032
- Table 13: Global Semiconductor Wet Etch Systems Market Revenue Million Forecast, by Country 2019 & 2032
- Table 14: Global Semiconductor Wet Etch Systems Market Volume Billion Forecast, by Country 2019 & 2032
- Table 15: Global Semiconductor Wet Etch Systems Market Revenue Million Forecast, by Type 2019 & 2032
- Table 16: Global Semiconductor Wet Etch Systems Market Volume Billion Forecast, by Type 2019 & 2032
- Table 17: Global Semiconductor Wet Etch Systems Market Revenue Million Forecast, by Application 2019 & 2032
- Table 18: Global Semiconductor Wet Etch Systems Market Volume Billion Forecast, by Application 2019 & 2032
- Table 19: Global Semiconductor Wet Etch Systems Market Revenue Million Forecast, by Country 2019 & 2032
- Table 20: Global Semiconductor Wet Etch Systems Market Volume Billion Forecast, by Country 2019 & 2032
- Table 21: Global Semiconductor Wet Etch Systems Market Revenue Million Forecast, by Type 2019 & 2032
- Table 22: Global Semiconductor Wet Etch Systems Market Volume Billion Forecast, by Type 2019 & 2032
- Table 23: Global Semiconductor Wet Etch Systems Market Revenue Million Forecast, by Application 2019 & 2032
- Table 24: Global Semiconductor Wet Etch Systems Market Volume Billion Forecast, by Application 2019 & 2032
- Table 25: Global Semiconductor Wet Etch Systems Market Revenue Million Forecast, by Country 2019 & 2032
- Table 26: Global Semiconductor Wet Etch Systems Market Volume Billion Forecast, by Country 2019 & 2032
- Table 27: Global Semiconductor Wet Etch Systems Market Revenue Million Forecast, by Type 2019 & 2032
- Table 28: Global Semiconductor Wet Etch Systems Market Volume Billion Forecast, by Type 2019 & 2032
- Table 29: Global Semiconductor Wet Etch Systems Market Revenue Million Forecast, by Application 2019 & 2032
- Table 30: Global Semiconductor Wet Etch Systems Market Volume Billion Forecast, by Application 2019 & 2032
- Table 31: Global Semiconductor Wet Etch Systems Market Revenue Million Forecast, by Country 2019 & 2032
- Table 32: Global Semiconductor Wet Etch Systems Market Volume Billion Forecast, by Country 2019 & 2032
- Table 33: Global Semiconductor Wet Etch Systems Market Revenue Million Forecast, by Type 2019 & 2032
- Table 34: Global Semiconductor Wet Etch Systems Market Volume Billion Forecast, by Type 2019 & 2032
- Table 35: Global Semiconductor Wet Etch Systems Market Revenue Million Forecast, by Application 2019 & 2032
- Table 36: Global Semiconductor Wet Etch Systems Market Volume Billion Forecast, by Application 2019 & 2032
- Table 37: Global Semiconductor Wet Etch Systems Market Revenue Million Forecast, by Country 2019 & 2032
- Table 38: Global Semiconductor Wet Etch Systems Market Volume Billion Forecast, by Country 2019 & 2032
- Table 39: Global Semiconductor Wet Etch Systems Market Revenue Million Forecast, by Type 2019 & 2032
- Table 40: Global Semiconductor Wet Etch Systems Market Volume Billion Forecast, by Type 2019 & 2032
- Table 41: Global Semiconductor Wet Etch Systems Market Revenue Million Forecast, by Application 2019 & 2032
- Table 42: Global Semiconductor Wet Etch Systems Market Volume Billion Forecast, by Application 2019 & 2032
- Table 43: Global Semiconductor Wet Etch Systems Market Revenue Million Forecast, by Country 2019 & 2032
- Table 44: Global Semiconductor Wet Etch Systems Market Volume Billion Forecast, by Country 2019 & 2032
Frequently Asked Questions
1. What is the projected Compound Annual Growth Rate (CAGR) of the Semiconductor Wet Etch Systems Market?
The projected CAGR is approximately 5.35%.
2. Which companies are prominent players in the Semiconductor Wet Etch Systems Market?
Key companies in the market include ACM Research, LAM Research, Hitachi High Technologies America, Alfa Laval Inc, Veeco Instruments Inc, JST Manufacturing Inc, Modutek Corporation, Inseto, Shenzhen Dragon Etching Co Ltd, Micronit BV*List Not Exhaustive.
3. What are the main segments of the Semiconductor Wet Etch Systems Market?
The market segments include Type, Application.
4. Can you provide details about the market size?
The market size is estimated to be USD 5.5 Million as of 2022.
5. What are some drivers contributing to market growth?
Increasing Application in Consumer Electronic Devices. Automotive. and Aerospace; Proliferation of Artificial Intelligence. IoT. and Connected Devices across Industry Verticals.
6. What are the notable trends driving market growth?
The MEMS Segment is Expected to Observe Significant Growth.
7. Are there any restraints impacting market growth?
Increasing Application in Consumer Electronic Devices. Automotive. and Aerospace; Proliferation of Artificial Intelligence. IoT. and Connected Devices across Industry Verticals.
8. Can you provide examples of recent developments in the market?
September 2024: ACM Research Inc. unveiled its Ultra C bev-p panel bevel etching tool, tailored for fan-out panel-level packaging (FOPLP) applications. This innovative tool specializes in bevel etching and cleaning for copper-related processes. Notably, it can manage bevel etching on both the front and back sides of the panel, all within a single system. Such versatility boosts process efficiency and bolsters product reliability.August 2024: Veeco Instruments Inc. revealed that IBM had chosen its WaferStorm Wet Processing System for Advanced Packaging applications. Furthermore, the two companies have inked a joint development agreement. This collaboration aims to delve into advanced packaging applications, leveraging various wet processing technologies from Veeco. As part of this partnership, the WaferStorm Wet Processing System will find its home at the Albany NanoTech Complex in Albany, NY. This facility is a hub for IBM and its ecosystem partners, who are at the forefront of R&D in advanced packaging and chiplet technologies.
9. What pricing options are available for accessing the report?
Pricing options include single-user, multi-user, and enterprise licenses priced at USD 4750, USD 5250, and USD 8750 respectively.
10. Is the market size provided in terms of value or volume?
The market size is provided in terms of value, measured in Million and volume, measured in Billion.
11. Are there any specific market keywords associated with the report?
Yes, the market keyword associated with the report is "Semiconductor Wet Etch Systems Market," which aids in identifying and referencing the specific market segment covered.
12. How do I determine which pricing option suits my needs best?
The pricing options vary based on user requirements and access needs. Individual users may opt for single-user licenses, while businesses requiring broader access may choose multi-user or enterprise licenses for cost-effective access to the report.
13. Are there any additional resources or data provided in the Semiconductor Wet Etch Systems Market report?
While the report offers comprehensive insights, it's advisable to review the specific contents or supplementary materials provided to ascertain if additional resources or data are available.
14. How can I stay updated on further developments or reports in the Semiconductor Wet Etch Systems Market?
To stay informed about further developments, trends, and reports in the Semiconductor Wet Etch Systems Market, consider subscribing to industry newsletters, following relevant companies and organizations, or regularly checking reputable industry news sources and publications.
Methodology
Step 1 - Identification of Relevant Samples Size from Population Database


Step 2 - Approaches for Defining Global Market Size (Value, Volume* & Price*)

Note*: In applicable scenarios
Step 3 - Data Sources
Primary Research
- Web Analytics
- Survey Reports
- Research Institute
- Latest Research Reports
- Opinion Leaders
Secondary Research
- Annual Reports
- White Paper
- Latest Press Release
- Industry Association
- Paid Database
- Investor Presentations

Step 4 - Data Triangulation
Involves using different sources of information in order to increase the validity of a study
These sources are likely to be stakeholders in a program - participants, other researchers, program staff, other community members, and so on.
Then we put all data in single framework & apply various statistical tools to find out the dynamic on the market.
During the analysis stage, feedback from the stakeholder groups would be compared to determine areas of agreement as well as areas of divergence


