
Key Insights
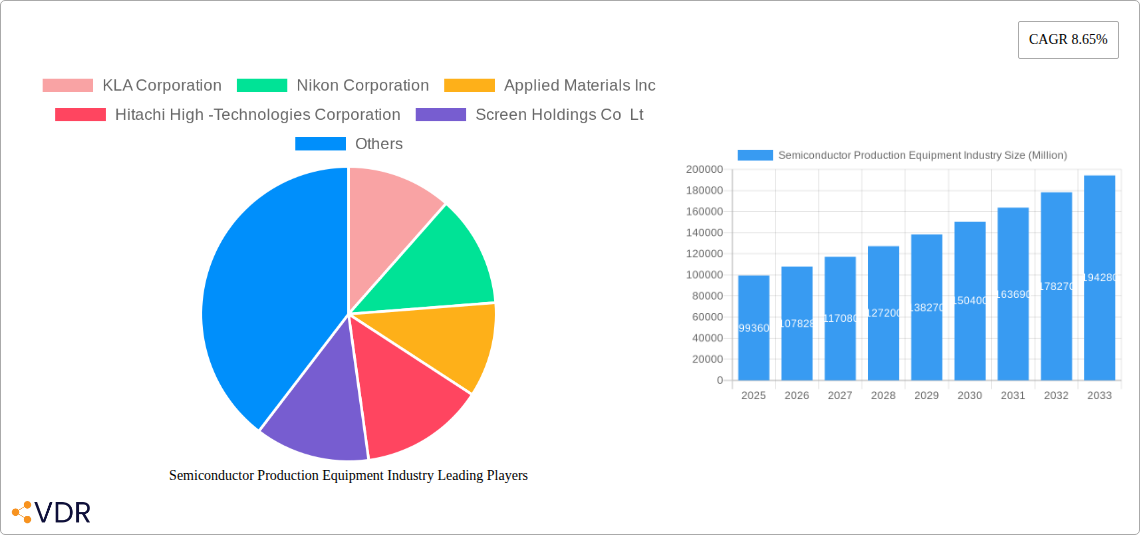
The Semiconductor Production Equipment market, valued at $99.36 billion in 2025, is projected to experience robust growth, driven by the increasing demand for advanced semiconductor devices in various applications, including 5G infrastructure, artificial intelligence, high-performance computing, and the Internet of Things (IoT). A Compound Annual Growth Rate (CAGR) of 8.65% from 2025 to 2033 indicates a significant expansion of this market. Key drivers include the ongoing miniaturization of semiconductor chips, necessitating advanced equipment for precise manufacturing processes. The shift towards advanced nodes (e.g., 3nm and beyond) further fuels demand for sophisticated lithography, etching, and deposition equipment. Trends like the rise of chiplets and heterogeneous integration are also shaping market dynamics, requiring flexible and adaptable production solutions. However, challenges exist, including the high capital expenditure required for new equipment and the geopolitical factors influencing supply chain stability. The market is segmented by equipment type (lithography, etching, deposition, and others) and end-user industry (semiconductor fabrication plants and semiconductor electronics manufacturing). Major players like Applied Materials, ASML, Tokyo Electron, and Lam Research dominate the market, constantly innovating to meet the ever-evolving demands of the semiconductor industry.
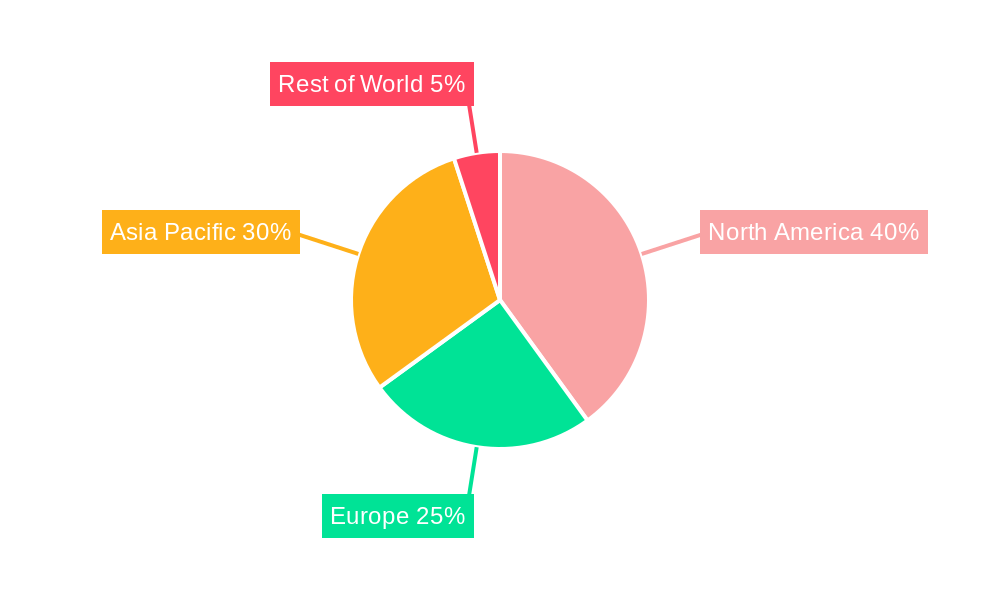
The regional distribution of the market is expected to reflect existing manufacturing hubs. North America and Asia Pacific are anticipated to hold significant market shares due to the concentration of major semiconductor manufacturers and fabs in these regions. Europe is also a key player, contributing significantly to the overall market growth through investments in advanced technology and research. Growth in emerging markets like Southeast Asia and parts of South America is projected to be slower, but still substantial, as these regions gradually expand their semiconductor manufacturing capabilities. Competition in the industry is fierce, with leading companies focusing on technological advancements, strategic partnerships, and mergers and acquisitions to secure market share and expand their product portfolios. The forecast period suggests a continued trajectory of growth, influenced by technological advancements, the increasing adoption of AI and other technologies, and the demand for advanced semiconductor devices globally.
Semiconductor Production Equipment Industry Market Report: 2019-2033
This comprehensive report provides an in-depth analysis of the Semiconductor Production Equipment market, encompassing market dynamics, growth trends, regional dominance, product landscape, key players, and future outlook. The report covers the period from 2019 to 2033, with a focus on the forecast period of 2025-2033 and a base year of 2025. The parent market is the broader Semiconductor Industry, while the child markets analyzed include Lithography, Etching, Deposition, and other equipment types, segmented by end-user industries like Semiconductor Fabrication Plants and Semiconductor Electronics Manufacturing. This report is crucial for industry professionals, investors, and strategists seeking to understand and capitalize on opportunities within this rapidly evolving sector. The market value is presented in Million USD.
Semiconductor Production Equipment Industry Market Dynamics & Structure
The Semiconductor Production Equipment market is characterized by high capital expenditure, intense competition, and continuous technological innovation. Market concentration is relatively high, with a few dominant players controlling significant market share. Technological advancements, particularly in lithography, etching, and deposition techniques, are key drivers of market growth. Stringent regulatory frameworks concerning environmental compliance and safety standards influence manufacturing processes. The market also faces challenges from the emergence of substitute technologies and fluctuating demand from the end-user industries. Mergers and acquisitions (M&A) activity is frequent, reflecting the pursuit of consolidation and technological capabilities.
- Market Concentration: The top 5 players hold approximately xx% of the global market share in 2025.
- Technological Innovation: Focus on EUV lithography, advanced etching techniques (e.g., plasma etching), and atomic layer deposition (ALD) drives innovation.
- Regulatory Landscape: Environmental regulations and safety standards impact equipment design and operation.
- M&A Activity: xx major M&A deals were recorded between 2019 and 2024, valued at approximately xx Million USD.
- Competitive Landscape: Intense competition exists among established players and emerging companies focused on niche technologies.
Semiconductor Production Equipment Industry Growth Trends & Insights
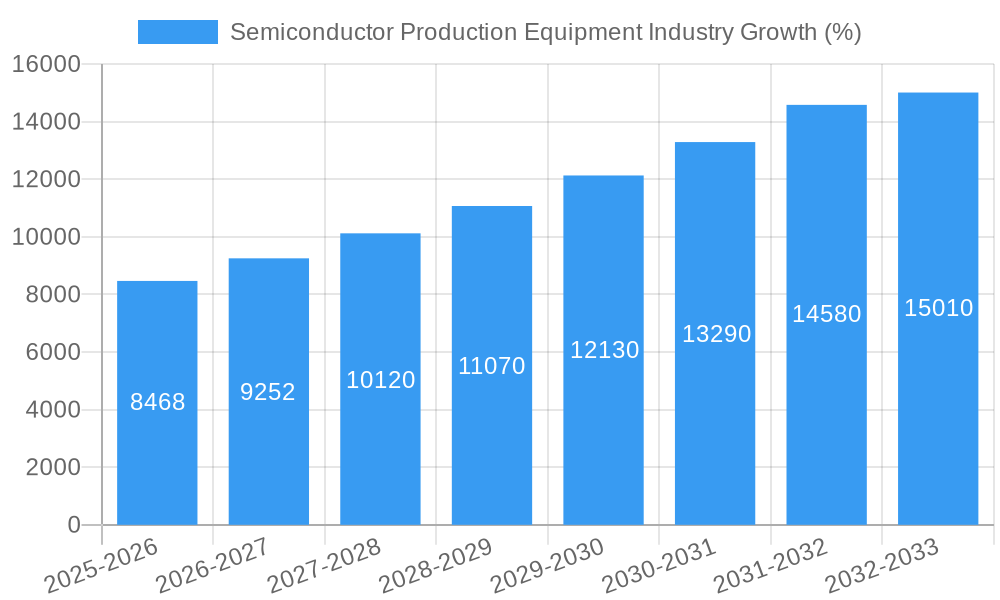
The Semiconductor Production Equipment market experienced significant growth during the historical period (2019-2024), driven by increasing demand for advanced semiconductor devices across various applications, including smartphones, data centers, and automobiles. The market is expected to continue its growth trajectory throughout the forecast period (2025-2033), with a projected CAGR of xx%. This growth is fueled by technological advancements leading to miniaturization, higher performance, and increased power efficiency of semiconductor chips. The adoption rate of advanced equipment is expected to increase with the rising demand for cutting-edge technology. Consumer behavior shifts, such as increasing reliance on smartphones and other smart devices, contribute to the sustained demand for semiconductor production equipment. Disruptive technologies like AI and 5G are also fueling market expansion. The market size is estimated to be xx Million USD in 2025 and is projected to reach xx Million USD by 2033.
Dominant Regions, Countries, or Segments in Semiconductor Production Equipment Industry
Asia, particularly East Asia (Taiwan, South Korea, Japan, and China), dominates the Semiconductor Production Equipment market, accounting for approximately xx% of the global market share in 2025. This dominance is driven by the presence of major semiconductor manufacturing hubs and robust government support for the semiconductor industry. North America and Europe also hold significant market share, with strong presence of equipment manufacturers and research institutions.
By Type:
- Lithography Equipment: This segment is the largest, driven by the need for advanced lithographic techniques for smaller node chips. Market share in 2025: xx%.
- Etching Equipment: This segment shows consistent growth due to the increasing complexity of chip designs and the need for precise etching. Market share in 2025: xx%
- Deposition Equipment: Growth is fueled by advanced deposition techniques like ALD and CVD for creating high-quality thin films. Market share in 2025: xx%.
- Other Equipment Types: This includes testing, metrology, and other support equipment. Market share in 2025: xx%
By End-user Industry:
- Semiconductor Fabrication Plants: This segment accounts for the largest share of the market due to the high demand for advanced equipment. Market share in 2025: xx%.
- Semiconductor Electronics Manufacturing: This segment is showing strong growth driven by the expansion of the electronics industry. Market share in 2025: xx%
Semiconductor Production Equipment Industry Product Landscape
The product landscape is characterized by continuous innovation, with manufacturers focusing on enhancing throughput, precision, and process control. Key features include advanced automation, real-time process monitoring, and improved yield rates. The unique selling propositions often involve proprietary technologies, higher throughput capabilities, and superior process control. Recent advancements focus on enabling the production of smaller, more powerful, and energy-efficient chips.
Key Drivers, Barriers & Challenges in Semiconductor Production Equipment Industry
Key Drivers:
- Increasing demand for advanced semiconductor devices across diverse applications.
- Technological advancements driving miniaturization and performance enhancement.
- Government initiatives and subsidies supporting semiconductor industry growth.
Challenges and Restraints:
- High capital expenditure for advanced equipment limits market accessibility.
- Intense competition among manufacturers leads to price pressure.
- Geopolitical instability and supply chain disruptions impact equipment availability.
Emerging Opportunities in Semiconductor Production Equipment Industry
- Growing demand for advanced packaging technologies.
- Expansion into emerging markets such as automotive and IoT sectors.
- Development of sustainable and environmentally friendly equipment.
Growth Accelerators in the Semiconductor Production Equipment Industry
Technological breakthroughs in lithography, etching, and deposition are major growth catalysts. Strategic partnerships between equipment manufacturers and semiconductor companies accelerate innovation. Market expansion into new applications and geographic regions further fuels growth.
Key Players Shaping the Semiconductor Production Equipment Industry Market
- KLA Corporation
- Nikon Corporation
- Applied Materials Inc
- Hitachi High-Technologies Corporation
- Screen Holdings Co Ltd
- Plasma Therm
- Tokyo Electron Limited
- ASML Holding NV
- Carl Zeiss AG
- LAM Research Corporation
- VEECO Instruments Inc
Notable Milestones in Semiconductor Production Equipment Industry Sector
- December 2023: Tokyo Electron launched Ulucus G, a wafer thinning system for 300 mm wafer fabrication, improving efficiency and wafer quality.
- February 2024: Applied Materials unveiled a new product lineup for 2nm and below process nodes, addressing challenges in EUV lithography.
In-Depth Semiconductor Production Equipment Industry Market Outlook
The Semiconductor Production Equipment market is poised for sustained growth driven by ongoing technological advancements and increasing demand for advanced semiconductor devices. Strategic partnerships, investments in R&D, and expansion into new applications and markets present significant opportunities for growth and innovation. The long-term outlook remains positive, with substantial potential for market expansion.
Semiconductor Production Equipment Industry Segmentation
-
1. Type
- 1.1. Lithography Equipment
- 1.2. Etching Equipment
- 1.3. Deposition Equipment
- 1.4. Other Equipment Types
-
2. End-user Industry
- 2.1. Semiconductor Fabrication Plant
- 2.2. Semiconductor Electronics Manufacturing
Semiconductor Production Equipment Industry Segmentation By Geography
- 1. United States
- 2. Europe
- 3. China
- 4. South Korea
- 5. Taiwan
- 6. Japan
- 7. Latin America
- 8. Middle East and Africa
Semiconductor Production Equipment Industry REPORT HIGHLIGHTS
| Aspects | Details |
|---|---|
| Study Period | 2019-2033 |
| Base Year | 2024 |
| Estimated Year | 2025 |
| Forecast Period | 2025-2033 |
| Historical Period | 2019-2024 |
| Growth Rate | CAGR of 8.65% from 2019-2033 |
| Segmentation |
|
Table of Contents
- 1. Introduction
- 1.1. Research Scope
- 1.2. Market Segmentation
- 1.3. Research Methodology
- 1.4. Definitions and Assumptions
- 2. Executive Summary
- 2.1. Introduction
- 3. Market Dynamics
- 3.1. Introduction
- 3.2. Market Drivers
- 3.2.1 Increasing Needs of Consumer Electronic Devices Boosting the Manufacturing Prospects; Proliferation of Artificial Intelligence
- 3.2.2 IoT
- 3.2.3 and Connected Devices Across Industry Verticals
- 3.3. Market Restrains
- 3.3.1. Dynamic Nature of Technologies Requires Several Changes in Manufacturing Equipment
- 3.4. Market Trends
- 3.4.1. Semiconductor Fabrication Plant to be the Largest End-user Industry
- 4. Market Factor Analysis
- 4.1. Porters Five Forces
- 4.2. Supply/Value Chain
- 4.3. PESTEL analysis
- 4.4. Market Entropy
- 4.5. Patent/Trademark Analysis
- 5. Global Semiconductor Production Equipment Industry Analysis, Insights and Forecast, 2019-2031
- 5.1. Market Analysis, Insights and Forecast - by Type
- 5.1.1. Lithography Equipment
- 5.1.2. Etching Equipment
- 5.1.3. Deposition Equipment
- 5.1.4. Other Equipment Types
- 5.2. Market Analysis, Insights and Forecast - by End-user Industry
- 5.2.1. Semiconductor Fabrication Plant
- 5.2.2. Semiconductor Electronics Manufacturing
- 5.3. Market Analysis, Insights and Forecast - by Region
- 5.3.1. United States
- 5.3.2. Europe
- 5.3.3. China
- 5.3.4. South Korea
- 5.3.5. Taiwan
- 5.3.6. Japan
- 5.3.7. Latin America
- 5.3.8. Middle East and Africa
- 5.1. Market Analysis, Insights and Forecast - by Type
- 6. United States Semiconductor Production Equipment Industry Analysis, Insights and Forecast, 2019-2031
- 6.1. Market Analysis, Insights and Forecast - by Type
- 6.1.1. Lithography Equipment
- 6.1.2. Etching Equipment
- 6.1.3. Deposition Equipment
- 6.1.4. Other Equipment Types
- 6.2. Market Analysis, Insights and Forecast - by End-user Industry
- 6.2.1. Semiconductor Fabrication Plant
- 6.2.2. Semiconductor Electronics Manufacturing
- 6.1. Market Analysis, Insights and Forecast - by Type
- 7. Europe Semiconductor Production Equipment Industry Analysis, Insights and Forecast, 2019-2031
- 7.1. Market Analysis, Insights and Forecast - by Type
- 7.1.1. Lithography Equipment
- 7.1.2. Etching Equipment
- 7.1.3. Deposition Equipment
- 7.1.4. Other Equipment Types
- 7.2. Market Analysis, Insights and Forecast - by End-user Industry
- 7.2.1. Semiconductor Fabrication Plant
- 7.2.2. Semiconductor Electronics Manufacturing
- 7.1. Market Analysis, Insights and Forecast - by Type
- 8. China Semiconductor Production Equipment Industry Analysis, Insights and Forecast, 2019-2031
- 8.1. Market Analysis, Insights and Forecast - by Type
- 8.1.1. Lithography Equipment
- 8.1.2. Etching Equipment
- 8.1.3. Deposition Equipment
- 8.1.4. Other Equipment Types
- 8.2. Market Analysis, Insights and Forecast - by End-user Industry
- 8.2.1. Semiconductor Fabrication Plant
- 8.2.2. Semiconductor Electronics Manufacturing
- 8.1. Market Analysis, Insights and Forecast - by Type
- 9. South Korea Semiconductor Production Equipment Industry Analysis, Insights and Forecast, 2019-2031
- 9.1. Market Analysis, Insights and Forecast - by Type
- 9.1.1. Lithography Equipment
- 9.1.2. Etching Equipment
- 9.1.3. Deposition Equipment
- 9.1.4. Other Equipment Types
- 9.2. Market Analysis, Insights and Forecast - by End-user Industry
- 9.2.1. Semiconductor Fabrication Plant
- 9.2.2. Semiconductor Electronics Manufacturing
- 9.1. Market Analysis, Insights and Forecast - by Type
- 10. Taiwan Semiconductor Production Equipment Industry Analysis, Insights and Forecast, 2019-2031
- 10.1. Market Analysis, Insights and Forecast - by Type
- 10.1.1. Lithography Equipment
- 10.1.2. Etching Equipment
- 10.1.3. Deposition Equipment
- 10.1.4. Other Equipment Types
- 10.2. Market Analysis, Insights and Forecast - by End-user Industry
- 10.2.1. Semiconductor Fabrication Plant
- 10.2.2. Semiconductor Electronics Manufacturing
- 10.1. Market Analysis, Insights and Forecast - by Type
- 11. Japan Semiconductor Production Equipment Industry Analysis, Insights and Forecast, 2019-2031
- 11.1. Market Analysis, Insights and Forecast - by Type
- 11.1.1. Lithography Equipment
- 11.1.2. Etching Equipment
- 11.1.3. Deposition Equipment
- 11.1.4. Other Equipment Types
- 11.2. Market Analysis, Insights and Forecast - by End-user Industry
- 11.2.1. Semiconductor Fabrication Plant
- 11.2.2. Semiconductor Electronics Manufacturing
- 11.1. Market Analysis, Insights and Forecast - by Type
- 12. Latin America Semiconductor Production Equipment Industry Analysis, Insights and Forecast, 2019-2031
- 12.1. Market Analysis, Insights and Forecast - by Type
- 12.1.1. Lithography Equipment
- 12.1.2. Etching Equipment
- 12.1.3. Deposition Equipment
- 12.1.4. Other Equipment Types
- 12.2. Market Analysis, Insights and Forecast - by End-user Industry
- 12.2.1. Semiconductor Fabrication Plant
- 12.2.2. Semiconductor Electronics Manufacturing
- 12.1. Market Analysis, Insights and Forecast - by Type
- 13. Middle East and Africa Semiconductor Production Equipment Industry Analysis, Insights and Forecast, 2019-2031
- 13.1. Market Analysis, Insights and Forecast - by Type
- 13.1.1. Lithography Equipment
- 13.1.2. Etching Equipment
- 13.1.3. Deposition Equipment
- 13.1.4. Other Equipment Types
- 13.2. Market Analysis, Insights and Forecast - by End-user Industry
- 13.2.1. Semiconductor Fabrication Plant
- 13.2.2. Semiconductor Electronics Manufacturing
- 13.1. Market Analysis, Insights and Forecast - by Type
- 14. North America Semiconductor Production Equipment Industry Analysis, Insights and Forecast, 2019-2031
- 14.1. Market Analysis, Insights and Forecast - By Country/Sub-region
- 14.1.1 United States
- 14.1.2 Canada
- 14.1.3 Mexico
- 15. Europe Semiconductor Production Equipment Industry Analysis, Insights and Forecast, 2019-2031
- 15.1. Market Analysis, Insights and Forecast - By Country/Sub-region
- 15.1.1 Germany
- 15.1.2 United Kingdom
- 15.1.3 France
- 15.1.4 Spain
- 15.1.5 Italy
- 15.1.6 Spain
- 15.1.7 Belgium
- 15.1.8 Netherland
- 15.1.9 Nordics
- 15.1.10 Rest of Europe
- 16. Asia Pacific Semiconductor Production Equipment Industry Analysis, Insights and Forecast, 2019-2031
- 16.1. Market Analysis, Insights and Forecast - By Country/Sub-region
- 16.1.1 China
- 16.1.2 Japan
- 16.1.3 India
- 16.1.4 South Korea
- 16.1.5 Southeast Asia
- 16.1.6 Australia
- 16.1.7 Indonesia
- 16.1.8 Phillipes
- 16.1.9 Singapore
- 16.1.10 Thailandc
- 16.1.11 Rest of Asia Pacific
- 17. South America Semiconductor Production Equipment Industry Analysis, Insights and Forecast, 2019-2031
- 17.1. Market Analysis, Insights and Forecast - By Country/Sub-region
- 17.1.1 Brazil
- 17.1.2 Argentina
- 17.1.3 Peru
- 17.1.4 Chile
- 17.1.5 Colombia
- 17.1.6 Ecuador
- 17.1.7 Venezuela
- 17.1.8 Rest of South America
- 18. North America Semiconductor Production Equipment Industry Analysis, Insights and Forecast, 2019-2031
- 18.1. Market Analysis, Insights and Forecast - By Country/Sub-region
- 18.1.1 United States
- 18.1.2 Canada
- 18.1.3 Mexico
- 19. MEA Semiconductor Production Equipment Industry Analysis, Insights and Forecast, 2019-2031
- 19.1. Market Analysis, Insights and Forecast - By Country/Sub-region
- 19.1.1 United Arab Emirates
- 19.1.2 Saudi Arabia
- 19.1.3 South Africa
- 19.1.4 Rest of Middle East and Africa
- 20. Competitive Analysis
- 20.1. Global Market Share Analysis 2024
- 20.2. Company Profiles
- 20.2.1 KLA Corporation
- 20.2.1.1. Overview
- 20.2.1.2. Products
- 20.2.1.3. SWOT Analysis
- 20.2.1.4. Recent Developments
- 20.2.1.5. Financials (Based on Availability)
- 20.2.2 Nikon Corporation
- 20.2.2.1. Overview
- 20.2.2.2. Products
- 20.2.2.3. SWOT Analysis
- 20.2.2.4. Recent Developments
- 20.2.2.5. Financials (Based on Availability)
- 20.2.3 Applied Materials Inc
- 20.2.3.1. Overview
- 20.2.3.2. Products
- 20.2.3.3. SWOT Analysis
- 20.2.3.4. Recent Developments
- 20.2.3.5. Financials (Based on Availability)
- 20.2.4 Hitachi High -Technologies Corporation
- 20.2.4.1. Overview
- 20.2.4.2. Products
- 20.2.4.3. SWOT Analysis
- 20.2.4.4. Recent Developments
- 20.2.4.5. Financials (Based on Availability)
- 20.2.5 Screen Holdings Co Lt
- 20.2.5.1. Overview
- 20.2.5.2. Products
- 20.2.5.3. SWOT Analysis
- 20.2.5.4. Recent Developments
- 20.2.5.5. Financials (Based on Availability)
- 20.2.6 Plasma Therm
- 20.2.6.1. Overview
- 20.2.6.2. Products
- 20.2.6.3. SWOT Analysis
- 20.2.6.4. Recent Developments
- 20.2.6.5. Financials (Based on Availability)
- 20.2.7 Tokyo Electron Limited
- 20.2.7.1. Overview
- 20.2.7.2. Products
- 20.2.7.3. SWOT Analysis
- 20.2.7.4. Recent Developments
- 20.2.7.5. Financials (Based on Availability)
- 20.2.8 ASML Holding NV
- 20.2.8.1. Overview
- 20.2.8.2. Products
- 20.2.8.3. SWOT Analysis
- 20.2.8.4. Recent Developments
- 20.2.8.5. Financials (Based on Availability)
- 20.2.9 Carl Zeiss AG
- 20.2.9.1. Overview
- 20.2.9.2. Products
- 20.2.9.3. SWOT Analysis
- 20.2.9.4. Recent Developments
- 20.2.9.5. Financials (Based on Availability)
- 20.2.10 LAM Research Corporation
- 20.2.10.1. Overview
- 20.2.10.2. Products
- 20.2.10.3. SWOT Analysis
- 20.2.10.4. Recent Developments
- 20.2.10.5. Financials (Based on Availability)
- 20.2.11 VEECO Instruments Inc
- 20.2.11.1. Overview
- 20.2.11.2. Products
- 20.2.11.3. SWOT Analysis
- 20.2.11.4. Recent Developments
- 20.2.11.5. Financials (Based on Availability)
- 20.2.1 KLA Corporation
List of Figures
- Figure 1: Global Semiconductor Production Equipment Industry Revenue Breakdown (Million, %) by Region 2024 & 2032
- Figure 2: Global Semiconductor Production Equipment Industry Volume Breakdown (K Unit, %) by Region 2024 & 2032
- Figure 3: North America Semiconductor Production Equipment Industry Revenue (Million), by Country 2024 & 2032
- Figure 4: North America Semiconductor Production Equipment Industry Volume (K Unit), by Country 2024 & 2032
- Figure 5: North America Semiconductor Production Equipment Industry Revenue Share (%), by Country 2024 & 2032
- Figure 6: North America Semiconductor Production Equipment Industry Volume Share (%), by Country 2024 & 2032
- Figure 7: Europe Semiconductor Production Equipment Industry Revenue (Million), by Country 2024 & 2032
- Figure 8: Europe Semiconductor Production Equipment Industry Volume (K Unit), by Country 2024 & 2032
- Figure 9: Europe Semiconductor Production Equipment Industry Revenue Share (%), by Country 2024 & 2032
- Figure 10: Europe Semiconductor Production Equipment Industry Volume Share (%), by Country 2024 & 2032
- Figure 11: Asia Pacific Semiconductor Production Equipment Industry Revenue (Million), by Country 2024 & 2032
- Figure 12: Asia Pacific Semiconductor Production Equipment Industry Volume (K Unit), by Country 2024 & 2032
- Figure 13: Asia Pacific Semiconductor Production Equipment Industry Revenue Share (%), by Country 2024 & 2032
- Figure 14: Asia Pacific Semiconductor Production Equipment Industry Volume Share (%), by Country 2024 & 2032
- Figure 15: South America Semiconductor Production Equipment Industry Revenue (Million), by Country 2024 & 2032
- Figure 16: South America Semiconductor Production Equipment Industry Volume (K Unit), by Country 2024 & 2032
- Figure 17: South America Semiconductor Production Equipment Industry Revenue Share (%), by Country 2024 & 2032
- Figure 18: South America Semiconductor Production Equipment Industry Volume Share (%), by Country 2024 & 2032
- Figure 19: North America Semiconductor Production Equipment Industry Revenue (Million), by Country 2024 & 2032
- Figure 20: North America Semiconductor Production Equipment Industry Volume (K Unit), by Country 2024 & 2032
- Figure 21: North America Semiconductor Production Equipment Industry Revenue Share (%), by Country 2024 & 2032
- Figure 22: North America Semiconductor Production Equipment Industry Volume Share (%), by Country 2024 & 2032
- Figure 23: MEA Semiconductor Production Equipment Industry Revenue (Million), by Country 2024 & 2032
- Figure 24: MEA Semiconductor Production Equipment Industry Volume (K Unit), by Country 2024 & 2032
- Figure 25: MEA Semiconductor Production Equipment Industry Revenue Share (%), by Country 2024 & 2032
- Figure 26: MEA Semiconductor Production Equipment Industry Volume Share (%), by Country 2024 & 2032
- Figure 27: United States Semiconductor Production Equipment Industry Revenue (Million), by Type 2024 & 2032
- Figure 28: United States Semiconductor Production Equipment Industry Volume (K Unit), by Type 2024 & 2032
- Figure 29: United States Semiconductor Production Equipment Industry Revenue Share (%), by Type 2024 & 2032
- Figure 30: United States Semiconductor Production Equipment Industry Volume Share (%), by Type 2024 & 2032
- Figure 31: United States Semiconductor Production Equipment Industry Revenue (Million), by End-user Industry 2024 & 2032
- Figure 32: United States Semiconductor Production Equipment Industry Volume (K Unit), by End-user Industry 2024 & 2032
- Figure 33: United States Semiconductor Production Equipment Industry Revenue Share (%), by End-user Industry 2024 & 2032
- Figure 34: United States Semiconductor Production Equipment Industry Volume Share (%), by End-user Industry 2024 & 2032
- Figure 35: United States Semiconductor Production Equipment Industry Revenue (Million), by Country 2024 & 2032
- Figure 36: United States Semiconductor Production Equipment Industry Volume (K Unit), by Country 2024 & 2032
- Figure 37: United States Semiconductor Production Equipment Industry Revenue Share (%), by Country 2024 & 2032
- Figure 38: United States Semiconductor Production Equipment Industry Volume Share (%), by Country 2024 & 2032
- Figure 39: Europe Semiconductor Production Equipment Industry Revenue (Million), by Type 2024 & 2032
- Figure 40: Europe Semiconductor Production Equipment Industry Volume (K Unit), by Type 2024 & 2032
- Figure 41: Europe Semiconductor Production Equipment Industry Revenue Share (%), by Type 2024 & 2032
- Figure 42: Europe Semiconductor Production Equipment Industry Volume Share (%), by Type 2024 & 2032
- Figure 43: Europe Semiconductor Production Equipment Industry Revenue (Million), by End-user Industry 2024 & 2032
- Figure 44: Europe Semiconductor Production Equipment Industry Volume (K Unit), by End-user Industry 2024 & 2032
- Figure 45: Europe Semiconductor Production Equipment Industry Revenue Share (%), by End-user Industry 2024 & 2032
- Figure 46: Europe Semiconductor Production Equipment Industry Volume Share (%), by End-user Industry 2024 & 2032
- Figure 47: Europe Semiconductor Production Equipment Industry Revenue (Million), by Country 2024 & 2032
- Figure 48: Europe Semiconductor Production Equipment Industry Volume (K Unit), by Country 2024 & 2032
- Figure 49: Europe Semiconductor Production Equipment Industry Revenue Share (%), by Country 2024 & 2032
- Figure 50: Europe Semiconductor Production Equipment Industry Volume Share (%), by Country 2024 & 2032
- Figure 51: China Semiconductor Production Equipment Industry Revenue (Million), by Type 2024 & 2032
- Figure 52: China Semiconductor Production Equipment Industry Volume (K Unit), by Type 2024 & 2032
- Figure 53: China Semiconductor Production Equipment Industry Revenue Share (%), by Type 2024 & 2032
- Figure 54: China Semiconductor Production Equipment Industry Volume Share (%), by Type 2024 & 2032
- Figure 55: China Semiconductor Production Equipment Industry Revenue (Million), by End-user Industry 2024 & 2032
- Figure 56: China Semiconductor Production Equipment Industry Volume (K Unit), by End-user Industry 2024 & 2032
- Figure 57: China Semiconductor Production Equipment Industry Revenue Share (%), by End-user Industry 2024 & 2032
- Figure 58: China Semiconductor Production Equipment Industry Volume Share (%), by End-user Industry 2024 & 2032
- Figure 59: China Semiconductor Production Equipment Industry Revenue (Million), by Country 2024 & 2032
- Figure 60: China Semiconductor Production Equipment Industry Volume (K Unit), by Country 2024 & 2032
- Figure 61: China Semiconductor Production Equipment Industry Revenue Share (%), by Country 2024 & 2032
- Figure 62: China Semiconductor Production Equipment Industry Volume Share (%), by Country 2024 & 2032
- Figure 63: South Korea Semiconductor Production Equipment Industry Revenue (Million), by Type 2024 & 2032
- Figure 64: South Korea Semiconductor Production Equipment Industry Volume (K Unit), by Type 2024 & 2032
- Figure 65: South Korea Semiconductor Production Equipment Industry Revenue Share (%), by Type 2024 & 2032
- Figure 66: South Korea Semiconductor Production Equipment Industry Volume Share (%), by Type 2024 & 2032
- Figure 67: South Korea Semiconductor Production Equipment Industry Revenue (Million), by End-user Industry 2024 & 2032
- Figure 68: South Korea Semiconductor Production Equipment Industry Volume (K Unit), by End-user Industry 2024 & 2032
- Figure 69: South Korea Semiconductor Production Equipment Industry Revenue Share (%), by End-user Industry 2024 & 2032
- Figure 70: South Korea Semiconductor Production Equipment Industry Volume Share (%), by End-user Industry 2024 & 2032
- Figure 71: South Korea Semiconductor Production Equipment Industry Revenue (Million), by Country 2024 & 2032
- Figure 72: South Korea Semiconductor Production Equipment Industry Volume (K Unit), by Country 2024 & 2032
- Figure 73: South Korea Semiconductor Production Equipment Industry Revenue Share (%), by Country 2024 & 2032
- Figure 74: South Korea Semiconductor Production Equipment Industry Volume Share (%), by Country 2024 & 2032
- Figure 75: Taiwan Semiconductor Production Equipment Industry Revenue (Million), by Type 2024 & 2032
- Figure 76: Taiwan Semiconductor Production Equipment Industry Volume (K Unit), by Type 2024 & 2032
- Figure 77: Taiwan Semiconductor Production Equipment Industry Revenue Share (%), by Type 2024 & 2032
- Figure 78: Taiwan Semiconductor Production Equipment Industry Volume Share (%), by Type 2024 & 2032
- Figure 79: Taiwan Semiconductor Production Equipment Industry Revenue (Million), by End-user Industry 2024 & 2032
- Figure 80: Taiwan Semiconductor Production Equipment Industry Volume (K Unit), by End-user Industry 2024 & 2032
- Figure 81: Taiwan Semiconductor Production Equipment Industry Revenue Share (%), by End-user Industry 2024 & 2032
- Figure 82: Taiwan Semiconductor Production Equipment Industry Volume Share (%), by End-user Industry 2024 & 2032
- Figure 83: Taiwan Semiconductor Production Equipment Industry Revenue (Million), by Country 2024 & 2032
- Figure 84: Taiwan Semiconductor Production Equipment Industry Volume (K Unit), by Country 2024 & 2032
- Figure 85: Taiwan Semiconductor Production Equipment Industry Revenue Share (%), by Country 2024 & 2032
- Figure 86: Taiwan Semiconductor Production Equipment Industry Volume Share (%), by Country 2024 & 2032
- Figure 87: Japan Semiconductor Production Equipment Industry Revenue (Million), by Type 2024 & 2032
- Figure 88: Japan Semiconductor Production Equipment Industry Volume (K Unit), by Type 2024 & 2032
- Figure 89: Japan Semiconductor Production Equipment Industry Revenue Share (%), by Type 2024 & 2032
- Figure 90: Japan Semiconductor Production Equipment Industry Volume Share (%), by Type 2024 & 2032
- Figure 91: Japan Semiconductor Production Equipment Industry Revenue (Million), by End-user Industry 2024 & 2032
- Figure 92: Japan Semiconductor Production Equipment Industry Volume (K Unit), by End-user Industry 2024 & 2032
- Figure 93: Japan Semiconductor Production Equipment Industry Revenue Share (%), by End-user Industry 2024 & 2032
- Figure 94: Japan Semiconductor Production Equipment Industry Volume Share (%), by End-user Industry 2024 & 2032
- Figure 95: Japan Semiconductor Production Equipment Industry Revenue (Million), by Country 2024 & 2032
- Figure 96: Japan Semiconductor Production Equipment Industry Volume (K Unit), by Country 2024 & 2032
- Figure 97: Japan Semiconductor Production Equipment Industry Revenue Share (%), by Country 2024 & 2032
- Figure 98: Japan Semiconductor Production Equipment Industry Volume Share (%), by Country 2024 & 2032
- Figure 99: Latin America Semiconductor Production Equipment Industry Revenue (Million), by Type 2024 & 2032
- Figure 100: Latin America Semiconductor Production Equipment Industry Volume (K Unit), by Type 2024 & 2032
- Figure 101: Latin America Semiconductor Production Equipment Industry Revenue Share (%), by Type 2024 & 2032
- Figure 102: Latin America Semiconductor Production Equipment Industry Volume Share (%), by Type 2024 & 2032
- Figure 103: Latin America Semiconductor Production Equipment Industry Revenue (Million), by End-user Industry 2024 & 2032
- Figure 104: Latin America Semiconductor Production Equipment Industry Volume (K Unit), by End-user Industry 2024 & 2032
- Figure 105: Latin America Semiconductor Production Equipment Industry Revenue Share (%), by End-user Industry 2024 & 2032
- Figure 106: Latin America Semiconductor Production Equipment Industry Volume Share (%), by End-user Industry 2024 & 2032
- Figure 107: Latin America Semiconductor Production Equipment Industry Revenue (Million), by Country 2024 & 2032
- Figure 108: Latin America Semiconductor Production Equipment Industry Volume (K Unit), by Country 2024 & 2032
- Figure 109: Latin America Semiconductor Production Equipment Industry Revenue Share (%), by Country 2024 & 2032
- Figure 110: Latin America Semiconductor Production Equipment Industry Volume Share (%), by Country 2024 & 2032
- Figure 111: Middle East and Africa Semiconductor Production Equipment Industry Revenue (Million), by Type 2024 & 2032
- Figure 112: Middle East and Africa Semiconductor Production Equipment Industry Volume (K Unit), by Type 2024 & 2032
- Figure 113: Middle East and Africa Semiconductor Production Equipment Industry Revenue Share (%), by Type 2024 & 2032
- Figure 114: Middle East and Africa Semiconductor Production Equipment Industry Volume Share (%), by Type 2024 & 2032
- Figure 115: Middle East and Africa Semiconductor Production Equipment Industry Revenue (Million), by End-user Industry 2024 & 2032
- Figure 116: Middle East and Africa Semiconductor Production Equipment Industry Volume (K Unit), by End-user Industry 2024 & 2032
- Figure 117: Middle East and Africa Semiconductor Production Equipment Industry Revenue Share (%), by End-user Industry 2024 & 2032
- Figure 118: Middle East and Africa Semiconductor Production Equipment Industry Volume Share (%), by End-user Industry 2024 & 2032
- Figure 119: Middle East and Africa Semiconductor Production Equipment Industry Revenue (Million), by Country 2024 & 2032
- Figure 120: Middle East and Africa Semiconductor Production Equipment Industry Volume (K Unit), by Country 2024 & 2032
- Figure 121: Middle East and Africa Semiconductor Production Equipment Industry Revenue Share (%), by Country 2024 & 2032
- Figure 122: Middle East and Africa Semiconductor Production Equipment Industry Volume Share (%), by Country 2024 & 2032
List of Tables
- Table 1: Global Semiconductor Production Equipment Industry Revenue Million Forecast, by Region 2019 & 2032
- Table 2: Global Semiconductor Production Equipment Industry Volume K Unit Forecast, by Region 2019 & 2032
- Table 3: Global Semiconductor Production Equipment Industry Revenue Million Forecast, by Type 2019 & 2032
- Table 4: Global Semiconductor Production Equipment Industry Volume K Unit Forecast, by Type 2019 & 2032
- Table 5: Global Semiconductor Production Equipment Industry Revenue Million Forecast, by End-user Industry 2019 & 2032
- Table 6: Global Semiconductor Production Equipment Industry Volume K Unit Forecast, by End-user Industry 2019 & 2032
- Table 7: Global Semiconductor Production Equipment Industry Revenue Million Forecast, by Region 2019 & 2032
- Table 8: Global Semiconductor Production Equipment Industry Volume K Unit Forecast, by Region 2019 & 2032
- Table 9: Global Semiconductor Production Equipment Industry Revenue Million Forecast, by Country 2019 & 2032
- Table 10: Global Semiconductor Production Equipment Industry Volume K Unit Forecast, by Country 2019 & 2032
- Table 11: United States Semiconductor Production Equipment Industry Revenue (Million) Forecast, by Application 2019 & 2032
- Table 12: United States Semiconductor Production Equipment Industry Volume (K Unit) Forecast, by Application 2019 & 2032
- Table 13: Canada Semiconductor Production Equipment Industry Revenue (Million) Forecast, by Application 2019 & 2032
- Table 14: Canada Semiconductor Production Equipment Industry Volume (K Unit) Forecast, by Application 2019 & 2032
- Table 15: Mexico Semiconductor Production Equipment Industry Revenue (Million) Forecast, by Application 2019 & 2032
- Table 16: Mexico Semiconductor Production Equipment Industry Volume (K Unit) Forecast, by Application 2019 & 2032
- Table 17: Global Semiconductor Production Equipment Industry Revenue Million Forecast, by Country 2019 & 2032
- Table 18: Global Semiconductor Production Equipment Industry Volume K Unit Forecast, by Country 2019 & 2032
- Table 19: Germany Semiconductor Production Equipment Industry Revenue (Million) Forecast, by Application 2019 & 2032
- Table 20: Germany Semiconductor Production Equipment Industry Volume (K Unit) Forecast, by Application 2019 & 2032
- Table 21: United Kingdom Semiconductor Production Equipment Industry Revenue (Million) Forecast, by Application 2019 & 2032
- Table 22: United Kingdom Semiconductor Production Equipment Industry Volume (K Unit) Forecast, by Application 2019 & 2032
- Table 23: France Semiconductor Production Equipment Industry Revenue (Million) Forecast, by Application 2019 & 2032
- Table 24: France Semiconductor Production Equipment Industry Volume (K Unit) Forecast, by Application 2019 & 2032
- Table 25: Spain Semiconductor Production Equipment Industry Revenue (Million) Forecast, by Application 2019 & 2032
- Table 26: Spain Semiconductor Production Equipment Industry Volume (K Unit) Forecast, by Application 2019 & 2032
- Table 27: Italy Semiconductor Production Equipment Industry Revenue (Million) Forecast, by Application 2019 & 2032
- Table 28: Italy Semiconductor Production Equipment Industry Volume (K Unit) Forecast, by Application 2019 & 2032
- Table 29: Spain Semiconductor Production Equipment Industry Revenue (Million) Forecast, by Application 2019 & 2032
- Table 30: Spain Semiconductor Production Equipment Industry Volume (K Unit) Forecast, by Application 2019 & 2032
- Table 31: Belgium Semiconductor Production Equipment Industry Revenue (Million) Forecast, by Application 2019 & 2032
- Table 32: Belgium Semiconductor Production Equipment Industry Volume (K Unit) Forecast, by Application 2019 & 2032
- Table 33: Netherland Semiconductor Production Equipment Industry Revenue (Million) Forecast, by Application 2019 & 2032
- Table 34: Netherland Semiconductor Production Equipment Industry Volume (K Unit) Forecast, by Application 2019 & 2032
- Table 35: Nordics Semiconductor Production Equipment Industry Revenue (Million) Forecast, by Application 2019 & 2032
- Table 36: Nordics Semiconductor Production Equipment Industry Volume (K Unit) Forecast, by Application 2019 & 2032
- Table 37: Rest of Europe Semiconductor Production Equipment Industry Revenue (Million) Forecast, by Application 2019 & 2032
- Table 38: Rest of Europe Semiconductor Production Equipment Industry Volume (K Unit) Forecast, by Application 2019 & 2032
- Table 39: Global Semiconductor Production Equipment Industry Revenue Million Forecast, by Country 2019 & 2032
- Table 40: Global Semiconductor Production Equipment Industry Volume K Unit Forecast, by Country 2019 & 2032
- Table 41: China Semiconductor Production Equipment Industry Revenue (Million) Forecast, by Application 2019 & 2032
- Table 42: China Semiconductor Production Equipment Industry Volume (K Unit) Forecast, by Application 2019 & 2032
- Table 43: Japan Semiconductor Production Equipment Industry Revenue (Million) Forecast, by Application 2019 & 2032
- Table 44: Japan Semiconductor Production Equipment Industry Volume (K Unit) Forecast, by Application 2019 & 2032
- Table 45: India Semiconductor Production Equipment Industry Revenue (Million) Forecast, by Application 2019 & 2032
- Table 46: India Semiconductor Production Equipment Industry Volume (K Unit) Forecast, by Application 2019 & 2032
- Table 47: South Korea Semiconductor Production Equipment Industry Revenue (Million) Forecast, by Application 2019 & 2032
- Table 48: South Korea Semiconductor Production Equipment Industry Volume (K Unit) Forecast, by Application 2019 & 2032
- Table 49: Southeast Asia Semiconductor Production Equipment Industry Revenue (Million) Forecast, by Application 2019 & 2032
- Table 50: Southeast Asia Semiconductor Production Equipment Industry Volume (K Unit) Forecast, by Application 2019 & 2032
- Table 51: Australia Semiconductor Production Equipment Industry Revenue (Million) Forecast, by Application 2019 & 2032
- Table 52: Australia Semiconductor Production Equipment Industry Volume (K Unit) Forecast, by Application 2019 & 2032
- Table 53: Indonesia Semiconductor Production Equipment Industry Revenue (Million) Forecast, by Application 2019 & 2032
- Table 54: Indonesia Semiconductor Production Equipment Industry Volume (K Unit) Forecast, by Application 2019 & 2032
- Table 55: Phillipes Semiconductor Production Equipment Industry Revenue (Million) Forecast, by Application 2019 & 2032
- Table 56: Phillipes Semiconductor Production Equipment Industry Volume (K Unit) Forecast, by Application 2019 & 2032
- Table 57: Singapore Semiconductor Production Equipment Industry Revenue (Million) Forecast, by Application 2019 & 2032
- Table 58: Singapore Semiconductor Production Equipment Industry Volume (K Unit) Forecast, by Application 2019 & 2032
- Table 59: Thailandc Semiconductor Production Equipment Industry Revenue (Million) Forecast, by Application 2019 & 2032
- Table 60: Thailandc Semiconductor Production Equipment Industry Volume (K Unit) Forecast, by Application 2019 & 2032
- Table 61: Rest of Asia Pacific Semiconductor Production Equipment Industry Revenue (Million) Forecast, by Application 2019 & 2032
- Table 62: Rest of Asia Pacific Semiconductor Production Equipment Industry Volume (K Unit) Forecast, by Application 2019 & 2032
- Table 63: Global Semiconductor Production Equipment Industry Revenue Million Forecast, by Country 2019 & 2032
- Table 64: Global Semiconductor Production Equipment Industry Volume K Unit Forecast, by Country 2019 & 2032
- Table 65: Brazil Semiconductor Production Equipment Industry Revenue (Million) Forecast, by Application 2019 & 2032
- Table 66: Brazil Semiconductor Production Equipment Industry Volume (K Unit) Forecast, by Application 2019 & 2032
- Table 67: Argentina Semiconductor Production Equipment Industry Revenue (Million) Forecast, by Application 2019 & 2032
- Table 68: Argentina Semiconductor Production Equipment Industry Volume (K Unit) Forecast, by Application 2019 & 2032
- Table 69: Peru Semiconductor Production Equipment Industry Revenue (Million) Forecast, by Application 2019 & 2032
- Table 70: Peru Semiconductor Production Equipment Industry Volume (K Unit) Forecast, by Application 2019 & 2032
- Table 71: Chile Semiconductor Production Equipment Industry Revenue (Million) Forecast, by Application 2019 & 2032
- Table 72: Chile Semiconductor Production Equipment Industry Volume (K Unit) Forecast, by Application 2019 & 2032
- Table 73: Colombia Semiconductor Production Equipment Industry Revenue (Million) Forecast, by Application 2019 & 2032
- Table 74: Colombia Semiconductor Production Equipment Industry Volume (K Unit) Forecast, by Application 2019 & 2032
- Table 75: Ecuador Semiconductor Production Equipment Industry Revenue (Million) Forecast, by Application 2019 & 2032
- Table 76: Ecuador Semiconductor Production Equipment Industry Volume (K Unit) Forecast, by Application 2019 & 2032
- Table 77: Venezuela Semiconductor Production Equipment Industry Revenue (Million) Forecast, by Application 2019 & 2032
- Table 78: Venezuela Semiconductor Production Equipment Industry Volume (K Unit) Forecast, by Application 2019 & 2032
- Table 79: Rest of South America Semiconductor Production Equipment Industry Revenue (Million) Forecast, by Application 2019 & 2032
- Table 80: Rest of South America Semiconductor Production Equipment Industry Volume (K Unit) Forecast, by Application 2019 & 2032
- Table 81: Global Semiconductor Production Equipment Industry Revenue Million Forecast, by Country 2019 & 2032
- Table 82: Global Semiconductor Production Equipment Industry Volume K Unit Forecast, by Country 2019 & 2032
- Table 83: United States Semiconductor Production Equipment Industry Revenue (Million) Forecast, by Application 2019 & 2032
- Table 84: United States Semiconductor Production Equipment Industry Volume (K Unit) Forecast, by Application 2019 & 2032
- Table 85: Canada Semiconductor Production Equipment Industry Revenue (Million) Forecast, by Application 2019 & 2032
- Table 86: Canada Semiconductor Production Equipment Industry Volume (K Unit) Forecast, by Application 2019 & 2032
- Table 87: Mexico Semiconductor Production Equipment Industry Revenue (Million) Forecast, by Application 2019 & 2032
- Table 88: Mexico Semiconductor Production Equipment Industry Volume (K Unit) Forecast, by Application 2019 & 2032
- Table 89: Global Semiconductor Production Equipment Industry Revenue Million Forecast, by Country 2019 & 2032
- Table 90: Global Semiconductor Production Equipment Industry Volume K Unit Forecast, by Country 2019 & 2032
- Table 91: United Arab Emirates Semiconductor Production Equipment Industry Revenue (Million) Forecast, by Application 2019 & 2032
- Table 92: United Arab Emirates Semiconductor Production Equipment Industry Volume (K Unit) Forecast, by Application 2019 & 2032
- Table 93: Saudi Arabia Semiconductor Production Equipment Industry Revenue (Million) Forecast, by Application 2019 & 2032
- Table 94: Saudi Arabia Semiconductor Production Equipment Industry Volume (K Unit) Forecast, by Application 2019 & 2032
- Table 95: South Africa Semiconductor Production Equipment Industry Revenue (Million) Forecast, by Application 2019 & 2032
- Table 96: South Africa Semiconductor Production Equipment Industry Volume (K Unit) Forecast, by Application 2019 & 2032
- Table 97: Rest of Middle East and Africa Semiconductor Production Equipment Industry Revenue (Million) Forecast, by Application 2019 & 2032
- Table 98: Rest of Middle East and Africa Semiconductor Production Equipment Industry Volume (K Unit) Forecast, by Application 2019 & 2032
- Table 99: Global Semiconductor Production Equipment Industry Revenue Million Forecast, by Type 2019 & 2032
- Table 100: Global Semiconductor Production Equipment Industry Volume K Unit Forecast, by Type 2019 & 2032
- Table 101: Global Semiconductor Production Equipment Industry Revenue Million Forecast, by End-user Industry 2019 & 2032
- Table 102: Global Semiconductor Production Equipment Industry Volume K Unit Forecast, by End-user Industry 2019 & 2032
- Table 103: Global Semiconductor Production Equipment Industry Revenue Million Forecast, by Country 2019 & 2032
- Table 104: Global Semiconductor Production Equipment Industry Volume K Unit Forecast, by Country 2019 & 2032
- Table 105: Global Semiconductor Production Equipment Industry Revenue Million Forecast, by Type 2019 & 2032
- Table 106: Global Semiconductor Production Equipment Industry Volume K Unit Forecast, by Type 2019 & 2032
- Table 107: Global Semiconductor Production Equipment Industry Revenue Million Forecast, by End-user Industry 2019 & 2032
- Table 108: Global Semiconductor Production Equipment Industry Volume K Unit Forecast, by End-user Industry 2019 & 2032
- Table 109: Global Semiconductor Production Equipment Industry Revenue Million Forecast, by Country 2019 & 2032
- Table 110: Global Semiconductor Production Equipment Industry Volume K Unit Forecast, by Country 2019 & 2032
- Table 111: Global Semiconductor Production Equipment Industry Revenue Million Forecast, by Type 2019 & 2032
- Table 112: Global Semiconductor Production Equipment Industry Volume K Unit Forecast, by Type 2019 & 2032
- Table 113: Global Semiconductor Production Equipment Industry Revenue Million Forecast, by End-user Industry 2019 & 2032
- Table 114: Global Semiconductor Production Equipment Industry Volume K Unit Forecast, by End-user Industry 2019 & 2032
- Table 115: Global Semiconductor Production Equipment Industry Revenue Million Forecast, by Country 2019 & 2032
- Table 116: Global Semiconductor Production Equipment Industry Volume K Unit Forecast, by Country 2019 & 2032
- Table 117: Global Semiconductor Production Equipment Industry Revenue Million Forecast, by Type 2019 & 2032
- Table 118: Global Semiconductor Production Equipment Industry Volume K Unit Forecast, by Type 2019 & 2032
- Table 119: Global Semiconductor Production Equipment Industry Revenue Million Forecast, by End-user Industry 2019 & 2032
- Table 120: Global Semiconductor Production Equipment Industry Volume K Unit Forecast, by End-user Industry 2019 & 2032
- Table 121: Global Semiconductor Production Equipment Industry Revenue Million Forecast, by Country 2019 & 2032
- Table 122: Global Semiconductor Production Equipment Industry Volume K Unit Forecast, by Country 2019 & 2032
- Table 123: Global Semiconductor Production Equipment Industry Revenue Million Forecast, by Type 2019 & 2032
- Table 124: Global Semiconductor Production Equipment Industry Volume K Unit Forecast, by Type 2019 & 2032
- Table 125: Global Semiconductor Production Equipment Industry Revenue Million Forecast, by End-user Industry 2019 & 2032
- Table 126: Global Semiconductor Production Equipment Industry Volume K Unit Forecast, by End-user Industry 2019 & 2032
- Table 127: Global Semiconductor Production Equipment Industry Revenue Million Forecast, by Country 2019 & 2032
- Table 128: Global Semiconductor Production Equipment Industry Volume K Unit Forecast, by Country 2019 & 2032
- Table 129: Global Semiconductor Production Equipment Industry Revenue Million Forecast, by Type 2019 & 2032
- Table 130: Global Semiconductor Production Equipment Industry Volume K Unit Forecast, by Type 2019 & 2032
- Table 131: Global Semiconductor Production Equipment Industry Revenue Million Forecast, by End-user Industry 2019 & 2032
- Table 132: Global Semiconductor Production Equipment Industry Volume K Unit Forecast, by End-user Industry 2019 & 2032
- Table 133: Global Semiconductor Production Equipment Industry Revenue Million Forecast, by Country 2019 & 2032
- Table 134: Global Semiconductor Production Equipment Industry Volume K Unit Forecast, by Country 2019 & 2032
- Table 135: Global Semiconductor Production Equipment Industry Revenue Million Forecast, by Type 2019 & 2032
- Table 136: Global Semiconductor Production Equipment Industry Volume K Unit Forecast, by Type 2019 & 2032
- Table 137: Global Semiconductor Production Equipment Industry Revenue Million Forecast, by End-user Industry 2019 & 2032
- Table 138: Global Semiconductor Production Equipment Industry Volume K Unit Forecast, by End-user Industry 2019 & 2032
- Table 139: Global Semiconductor Production Equipment Industry Revenue Million Forecast, by Country 2019 & 2032
- Table 140: Global Semiconductor Production Equipment Industry Volume K Unit Forecast, by Country 2019 & 2032
- Table 141: Global Semiconductor Production Equipment Industry Revenue Million Forecast, by Type 2019 & 2032
- Table 142: Global Semiconductor Production Equipment Industry Volume K Unit Forecast, by Type 2019 & 2032
- Table 143: Global Semiconductor Production Equipment Industry Revenue Million Forecast, by End-user Industry 2019 & 2032
- Table 144: Global Semiconductor Production Equipment Industry Volume K Unit Forecast, by End-user Industry 2019 & 2032
- Table 145: Global Semiconductor Production Equipment Industry Revenue Million Forecast, by Country 2019 & 2032
- Table 146: Global Semiconductor Production Equipment Industry Volume K Unit Forecast, by Country 2019 & 2032
Frequently Asked Questions
1. What is the projected Compound Annual Growth Rate (CAGR) of the Semiconductor Production Equipment Industry?
The projected CAGR is approximately 8.65%.
2. Which companies are prominent players in the Semiconductor Production Equipment Industry?
Key companies in the market include KLA Corporation, Nikon Corporation, Applied Materials Inc, Hitachi High -Technologies Corporation, Screen Holdings Co Lt, Plasma Therm, Tokyo Electron Limited, ASML Holding NV, Carl Zeiss AG, LAM Research Corporation, VEECO Instruments Inc.
3. What are the main segments of the Semiconductor Production Equipment Industry?
The market segments include Type, End-user Industry.
4. Can you provide details about the market size?
The market size is estimated to be USD 99.36 Million as of 2022.
5. What are some drivers contributing to market growth?
Increasing Needs of Consumer Electronic Devices Boosting the Manufacturing Prospects; Proliferation of Artificial Intelligence. IoT. and Connected Devices Across Industry Verticals.
6. What are the notable trends driving market growth?
Semiconductor Fabrication Plant to be the Largest End-user Industry.
7. Are there any restraints impacting market growth?
Dynamic Nature of Technologies Requires Several Changes in Manufacturing Equipment.
8. Can you provide examples of recent developments in the market?
February 2024 - At the SPIE Advanced Lithography + Patterning conference, Applied Materials unveiled a new lineup of products to address the intricate patterning demands of chips in the "Angstrom era," specifically at 2nm and below process nodes. The portfolio leverages innovative materials engineering and metrology techniques to tackle challenges associated with EUV and high-NA EUV patterning, such as line edge roughness and edge placement errors. This expansion in Applied Materials' Patterning Solutions Portfolio aims to assist chipmakers in navigating issues like tip-to-tip spacing limitations and bridge defects as they advance towards increasingly minuscule chip dimensions.
9. What pricing options are available for accessing the report?
Pricing options include single-user, multi-user, and enterprise licenses priced at USD 4750, USD 5250, and USD 8750 respectively.
10. Is the market size provided in terms of value or volume?
The market size is provided in terms of value, measured in Million and volume, measured in K Unit.
11. Are there any specific market keywords associated with the report?
Yes, the market keyword associated with the report is "Semiconductor Production Equipment Industry," which aids in identifying and referencing the specific market segment covered.
12. How do I determine which pricing option suits my needs best?
The pricing options vary based on user requirements and access needs. Individual users may opt for single-user licenses, while businesses requiring broader access may choose multi-user or enterprise licenses for cost-effective access to the report.
13. Are there any additional resources or data provided in the Semiconductor Production Equipment Industry report?
While the report offers comprehensive insights, it's advisable to review the specific contents or supplementary materials provided to ascertain if additional resources or data are available.
14. How can I stay updated on further developments or reports in the Semiconductor Production Equipment Industry?
To stay informed about further developments, trends, and reports in the Semiconductor Production Equipment Industry, consider subscribing to industry newsletters, following relevant companies and organizations, or regularly checking reputable industry news sources and publications.
Methodology
Step 1 - Identification of Relevant Samples Size from Population Database


Step 2 - Approaches for Defining Global Market Size (Value, Volume* & Price*)

Note*: In applicable scenarios
Step 3 - Data Sources
Primary Research
- Web Analytics
- Survey Reports
- Research Institute
- Latest Research Reports
- Opinion Leaders
Secondary Research
- Annual Reports
- White Paper
- Latest Press Release
- Industry Association
- Paid Database
- Investor Presentations

Step 4 - Data Triangulation
Involves using different sources of information in order to increase the validity of a study
These sources are likely to be stakeholders in a program - participants, other researchers, program staff, other community members, and so on.
Then we put all data in single framework & apply various statistical tools to find out the dynamic on the market.
During the analysis stage, feedback from the stakeholder groups would be compared to determine areas of agreement as well as areas of divergence


