
Key Insights
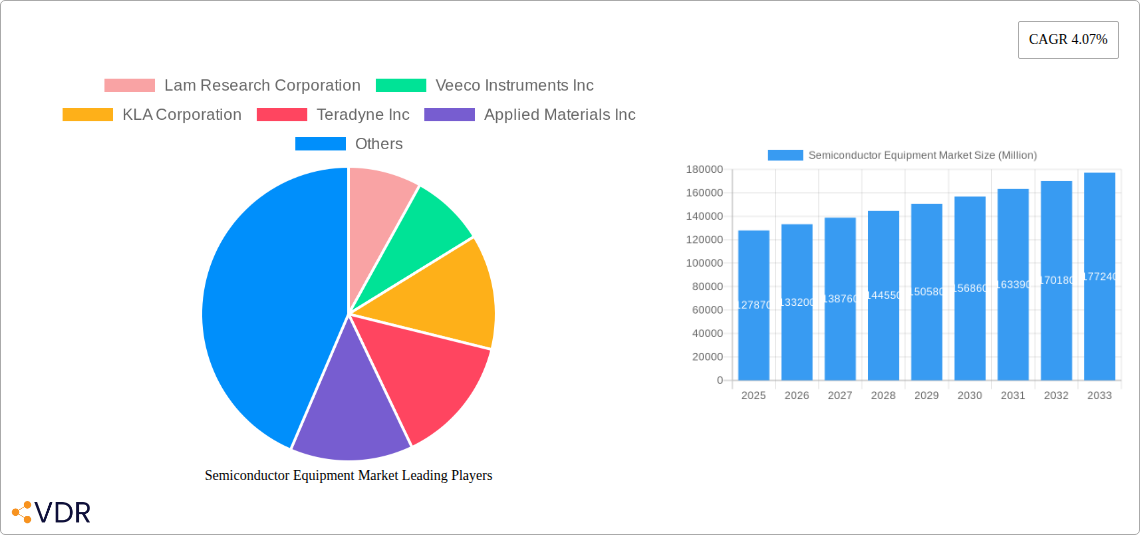
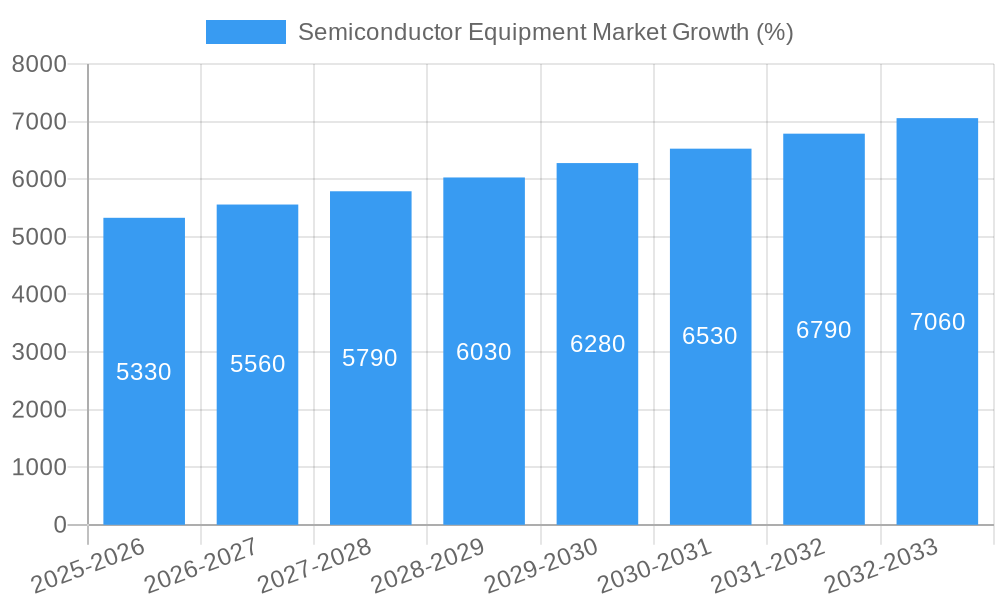
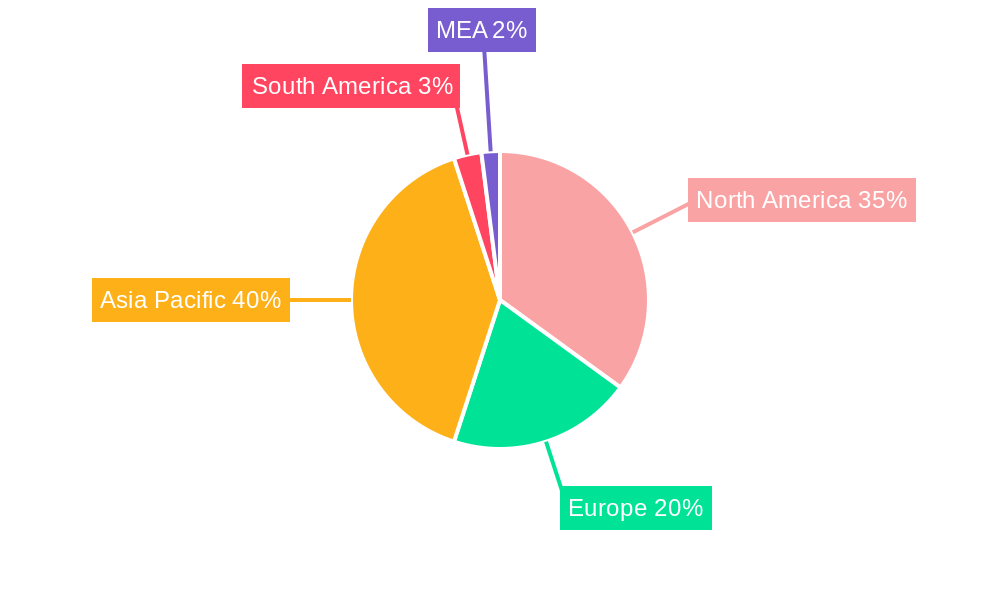
The semiconductor equipment market, valued at $127.87 billion in 2025, is projected to experience robust growth, driven by the increasing demand for advanced semiconductor devices across various applications, including 5G infrastructure, artificial intelligence, and high-performance computing. A compound annual growth rate (CAGR) of 4.07% from 2025 to 2033 indicates a significant expansion of this market. Key growth drivers include the ongoing miniaturization of semiconductor chips, requiring sophisticated and advanced equipment, and the rising adoption of advanced packaging technologies to enhance chip performance and efficiency. The market is segmented by equipment type (front-end and back-end) and supply chain participants (Integrated Device Manufacturers (IDMs), Outsourced Semiconductor Assembly and Test (OSAT) providers, and foundries). Competition is fierce among leading players such as Lam Research, Applied Materials, and ASML, each vying for market share through innovation and strategic partnerships. While strong demand fuels growth, challenges remain, including the cyclical nature of the semiconductor industry, geopolitical uncertainties impacting supply chains, and the high capital investment needed for advanced equipment. The Asia-Pacific region, particularly China, South Korea, and Taiwan, is expected to dominate the market due to the concentration of major semiconductor manufacturers. North America and Europe will also contribute significantly, driven by robust demand from the automotive and consumer electronics sectors.
The forecast period of 2025-2033 suggests a continuous expansion of the semiconductor equipment market, with growth likely accelerating in response to long-term technological advancements and increased digitalization across all sectors. The market will likely see increased focus on automation and AI-driven manufacturing processes, leading to improved efficiency and reduced production costs. Further segmentation within the market will likely emerge with the development of specialized equipment tailored to specific semiconductor technologies, such as advanced nodes and new materials. Government initiatives aimed at promoting domestic semiconductor manufacturing capacity will also play a pivotal role in influencing regional market growth and investment patterns. Sustainable manufacturing practices will increasingly influence equipment design and operations, driving demand for energy-efficient and environmentally friendly technologies.
This in-depth report provides a comprehensive analysis of the Semiconductor Equipment Market, encompassing market dynamics, growth trends, regional dominance, product landscape, key players, and future outlook. The study covers the period from 2019 to 2033, with a focus on the forecast period 2025-2033 and a base year of 2025. The report segments the market by equipment type (Front-end and Back-end Equipment) and supply chain participants (IDM, OSAT, and Foundry), offering granular insights into market size and growth potential. Key players such as Lam Research Corporation, Applied Materials Inc., and Tokyo Electron Limited are analyzed, highlighting their strategies and market positioning. This report is an invaluable resource for industry professionals, investors, and strategic decision-makers seeking to understand and capitalize on the opportunities within this dynamic market.
Semiconductor Equipment Market Market Dynamics & Structure
The semiconductor equipment market is characterized by high concentration among a few leading players, intense competition fueled by technological innovation, and evolving regulatory landscapes. Market consolidation through mergers and acquisitions (M&A) is a significant trend, shaping the competitive landscape. Technological advancements, particularly in advanced node fabrication and packaging technologies, drive market growth. Government regulations and incentives related to semiconductor manufacturing (e.g., CHIPS Act) play a crucial role, impacting investment and capacity expansion. The emergence of alternative technologies and materials presents both opportunities and challenges for existing players.
- Market Concentration: The top 5 players hold approximately xx% of the market share in 2025.
- Technological Innovation: Focus on EUV lithography, advanced packaging, and materials science drives significant investments.
- M&A Activity: An estimated xx M&A deals were concluded between 2019 and 2024, with a total value of approximately $xx million.
- Regulatory Frameworks: Government initiatives like the CHIPS Act influence investment and manufacturing location decisions.
- Competitive Substitutes: The emergence of new materials and processes could disrupt existing technologies.
- End-User Demographics: Foundries and IDMs dominate demand, followed by OSATs.
Semiconductor Equipment Market Growth Trends & Insights
The global semiconductor equipment market is experiencing robust growth, driven by increasing demand for advanced semiconductor devices across various end-use sectors, including 5G, AI, and automotive. The market is expected to witness a compound annual growth rate (CAGR) of xx% during the forecast period (2025-2033), reaching a market size of $xx million by 2033 from $xx million in 2025. This growth is propelled by technological advancements, such as the adoption of EUV lithography and advanced packaging technologies, leading to higher device performance and integration density. The increasing adoption of AI and IoT devices further fuels demand. The market penetration of advanced semiconductor equipment is gradually increasing, and significant shifts in consumer behavior towards high-performance devices have positively impacted the industry's growth. Changing manufacturing landscapes influence regional adoption rates.
Dominant Regions, Countries, or Segments in Semiconductor Equipment Market
The Asia-Pacific region, particularly Taiwan, South Korea, and China, dominates the semiconductor equipment market, driven by strong semiconductor manufacturing hubs and substantial investments in advanced fabrication facilities. Within equipment types, front-end equipment commands a larger market share compared to back-end equipment, primarily due to the higher complexity and investment required for advanced node manufacturing. Among supply chain participants, foundries display significant growth potential, given their rising importance in the semiconductor industry.
- Asia-Pacific Dominance: High concentration of semiconductor manufacturing facilities drives market leadership.
- Front-end Equipment: Higher demand due to technological complexity and advanced node manufacturing.
- Foundry Segment: Rapid growth driven by increasing outsourcing and capacity expansion.
- Government Policies: Subsidies and incentives in key regions stimulate investment.
- Infrastructure Development: Well-established infrastructure supports manufacturing activities.
Semiconductor Equipment Market Product Landscape
The semiconductor equipment market offers a diverse range of sophisticated systems, each designed for specific manufacturing processes. These systems are characterized by their high precision, automation capabilities, and ability to handle increasingly smaller feature sizes. Continuous innovation focuses on enhancing throughput, improving yield, and reducing production costs. Key features include advanced process control, high-resolution imaging, and sophisticated automation systems. Product differentiation relies heavily on performance metrics like throughput, defect rates, and cost-effectiveness.
Key Drivers, Barriers & Challenges in Semiconductor Equipment Market
Key Drivers:
- Technological advancements (EUV lithography, advanced packaging).
- Increasing demand for high-performance semiconductors (5G, AI, automotive).
- Government support and incentives (e.g., CHIPS Act).
Key Challenges:
- Supply chain disruptions (material shortages, geopolitical instability).
- High capital expenditure requirements for new equipment.
- Intense competition and pricing pressures.
- Regulatory compliance and environmental concerns.
Emerging Opportunities in Semiconductor Equipment Market
- Growth in niche markets (e.g., power semiconductors, MEMS).
- Development of new materials and processes (e.g., GaN, SiC).
- Advancements in AI-powered process control and automation.
Growth Accelerators in the Semiconductor Equipment Market Industry
The long-term growth of the semiconductor equipment market will be fueled by continued innovation in semiconductor technology, the expansion of manufacturing capacity to meet growing demand, and strategic collaborations between equipment manufacturers and semiconductor companies. Furthermore, government investments in research and development will contribute significantly to advancements in equipment technology.
Key Players Shaping the Semiconductor Equipment Market Market
- Lam Research Corporation
- Veeco Instruments Inc
- KLA Corporation
- Teradyne Inc
- Applied Materials Inc
- Screen Holdings Co Ltd
- Hitachi High-Technologies Corporation
- Tokyo Electron Limited
- ASML Holding Semiconductor Company
Notable Milestones in Semiconductor Equipment Market Sector
- June 2022: RIBER receives an order for a multi-4' GSMBE 49 production system, highlighting the demand for advanced epitaxy equipment.
- June 2022: Veeco's Propel MOCVD system is selected by the Taiwan Semiconductor Research Institute, showcasing the adoption of advanced deposition technologies.
In-Depth Semiconductor Equipment Market Market Outlook
The semiconductor equipment market is poised for continued strong growth, driven by technological advancements and increasing demand across various sectors. Strategic investments in R&D, collaborations, and expansion into emerging markets will be crucial for companies to capitalize on the immense growth opportunities within this dynamic market. The ongoing need for higher performance and smaller devices will support long-term market expansion.
Semiconductor Equipment Market Segmentation
-
1. Equipment Type
-
1.1. Front-end Equipment
- 1.1.1. Lithography Equipment
- 1.1.2. Etch Equipment
- 1.1.3. Deposition Equipment
- 1.1.4. Metrology/Inspection Equipment
- 1.1.5. Material Removal/Cleaning Equipment
- 1.1.6. Photoresist Processing Equipment
- 1.1.7. Other Equipment Types
-
1.2. Back-end Equipment
- 1.2.1. Test Equipment
- 1.2.2. Assembly and Packaging Equipment
-
1.1. Front-end Equipment
-
2. End-User Industry
- 2.1. consumer electronics
- 2.2. automotive
- 2.3. other industries
- 2.4. industrial
Semiconductor Equipment Market Segmentation By Geography
- 1. North America: United States Canada Mexico
- 2. Europe: Germany: France: Italy: United Kingdom Netherlands Rest of Europe
- 3. Europe: Germany: France: Italy: United Kingdom Netherlands Rest of Europe Asia Pacific: China, Japan, India, South Korea, Taiwan, Australia, Rest of Asia-Pacific
- 4. South America : Brazil, Argentina, Rest of South America
- 5. MEA: Middle East, Africa
Semiconductor Equipment Market REPORT HIGHLIGHTS
| Aspects | Details |
|---|---|
| Study Period | 2019-2033 |
| Base Year | 2024 |
| Estimated Year | 2025 |
| Forecast Period | 2025-2033 |
| Historical Period | 2019-2024 |
| Growth Rate | CAGR of 4.07% from 2019-2033 |
| Segmentation |
|
Table of Contents
- 1. Introduction
- 1.1. Research Scope
- 1.2. Market Segmentation
- 1.3. Research Methodology
- 1.4. Definitions and Assumptions
- 2. Executive Summary
- 2.1. Introduction
- 3. Market Dynamics
- 3.1. Introduction
- 3.2. Market Drivers
- 3.2.1 Increasing Demand for Consumer Electronic Devices; Proliferation of AI
- 3.2.2 IoT
- 3.2.3 And Connected Devices Across Industry Verticals
- 3.3. Market Restrains
- 3.3.1. Dynamic Nature of Technologies Requires Several Changes in Manufacturing Equipment
- 3.4. Market Trends
- 3.4.1. Increasing Demand for Consumer Electronic Devices
- 4. Market Factor Analysis
- 4.1. Porters Five Forces
- 4.2. Supply/Value Chain
- 4.3. PESTEL analysis
- 4.4. Market Entropy
- 4.5. Patent/Trademark Analysis
- 5. Global Semiconductor Equipment Market Analysis, Insights and Forecast, 2019-2031
- 5.1. Market Analysis, Insights and Forecast - by Equipment Type
- 5.1.1. Front-end Equipment
- 5.1.1.1. Lithography Equipment
- 5.1.1.2. Etch Equipment
- 5.1.1.3. Deposition Equipment
- 5.1.1.4. Metrology/Inspection Equipment
- 5.1.1.5. Material Removal/Cleaning Equipment
- 5.1.1.6. Photoresist Processing Equipment
- 5.1.1.7. Other Equipment Types
- 5.1.2. Back-end Equipment
- 5.1.2.1. Test Equipment
- 5.1.2.2. Assembly and Packaging Equipment
- 5.1.1. Front-end Equipment
- 5.2. Market Analysis, Insights and Forecast - by End-User Industry
- 5.2.1. consumer electronics
- 5.2.2. automotive
- 5.2.3. other industries
- 5.2.4. industrial
- 5.3. Market Analysis, Insights and Forecast - by Region
- 5.3.1. North America: United States Canada Mexico
- 5.3.2. Europe: Germany: France: Italy: United Kingdom Netherlands Rest of Europe
- 5.3.3. Europe: Germany: France: Italy: United Kingdom Netherlands Rest of Europe Asia Pacific: China, Japan, India, South Korea, Taiwan, Australia, Rest of Asia-Pacific
- 5.3.4. South America : Brazil, Argentina, Rest of South America
- 5.3.5. MEA: Middle East, Africa
- 5.1. Market Analysis, Insights and Forecast - by Equipment Type
- 6. North America: United States Canada Mexico Semiconductor Equipment Market Analysis, Insights and Forecast, 2019-2031
- 6.1. Market Analysis, Insights and Forecast - by Equipment Type
- 6.1.1. Front-end Equipment
- 6.1.1.1. Lithography Equipment
- 6.1.1.2. Etch Equipment
- 6.1.1.3. Deposition Equipment
- 6.1.1.4. Metrology/Inspection Equipment
- 6.1.1.5. Material Removal/Cleaning Equipment
- 6.1.1.6. Photoresist Processing Equipment
- 6.1.1.7. Other Equipment Types
- 6.1.2. Back-end Equipment
- 6.1.2.1. Test Equipment
- 6.1.2.2. Assembly and Packaging Equipment
- 6.1.1. Front-end Equipment
- 6.2. Market Analysis, Insights and Forecast - by End-User Industry
- 6.2.1. consumer electronics
- 6.2.2. automotive
- 6.2.3. other industries
- 6.2.4. industrial
- 6.1. Market Analysis, Insights and Forecast - by Equipment Type
- 7. Europe: Germany: France: Italy: United Kingdom Netherlands Rest of Europe Semiconductor Equipment Market Analysis, Insights and Forecast, 2019-2031
- 7.1. Market Analysis, Insights and Forecast - by Equipment Type
- 7.1.1. Front-end Equipment
- 7.1.1.1. Lithography Equipment
- 7.1.1.2. Etch Equipment
- 7.1.1.3. Deposition Equipment
- 7.1.1.4. Metrology/Inspection Equipment
- 7.1.1.5. Material Removal/Cleaning Equipment
- 7.1.1.6. Photoresist Processing Equipment
- 7.1.1.7. Other Equipment Types
- 7.1.2. Back-end Equipment
- 7.1.2.1. Test Equipment
- 7.1.2.2. Assembly and Packaging Equipment
- 7.1.1. Front-end Equipment
- 7.2. Market Analysis, Insights and Forecast - by End-User Industry
- 7.2.1. consumer electronics
- 7.2.2. automotive
- 7.2.3. other industries
- 7.2.4. industrial
- 7.1. Market Analysis, Insights and Forecast - by Equipment Type
- 8. Europe: Germany: France: Italy: United Kingdom Netherlands Rest of Europe Asia Pacific: China, Japan, India, South Korea, Taiwan, Australia, Rest of Asia-Pacific Semiconductor Equipment Market Analysis, Insights and Forecast, 2019-2031
- 8.1. Market Analysis, Insights and Forecast - by Equipment Type
- 8.1.1. Front-end Equipment
- 8.1.1.1. Lithography Equipment
- 8.1.1.2. Etch Equipment
- 8.1.1.3. Deposition Equipment
- 8.1.1.4. Metrology/Inspection Equipment
- 8.1.1.5. Material Removal/Cleaning Equipment
- 8.1.1.6. Photoresist Processing Equipment
- 8.1.1.7. Other Equipment Types
- 8.1.2. Back-end Equipment
- 8.1.2.1. Test Equipment
- 8.1.2.2. Assembly and Packaging Equipment
- 8.1.1. Front-end Equipment
- 8.2. Market Analysis, Insights and Forecast - by End-User Industry
- 8.2.1. consumer electronics
- 8.2.2. automotive
- 8.2.3. other industries
- 8.2.4. industrial
- 8.1. Market Analysis, Insights and Forecast - by Equipment Type
- 9. South America : Brazil, Argentina, Rest of South America Semiconductor Equipment Market Analysis, Insights and Forecast, 2019-2031
- 9.1. Market Analysis, Insights and Forecast - by Equipment Type
- 9.1.1. Front-end Equipment
- 9.1.1.1. Lithography Equipment
- 9.1.1.2. Etch Equipment
- 9.1.1.3. Deposition Equipment
- 9.1.1.4. Metrology/Inspection Equipment
- 9.1.1.5. Material Removal/Cleaning Equipment
- 9.1.1.6. Photoresist Processing Equipment
- 9.1.1.7. Other Equipment Types
- 9.1.2. Back-end Equipment
- 9.1.2.1. Test Equipment
- 9.1.2.2. Assembly and Packaging Equipment
- 9.1.1. Front-end Equipment
- 9.2. Market Analysis, Insights and Forecast - by End-User Industry
- 9.2.1. consumer electronics
- 9.2.2. automotive
- 9.2.3. other industries
- 9.2.4. industrial
- 9.1. Market Analysis, Insights and Forecast - by Equipment Type
- 10. MEA: Middle East, Africa Semiconductor Equipment Market Analysis, Insights and Forecast, 2019-2031
- 10.1. Market Analysis, Insights and Forecast - by Equipment Type
- 10.1.1. Front-end Equipment
- 10.1.1.1. Lithography Equipment
- 10.1.1.2. Etch Equipment
- 10.1.1.3. Deposition Equipment
- 10.1.1.4. Metrology/Inspection Equipment
- 10.1.1.5. Material Removal/Cleaning Equipment
- 10.1.1.6. Photoresist Processing Equipment
- 10.1.1.7. Other Equipment Types
- 10.1.2. Back-end Equipment
- 10.1.2.1. Test Equipment
- 10.1.2.2. Assembly and Packaging Equipment
- 10.1.1. Front-end Equipment
- 10.2. Market Analysis, Insights and Forecast - by End-User Industry
- 10.2.1. consumer electronics
- 10.2.2. automotive
- 10.2.3. other industries
- 10.2.4. industrial
- 10.1. Market Analysis, Insights and Forecast - by Equipment Type
- 11. North America Semiconductor Equipment Market Analysis, Insights and Forecast, 2019-2031
- 11.1. Market Analysis, Insights and Forecast - By Country/Sub-region
- 11.1.1 United States
- 11.1.2 Canada
- 11.1.3 Mexico
- 12. Europe Semiconductor Equipment Market Analysis, Insights and Forecast, 2019-2031
- 12.1. Market Analysis, Insights and Forecast - By Country/Sub-region
- 12.1.1 Germany
- 12.1.2 United Kingdom
- 12.1.3 France
- 12.1.4 Spain
- 12.1.5 Italy
- 12.1.6 Spain
- 12.1.7 Belgium
- 12.1.8 Netherland
- 12.1.9 Nordics
- 12.1.10 Rest of Europe
- 13. Asia Pacific Semiconductor Equipment Market Analysis, Insights and Forecast, 2019-2031
- 13.1. Market Analysis, Insights and Forecast - By Country/Sub-region
- 13.1.1 China
- 13.1.2 Japan
- 13.1.3 India
- 13.1.4 South Korea
- 13.1.5 Southeast Asia
- 13.1.6 Australia
- 13.1.7 Indonesia
- 13.1.8 Phillipes
- 13.1.9 Singapore
- 13.1.10 Thailandc
- 13.1.11 Rest of Asia Pacific
- 14. South America Semiconductor Equipment Market Analysis, Insights and Forecast, 2019-2031
- 14.1. Market Analysis, Insights and Forecast - By Country/Sub-region
- 14.1.1 Brazil
- 14.1.2 Argentina
- 14.1.3 Peru
- 14.1.4 Chile
- 14.1.5 Colombia
- 14.1.6 Ecuador
- 14.1.7 Venezuela
- 14.1.8 Rest of South America
- 15. North America Semiconductor Equipment Market Analysis, Insights and Forecast, 2019-2031
- 15.1. Market Analysis, Insights and Forecast - By Country/Sub-region
- 15.1.1 United States
- 15.1.2 Canada
- 15.1.3 Mexico
- 16. MEA Semiconductor Equipment Market Analysis, Insights and Forecast, 2019-2031
- 16.1. Market Analysis, Insights and Forecast - By Country/Sub-region
- 16.1.1 United Arab Emirates
- 16.1.2 Saudi Arabia
- 16.1.3 South Africa
- 16.1.4 Rest of Middle East and Africa
- 17. Competitive Analysis
- 17.1. Global Market Share Analysis 2024
- 17.2. Company Profiles
- 17.2.1 Lam Research Corporation
- 17.2.1.1. Overview
- 17.2.1.2. Products
- 17.2.1.3. SWOT Analysis
- 17.2.1.4. Recent Developments
- 17.2.1.5. Financials (Based on Availability)
- 17.2.2 Veeco Instruments Inc
- 17.2.2.1. Overview
- 17.2.2.2. Products
- 17.2.2.3. SWOT Analysis
- 17.2.2.4. Recent Developments
- 17.2.2.5. Financials (Based on Availability)
- 17.2.3 KLA Corporation
- 17.2.3.1. Overview
- 17.2.3.2. Products
- 17.2.3.3. SWOT Analysis
- 17.2.3.4. Recent Developments
- 17.2.3.5. Financials (Based on Availability)
- 17.2.4 Teradyne Inc
- 17.2.4.1. Overview
- 17.2.4.2. Products
- 17.2.4.3. SWOT Analysis
- 17.2.4.4. Recent Developments
- 17.2.4.5. Financials (Based on Availability)
- 17.2.5 Applied Materials Inc
- 17.2.5.1. Overview
- 17.2.5.2. Products
- 17.2.5.3. SWOT Analysis
- 17.2.5.4. Recent Developments
- 17.2.5.5. Financials (Based on Availability)
- 17.2.6 Screen Holdings Co Ltd
- 17.2.6.1. Overview
- 17.2.6.2. Products
- 17.2.6.3. SWOT Analysis
- 17.2.6.4. Recent Developments
- 17.2.6.5. Financials (Based on Availability)
- 17.2.7 Hitachi High -Technologies Corporation
- 17.2.7.1. Overview
- 17.2.7.2. Products
- 17.2.7.3. SWOT Analysis
- 17.2.7.4. Recent Developments
- 17.2.7.5. Financials (Based on Availability)
- 17.2.8 Tokyo Electron Limited
- 17.2.8.1. Overview
- 17.2.8.2. Products
- 17.2.8.3. SWOT Analysis
- 17.2.8.4. Recent Developments
- 17.2.8.5. Financials (Based on Availability)
- 17.2.9 ASML Holding Semiconductor Company
- 17.2.9.1. Overview
- 17.2.9.2. Products
- 17.2.9.3. SWOT Analysis
- 17.2.9.4. Recent Developments
- 17.2.9.5. Financials (Based on Availability)
- 17.2.1 Lam Research Corporation
List of Figures
- Figure 1: Global Semiconductor Equipment Market Revenue Breakdown (Million, %) by Region 2024 & 2032
- Figure 2: Global Semiconductor Equipment Market Volume Breakdown (K Unit, %) by Region 2024 & 2032
- Figure 3: North America Semiconductor Equipment Market Revenue (Million), by Country 2024 & 2032
- Figure 4: North America Semiconductor Equipment Market Volume (K Unit), by Country 2024 & 2032
- Figure 5: North America Semiconductor Equipment Market Revenue Share (%), by Country 2024 & 2032
- Figure 6: North America Semiconductor Equipment Market Volume Share (%), by Country 2024 & 2032
- Figure 7: Europe Semiconductor Equipment Market Revenue (Million), by Country 2024 & 2032
- Figure 8: Europe Semiconductor Equipment Market Volume (K Unit), by Country 2024 & 2032
- Figure 9: Europe Semiconductor Equipment Market Revenue Share (%), by Country 2024 & 2032
- Figure 10: Europe Semiconductor Equipment Market Volume Share (%), by Country 2024 & 2032
- Figure 11: Asia Pacific Semiconductor Equipment Market Revenue (Million), by Country 2024 & 2032
- Figure 12: Asia Pacific Semiconductor Equipment Market Volume (K Unit), by Country 2024 & 2032
- Figure 13: Asia Pacific Semiconductor Equipment Market Revenue Share (%), by Country 2024 & 2032
- Figure 14: Asia Pacific Semiconductor Equipment Market Volume Share (%), by Country 2024 & 2032
- Figure 15: South America Semiconductor Equipment Market Revenue (Million), by Country 2024 & 2032
- Figure 16: South America Semiconductor Equipment Market Volume (K Unit), by Country 2024 & 2032
- Figure 17: South America Semiconductor Equipment Market Revenue Share (%), by Country 2024 & 2032
- Figure 18: South America Semiconductor Equipment Market Volume Share (%), by Country 2024 & 2032
- Figure 19: North America Semiconductor Equipment Market Revenue (Million), by Country 2024 & 2032
- Figure 20: North America Semiconductor Equipment Market Volume (K Unit), by Country 2024 & 2032
- Figure 21: North America Semiconductor Equipment Market Revenue Share (%), by Country 2024 & 2032
- Figure 22: North America Semiconductor Equipment Market Volume Share (%), by Country 2024 & 2032
- Figure 23: MEA Semiconductor Equipment Market Revenue (Million), by Country 2024 & 2032
- Figure 24: MEA Semiconductor Equipment Market Volume (K Unit), by Country 2024 & 2032
- Figure 25: MEA Semiconductor Equipment Market Revenue Share (%), by Country 2024 & 2032
- Figure 26: MEA Semiconductor Equipment Market Volume Share (%), by Country 2024 & 2032
- Figure 27: North America: United States Canada Mexico Semiconductor Equipment Market Revenue (Million), by Equipment Type 2024 & 2032
- Figure 28: North America: United States Canada Mexico Semiconductor Equipment Market Volume (K Unit), by Equipment Type 2024 & 2032
- Figure 29: North America: United States Canada Mexico Semiconductor Equipment Market Revenue Share (%), by Equipment Type 2024 & 2032
- Figure 30: North America: United States Canada Mexico Semiconductor Equipment Market Volume Share (%), by Equipment Type 2024 & 2032
- Figure 31: North America: United States Canada Mexico Semiconductor Equipment Market Revenue (Million), by End-User Industry 2024 & 2032
- Figure 32: North America: United States Canada Mexico Semiconductor Equipment Market Volume (K Unit), by End-User Industry 2024 & 2032
- Figure 33: North America: United States Canada Mexico Semiconductor Equipment Market Revenue Share (%), by End-User Industry 2024 & 2032
- Figure 34: North America: United States Canada Mexico Semiconductor Equipment Market Volume Share (%), by End-User Industry 2024 & 2032
- Figure 35: North America: United States Canada Mexico Semiconductor Equipment Market Revenue (Million), by Country 2024 & 2032
- Figure 36: North America: United States Canada Mexico Semiconductor Equipment Market Volume (K Unit), by Country 2024 & 2032
- Figure 37: North America: United States Canada Mexico Semiconductor Equipment Market Revenue Share (%), by Country 2024 & 2032
- Figure 38: North America: United States Canada Mexico Semiconductor Equipment Market Volume Share (%), by Country 2024 & 2032
- Figure 39: Europe: Germany: France: Italy: United Kingdom Netherlands Rest of Europe Semiconductor Equipment Market Revenue (Million), by Equipment Type 2024 & 2032
- Figure 40: Europe: Germany: France: Italy: United Kingdom Netherlands Rest of Europe Semiconductor Equipment Market Volume (K Unit), by Equipment Type 2024 & 2032
- Figure 41: Europe: Germany: France: Italy: United Kingdom Netherlands Rest of Europe Semiconductor Equipment Market Revenue Share (%), by Equipment Type 2024 & 2032
- Figure 42: Europe: Germany: France: Italy: United Kingdom Netherlands Rest of Europe Semiconductor Equipment Market Volume Share (%), by Equipment Type 2024 & 2032
- Figure 43: Europe: Germany: France: Italy: United Kingdom Netherlands Rest of Europe Semiconductor Equipment Market Revenue (Million), by End-User Industry 2024 & 2032
- Figure 44: Europe: Germany: France: Italy: United Kingdom Netherlands Rest of Europe Semiconductor Equipment Market Volume (K Unit), by End-User Industry 2024 & 2032
- Figure 45: Europe: Germany: France: Italy: United Kingdom Netherlands Rest of Europe Semiconductor Equipment Market Revenue Share (%), by End-User Industry 2024 & 2032
- Figure 46: Europe: Germany: France: Italy: United Kingdom Netherlands Rest of Europe Semiconductor Equipment Market Volume Share (%), by End-User Industry 2024 & 2032
- Figure 47: Europe: Germany: France: Italy: United Kingdom Netherlands Rest of Europe Semiconductor Equipment Market Revenue (Million), by Country 2024 & 2032
- Figure 48: Europe: Germany: France: Italy: United Kingdom Netherlands Rest of Europe Semiconductor Equipment Market Volume (K Unit), by Country 2024 & 2032
- Figure 49: Europe: Germany: France: Italy: United Kingdom Netherlands Rest of Europe Semiconductor Equipment Market Revenue Share (%), by Country 2024 & 2032
- Figure 50: Europe: Germany: France: Italy: United Kingdom Netherlands Rest of Europe Semiconductor Equipment Market Volume Share (%), by Country 2024 & 2032
- Figure 51: Europe: Germany: France: Italy: United Kingdom Netherlands Rest of Europe Asia Pacific: China, Japan, India, South Korea, Taiwan, Australia, Rest of Asia-Pacific Semiconductor Equipment Market Revenue (Million), by Equipment Type 2024 & 2032
- Figure 52: Europe: Germany: France: Italy: United Kingdom Netherlands Rest of Europe Asia Pacific: China, Japan, India, South Korea, Taiwan, Australia, Rest of Asia-Pacific Semiconductor Equipment Market Volume (K Unit), by Equipment Type 2024 & 2032
- Figure 53: Europe: Germany: France: Italy: United Kingdom Netherlands Rest of Europe Asia Pacific: China, Japan, India, South Korea, Taiwan, Australia, Rest of Asia-Pacific Semiconductor Equipment Market Revenue Share (%), by Equipment Type 2024 & 2032
- Figure 54: Europe: Germany: France: Italy: United Kingdom Netherlands Rest of Europe Asia Pacific: China, Japan, India, South Korea, Taiwan, Australia, Rest of Asia-Pacific Semiconductor Equipment Market Volume Share (%), by Equipment Type 2024 & 2032
- Figure 55: Europe: Germany: France: Italy: United Kingdom Netherlands Rest of Europe Asia Pacific: China, Japan, India, South Korea, Taiwan, Australia, Rest of Asia-Pacific Semiconductor Equipment Market Revenue (Million), by End-User Industry 2024 & 2032
- Figure 56: Europe: Germany: France: Italy: United Kingdom Netherlands Rest of Europe Asia Pacific: China, Japan, India, South Korea, Taiwan, Australia, Rest of Asia-Pacific Semiconductor Equipment Market Volume (K Unit), by End-User Industry 2024 & 2032
- Figure 57: Europe: Germany: France: Italy: United Kingdom Netherlands Rest of Europe Asia Pacific: China, Japan, India, South Korea, Taiwan, Australia, Rest of Asia-Pacific Semiconductor Equipment Market Revenue Share (%), by End-User Industry 2024 & 2032
- Figure 58: Europe: Germany: France: Italy: United Kingdom Netherlands Rest of Europe Asia Pacific: China, Japan, India, South Korea, Taiwan, Australia, Rest of Asia-Pacific Semiconductor Equipment Market Volume Share (%), by End-User Industry 2024 & 2032
- Figure 59: Europe: Germany: France: Italy: United Kingdom Netherlands Rest of Europe Asia Pacific: China, Japan, India, South Korea, Taiwan, Australia, Rest of Asia-Pacific Semiconductor Equipment Market Revenue (Million), by Country 2024 & 2032
- Figure 60: Europe: Germany: France: Italy: United Kingdom Netherlands Rest of Europe Asia Pacific: China, Japan, India, South Korea, Taiwan, Australia, Rest of Asia-Pacific Semiconductor Equipment Market Volume (K Unit), by Country 2024 & 2032
- Figure 61: Europe: Germany: France: Italy: United Kingdom Netherlands Rest of Europe Asia Pacific: China, Japan, India, South Korea, Taiwan, Australia, Rest of Asia-Pacific Semiconductor Equipment Market Revenue Share (%), by Country 2024 & 2032
- Figure 62: Europe: Germany: France: Italy: United Kingdom Netherlands Rest of Europe Asia Pacific: China, Japan, India, South Korea, Taiwan, Australia, Rest of Asia-Pacific Semiconductor Equipment Market Volume Share (%), by Country 2024 & 2032
- Figure 63: South America : Brazil, Argentina, Rest of South America Semiconductor Equipment Market Revenue (Million), by Equipment Type 2024 & 2032
- Figure 64: South America : Brazil, Argentina, Rest of South America Semiconductor Equipment Market Volume (K Unit), by Equipment Type 2024 & 2032
- Figure 65: South America : Brazil, Argentina, Rest of South America Semiconductor Equipment Market Revenue Share (%), by Equipment Type 2024 & 2032
- Figure 66: South America : Brazil, Argentina, Rest of South America Semiconductor Equipment Market Volume Share (%), by Equipment Type 2024 & 2032
- Figure 67: South America : Brazil, Argentina, Rest of South America Semiconductor Equipment Market Revenue (Million), by End-User Industry 2024 & 2032
- Figure 68: South America : Brazil, Argentina, Rest of South America Semiconductor Equipment Market Volume (K Unit), by End-User Industry 2024 & 2032
- Figure 69: South America : Brazil, Argentina, Rest of South America Semiconductor Equipment Market Revenue Share (%), by End-User Industry 2024 & 2032
- Figure 70: South America : Brazil, Argentina, Rest of South America Semiconductor Equipment Market Volume Share (%), by End-User Industry 2024 & 2032
- Figure 71: South America : Brazil, Argentina, Rest of South America Semiconductor Equipment Market Revenue (Million), by Country 2024 & 2032
- Figure 72: South America : Brazil, Argentina, Rest of South America Semiconductor Equipment Market Volume (K Unit), by Country 2024 & 2032
- Figure 73: South America : Brazil, Argentina, Rest of South America Semiconductor Equipment Market Revenue Share (%), by Country 2024 & 2032
- Figure 74: South America : Brazil, Argentina, Rest of South America Semiconductor Equipment Market Volume Share (%), by Country 2024 & 2032
- Figure 75: MEA: Middle East, Africa Semiconductor Equipment Market Revenue (Million), by Equipment Type 2024 & 2032
- Figure 76: MEA: Middle East, Africa Semiconductor Equipment Market Volume (K Unit), by Equipment Type 2024 & 2032
- Figure 77: MEA: Middle East, Africa Semiconductor Equipment Market Revenue Share (%), by Equipment Type 2024 & 2032
- Figure 78: MEA: Middle East, Africa Semiconductor Equipment Market Volume Share (%), by Equipment Type 2024 & 2032
- Figure 79: MEA: Middle East, Africa Semiconductor Equipment Market Revenue (Million), by End-User Industry 2024 & 2032
- Figure 80: MEA: Middle East, Africa Semiconductor Equipment Market Volume (K Unit), by End-User Industry 2024 & 2032
- Figure 81: MEA: Middle East, Africa Semiconductor Equipment Market Revenue Share (%), by End-User Industry 2024 & 2032
- Figure 82: MEA: Middle East, Africa Semiconductor Equipment Market Volume Share (%), by End-User Industry 2024 & 2032
- Figure 83: MEA: Middle East, Africa Semiconductor Equipment Market Revenue (Million), by Country 2024 & 2032
- Figure 84: MEA: Middle East, Africa Semiconductor Equipment Market Volume (K Unit), by Country 2024 & 2032
- Figure 85: MEA: Middle East, Africa Semiconductor Equipment Market Revenue Share (%), by Country 2024 & 2032
- Figure 86: MEA: Middle East, Africa Semiconductor Equipment Market Volume Share (%), by Country 2024 & 2032
List of Tables
- Table 1: Global Semiconductor Equipment Market Revenue Million Forecast, by Region 2019 & 2032
- Table 2: Global Semiconductor Equipment Market Volume K Unit Forecast, by Region 2019 & 2032
- Table 3: Global Semiconductor Equipment Market Revenue Million Forecast, by Equipment Type 2019 & 2032
- Table 4: Global Semiconductor Equipment Market Volume K Unit Forecast, by Equipment Type 2019 & 2032
- Table 5: Global Semiconductor Equipment Market Revenue Million Forecast, by End-User Industry 2019 & 2032
- Table 6: Global Semiconductor Equipment Market Volume K Unit Forecast, by End-User Industry 2019 & 2032
- Table 7: Global Semiconductor Equipment Market Revenue Million Forecast, by Region 2019 & 2032
- Table 8: Global Semiconductor Equipment Market Volume K Unit Forecast, by Region 2019 & 2032
- Table 9: Global Semiconductor Equipment Market Revenue Million Forecast, by Country 2019 & 2032
- Table 10: Global Semiconductor Equipment Market Volume K Unit Forecast, by Country 2019 & 2032
- Table 11: United States Semiconductor Equipment Market Revenue (Million) Forecast, by Application 2019 & 2032
- Table 12: United States Semiconductor Equipment Market Volume (K Unit) Forecast, by Application 2019 & 2032
- Table 13: Canada Semiconductor Equipment Market Revenue (Million) Forecast, by Application 2019 & 2032
- Table 14: Canada Semiconductor Equipment Market Volume (K Unit) Forecast, by Application 2019 & 2032
- Table 15: Mexico Semiconductor Equipment Market Revenue (Million) Forecast, by Application 2019 & 2032
- Table 16: Mexico Semiconductor Equipment Market Volume (K Unit) Forecast, by Application 2019 & 2032
- Table 17: Global Semiconductor Equipment Market Revenue Million Forecast, by Country 2019 & 2032
- Table 18: Global Semiconductor Equipment Market Volume K Unit Forecast, by Country 2019 & 2032
- Table 19: Germany Semiconductor Equipment Market Revenue (Million) Forecast, by Application 2019 & 2032
- Table 20: Germany Semiconductor Equipment Market Volume (K Unit) Forecast, by Application 2019 & 2032
- Table 21: United Kingdom Semiconductor Equipment Market Revenue (Million) Forecast, by Application 2019 & 2032
- Table 22: United Kingdom Semiconductor Equipment Market Volume (K Unit) Forecast, by Application 2019 & 2032
- Table 23: France Semiconductor Equipment Market Revenue (Million) Forecast, by Application 2019 & 2032
- Table 24: France Semiconductor Equipment Market Volume (K Unit) Forecast, by Application 2019 & 2032
- Table 25: Spain Semiconductor Equipment Market Revenue (Million) Forecast, by Application 2019 & 2032
- Table 26: Spain Semiconductor Equipment Market Volume (K Unit) Forecast, by Application 2019 & 2032
- Table 27: Italy Semiconductor Equipment Market Revenue (Million) Forecast, by Application 2019 & 2032
- Table 28: Italy Semiconductor Equipment Market Volume (K Unit) Forecast, by Application 2019 & 2032
- Table 29: Spain Semiconductor Equipment Market Revenue (Million) Forecast, by Application 2019 & 2032
- Table 30: Spain Semiconductor Equipment Market Volume (K Unit) Forecast, by Application 2019 & 2032
- Table 31: Belgium Semiconductor Equipment Market Revenue (Million) Forecast, by Application 2019 & 2032
- Table 32: Belgium Semiconductor Equipment Market Volume (K Unit) Forecast, by Application 2019 & 2032
- Table 33: Netherland Semiconductor Equipment Market Revenue (Million) Forecast, by Application 2019 & 2032
- Table 34: Netherland Semiconductor Equipment Market Volume (K Unit) Forecast, by Application 2019 & 2032
- Table 35: Nordics Semiconductor Equipment Market Revenue (Million) Forecast, by Application 2019 & 2032
- Table 36: Nordics Semiconductor Equipment Market Volume (K Unit) Forecast, by Application 2019 & 2032
- Table 37: Rest of Europe Semiconductor Equipment Market Revenue (Million) Forecast, by Application 2019 & 2032
- Table 38: Rest of Europe Semiconductor Equipment Market Volume (K Unit) Forecast, by Application 2019 & 2032
- Table 39: Global Semiconductor Equipment Market Revenue Million Forecast, by Country 2019 & 2032
- Table 40: Global Semiconductor Equipment Market Volume K Unit Forecast, by Country 2019 & 2032
- Table 41: China Semiconductor Equipment Market Revenue (Million) Forecast, by Application 2019 & 2032
- Table 42: China Semiconductor Equipment Market Volume (K Unit) Forecast, by Application 2019 & 2032
- Table 43: Japan Semiconductor Equipment Market Revenue (Million) Forecast, by Application 2019 & 2032
- Table 44: Japan Semiconductor Equipment Market Volume (K Unit) Forecast, by Application 2019 & 2032
- Table 45: India Semiconductor Equipment Market Revenue (Million) Forecast, by Application 2019 & 2032
- Table 46: India Semiconductor Equipment Market Volume (K Unit) Forecast, by Application 2019 & 2032
- Table 47: South Korea Semiconductor Equipment Market Revenue (Million) Forecast, by Application 2019 & 2032
- Table 48: South Korea Semiconductor Equipment Market Volume (K Unit) Forecast, by Application 2019 & 2032
- Table 49: Southeast Asia Semiconductor Equipment Market Revenue (Million) Forecast, by Application 2019 & 2032
- Table 50: Southeast Asia Semiconductor Equipment Market Volume (K Unit) Forecast, by Application 2019 & 2032
- Table 51: Australia Semiconductor Equipment Market Revenue (Million) Forecast, by Application 2019 & 2032
- Table 52: Australia Semiconductor Equipment Market Volume (K Unit) Forecast, by Application 2019 & 2032
- Table 53: Indonesia Semiconductor Equipment Market Revenue (Million) Forecast, by Application 2019 & 2032
- Table 54: Indonesia Semiconductor Equipment Market Volume (K Unit) Forecast, by Application 2019 & 2032
- Table 55: Phillipes Semiconductor Equipment Market Revenue (Million) Forecast, by Application 2019 & 2032
- Table 56: Phillipes Semiconductor Equipment Market Volume (K Unit) Forecast, by Application 2019 & 2032
- Table 57: Singapore Semiconductor Equipment Market Revenue (Million) Forecast, by Application 2019 & 2032
- Table 58: Singapore Semiconductor Equipment Market Volume (K Unit) Forecast, by Application 2019 & 2032
- Table 59: Thailandc Semiconductor Equipment Market Revenue (Million) Forecast, by Application 2019 & 2032
- Table 60: Thailandc Semiconductor Equipment Market Volume (K Unit) Forecast, by Application 2019 & 2032
- Table 61: Rest of Asia Pacific Semiconductor Equipment Market Revenue (Million) Forecast, by Application 2019 & 2032
- Table 62: Rest of Asia Pacific Semiconductor Equipment Market Volume (K Unit) Forecast, by Application 2019 & 2032
- Table 63: Global Semiconductor Equipment Market Revenue Million Forecast, by Country 2019 & 2032
- Table 64: Global Semiconductor Equipment Market Volume K Unit Forecast, by Country 2019 & 2032
- Table 65: Brazil Semiconductor Equipment Market Revenue (Million) Forecast, by Application 2019 & 2032
- Table 66: Brazil Semiconductor Equipment Market Volume (K Unit) Forecast, by Application 2019 & 2032
- Table 67: Argentina Semiconductor Equipment Market Revenue (Million) Forecast, by Application 2019 & 2032
- Table 68: Argentina Semiconductor Equipment Market Volume (K Unit) Forecast, by Application 2019 & 2032
- Table 69: Peru Semiconductor Equipment Market Revenue (Million) Forecast, by Application 2019 & 2032
- Table 70: Peru Semiconductor Equipment Market Volume (K Unit) Forecast, by Application 2019 & 2032
- Table 71: Chile Semiconductor Equipment Market Revenue (Million) Forecast, by Application 2019 & 2032
- Table 72: Chile Semiconductor Equipment Market Volume (K Unit) Forecast, by Application 2019 & 2032
- Table 73: Colombia Semiconductor Equipment Market Revenue (Million) Forecast, by Application 2019 & 2032
- Table 74: Colombia Semiconductor Equipment Market Volume (K Unit) Forecast, by Application 2019 & 2032
- Table 75: Ecuador Semiconductor Equipment Market Revenue (Million) Forecast, by Application 2019 & 2032
- Table 76: Ecuador Semiconductor Equipment Market Volume (K Unit) Forecast, by Application 2019 & 2032
- Table 77: Venezuela Semiconductor Equipment Market Revenue (Million) Forecast, by Application 2019 & 2032
- Table 78: Venezuela Semiconductor Equipment Market Volume (K Unit) Forecast, by Application 2019 & 2032
- Table 79: Rest of South America Semiconductor Equipment Market Revenue (Million) Forecast, by Application 2019 & 2032
- Table 80: Rest of South America Semiconductor Equipment Market Volume (K Unit) Forecast, by Application 2019 & 2032
- Table 81: Global Semiconductor Equipment Market Revenue Million Forecast, by Country 2019 & 2032
- Table 82: Global Semiconductor Equipment Market Volume K Unit Forecast, by Country 2019 & 2032
- Table 83: United States Semiconductor Equipment Market Revenue (Million) Forecast, by Application 2019 & 2032
- Table 84: United States Semiconductor Equipment Market Volume (K Unit) Forecast, by Application 2019 & 2032
- Table 85: Canada Semiconductor Equipment Market Revenue (Million) Forecast, by Application 2019 & 2032
- Table 86: Canada Semiconductor Equipment Market Volume (K Unit) Forecast, by Application 2019 & 2032
- Table 87: Mexico Semiconductor Equipment Market Revenue (Million) Forecast, by Application 2019 & 2032
- Table 88: Mexico Semiconductor Equipment Market Volume (K Unit) Forecast, by Application 2019 & 2032
- Table 89: Global Semiconductor Equipment Market Revenue Million Forecast, by Country 2019 & 2032
- Table 90: Global Semiconductor Equipment Market Volume K Unit Forecast, by Country 2019 & 2032
- Table 91: United Arab Emirates Semiconductor Equipment Market Revenue (Million) Forecast, by Application 2019 & 2032
- Table 92: United Arab Emirates Semiconductor Equipment Market Volume (K Unit) Forecast, by Application 2019 & 2032
- Table 93: Saudi Arabia Semiconductor Equipment Market Revenue (Million) Forecast, by Application 2019 & 2032
- Table 94: Saudi Arabia Semiconductor Equipment Market Volume (K Unit) Forecast, by Application 2019 & 2032
- Table 95: South Africa Semiconductor Equipment Market Revenue (Million) Forecast, by Application 2019 & 2032
- Table 96: South Africa Semiconductor Equipment Market Volume (K Unit) Forecast, by Application 2019 & 2032
- Table 97: Rest of Middle East and Africa Semiconductor Equipment Market Revenue (Million) Forecast, by Application 2019 & 2032
- Table 98: Rest of Middle East and Africa Semiconductor Equipment Market Volume (K Unit) Forecast, by Application 2019 & 2032
- Table 99: Global Semiconductor Equipment Market Revenue Million Forecast, by Equipment Type 2019 & 2032
- Table 100: Global Semiconductor Equipment Market Volume K Unit Forecast, by Equipment Type 2019 & 2032
- Table 101: Global Semiconductor Equipment Market Revenue Million Forecast, by End-User Industry 2019 & 2032
- Table 102: Global Semiconductor Equipment Market Volume K Unit Forecast, by End-User Industry 2019 & 2032
- Table 103: Global Semiconductor Equipment Market Revenue Million Forecast, by Country 2019 & 2032
- Table 104: Global Semiconductor Equipment Market Volume K Unit Forecast, by Country 2019 & 2032
- Table 105: Global Semiconductor Equipment Market Revenue Million Forecast, by Equipment Type 2019 & 2032
- Table 106: Global Semiconductor Equipment Market Volume K Unit Forecast, by Equipment Type 2019 & 2032
- Table 107: Global Semiconductor Equipment Market Revenue Million Forecast, by End-User Industry 2019 & 2032
- Table 108: Global Semiconductor Equipment Market Volume K Unit Forecast, by End-User Industry 2019 & 2032
- Table 109: Global Semiconductor Equipment Market Revenue Million Forecast, by Country 2019 & 2032
- Table 110: Global Semiconductor Equipment Market Volume K Unit Forecast, by Country 2019 & 2032
- Table 111: Global Semiconductor Equipment Market Revenue Million Forecast, by Equipment Type 2019 & 2032
- Table 112: Global Semiconductor Equipment Market Volume K Unit Forecast, by Equipment Type 2019 & 2032
- Table 113: Global Semiconductor Equipment Market Revenue Million Forecast, by End-User Industry 2019 & 2032
- Table 114: Global Semiconductor Equipment Market Volume K Unit Forecast, by End-User Industry 2019 & 2032
- Table 115: Global Semiconductor Equipment Market Revenue Million Forecast, by Country 2019 & 2032
- Table 116: Global Semiconductor Equipment Market Volume K Unit Forecast, by Country 2019 & 2032
- Table 117: Global Semiconductor Equipment Market Revenue Million Forecast, by Equipment Type 2019 & 2032
- Table 118: Global Semiconductor Equipment Market Volume K Unit Forecast, by Equipment Type 2019 & 2032
- Table 119: Global Semiconductor Equipment Market Revenue Million Forecast, by End-User Industry 2019 & 2032
- Table 120: Global Semiconductor Equipment Market Volume K Unit Forecast, by End-User Industry 2019 & 2032
- Table 121: Global Semiconductor Equipment Market Revenue Million Forecast, by Country 2019 & 2032
- Table 122: Global Semiconductor Equipment Market Volume K Unit Forecast, by Country 2019 & 2032
- Table 123: Global Semiconductor Equipment Market Revenue Million Forecast, by Equipment Type 2019 & 2032
- Table 124: Global Semiconductor Equipment Market Volume K Unit Forecast, by Equipment Type 2019 & 2032
- Table 125: Global Semiconductor Equipment Market Revenue Million Forecast, by End-User Industry 2019 & 2032
- Table 126: Global Semiconductor Equipment Market Volume K Unit Forecast, by End-User Industry 2019 & 2032
- Table 127: Global Semiconductor Equipment Market Revenue Million Forecast, by Country 2019 & 2032
- Table 128: Global Semiconductor Equipment Market Volume K Unit Forecast, by Country 2019 & 2032
Frequently Asked Questions
1. What is the projected Compound Annual Growth Rate (CAGR) of the Semiconductor Equipment Market?
The projected CAGR is approximately 4.07%.
2. Which companies are prominent players in the Semiconductor Equipment Market?
Key companies in the market include Lam Research Corporation, Veeco Instruments Inc, KLA Corporation, Teradyne Inc, Applied Materials Inc, Screen Holdings Co Ltd, Hitachi High -Technologies Corporation, Tokyo Electron Limited, ASML Holding Semiconductor Company.
3. What are the main segments of the Semiconductor Equipment Market?
The market segments include Equipment Type, End-User Industry .
4. Can you provide details about the market size?
The market size is estimated to be USD 127.87 Million as of 2022.
5. What are some drivers contributing to market growth?
Increasing Demand for Consumer Electronic Devices; Proliferation of AI. IoT. And Connected Devices Across Industry Verticals.
6. What are the notable trends driving market growth?
Increasing Demand for Consumer Electronic Devices.
7. Are there any restraints impacting market growth?
Dynamic Nature of Technologies Requires Several Changes in Manufacturing Equipment.
8. Can you provide examples of recent developments in the market?
June 2022: RIBER, a global market player for molecular beam epitaxy (MBE) equipment serving the semiconductor industry, announced an order for a multi-4' GSMBE 49 production system. The new generation of datacom devices requires highly precise control of the epitaxial growth process, which is achieved by the recognized performance of Riber's machines and by the sophistication of the machine's control software. The ordered machine is expected to be delivered in 2023.
9. What pricing options are available for accessing the report?
Pricing options include single-user, multi-user, and enterprise licenses priced at USD 4750, USD 5250, and USD 8750 respectively.
10. Is the market size provided in terms of value or volume?
The market size is provided in terms of value, measured in Million and volume, measured in K Unit.
11. Are there any specific market keywords associated with the report?
Yes, the market keyword associated with the report is "Semiconductor Equipment Market," which aids in identifying and referencing the specific market segment covered.
12. How do I determine which pricing option suits my needs best?
The pricing options vary based on user requirements and access needs. Individual users may opt for single-user licenses, while businesses requiring broader access may choose multi-user or enterprise licenses for cost-effective access to the report.
13. Are there any additional resources or data provided in the Semiconductor Equipment Market report?
While the report offers comprehensive insights, it's advisable to review the specific contents or supplementary materials provided to ascertain if additional resources or data are available.
14. How can I stay updated on further developments or reports in the Semiconductor Equipment Market?
To stay informed about further developments, trends, and reports in the Semiconductor Equipment Market, consider subscribing to industry newsletters, following relevant companies and organizations, or regularly checking reputable industry news sources and publications.
Methodology
Step 1 - Identification of Relevant Samples Size from Population Database


Step 2 - Approaches for Defining Global Market Size (Value, Volume* & Price*)

Note*: In applicable scenarios
Step 3 - Data Sources
Primary Research
- Web Analytics
- Survey Reports
- Research Institute
- Latest Research Reports
- Opinion Leaders
Secondary Research
- Annual Reports
- White Paper
- Latest Press Release
- Industry Association
- Paid Database
- Investor Presentations

Step 4 - Data Triangulation
Involves using different sources of information in order to increase the validity of a study
These sources are likely to be stakeholders in a program - participants, other researchers, program staff, other community members, and so on.
Then we put all data in single framework & apply various statistical tools to find out the dynamic on the market.
During the analysis stage, feedback from the stakeholder groups would be compared to determine areas of agreement as well as areas of divergence


