
Key Insights
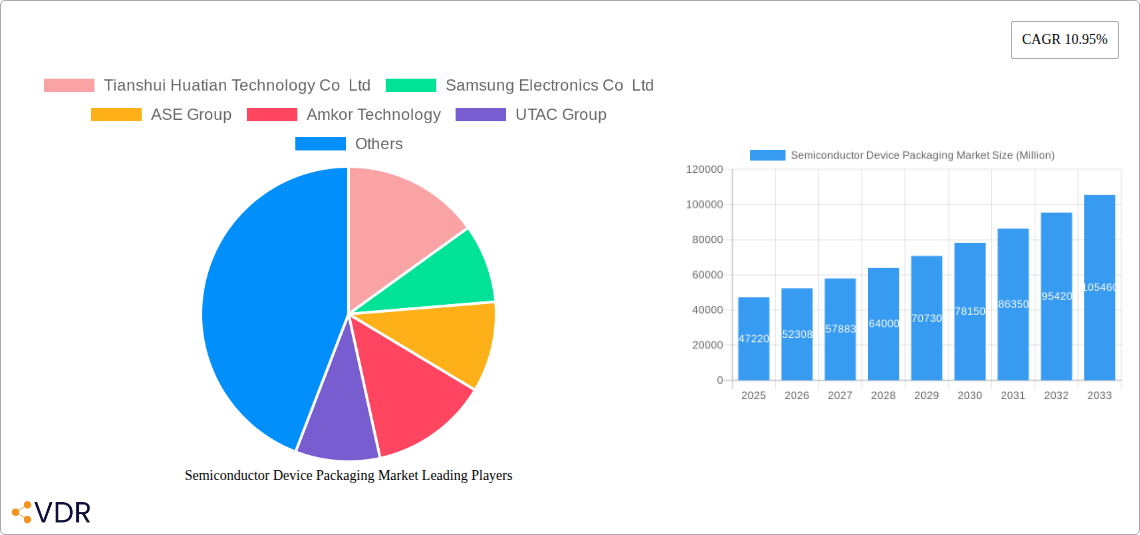
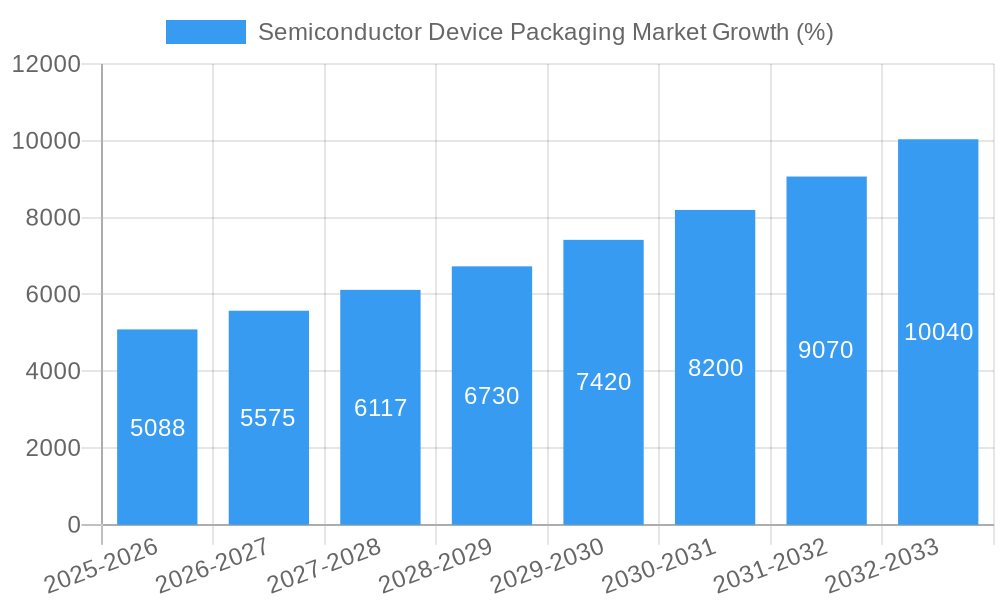
The semiconductor device packaging market, valued at $47.22 billion in 2025, is projected to experience robust growth, driven by the increasing demand for miniaturized and high-performance electronics across diverse sectors. A compound annual growth rate (CAGR) of 10.95% from 2025 to 2033 indicates a significant expansion, reaching an estimated market size of approximately $120 billion by 2033. This growth is fueled by several key factors. The proliferation of smartphones, wearables, and other consumer electronics necessitates advanced packaging solutions capable of integrating more functionality within smaller form factors. Furthermore, the automotive industry's shift towards electric vehicles (EVs) and advanced driver-assistance systems (ADAS) significantly boosts demand for high-reliability and power-efficient packaging technologies. The medical device sector, with its increasing adoption of sophisticated implantable devices and diagnostic tools, also contributes to market expansion. Fan-out wafer level packaging (FO-WLP), a leading segment, benefits from its ability to achieve higher density and improved performance.
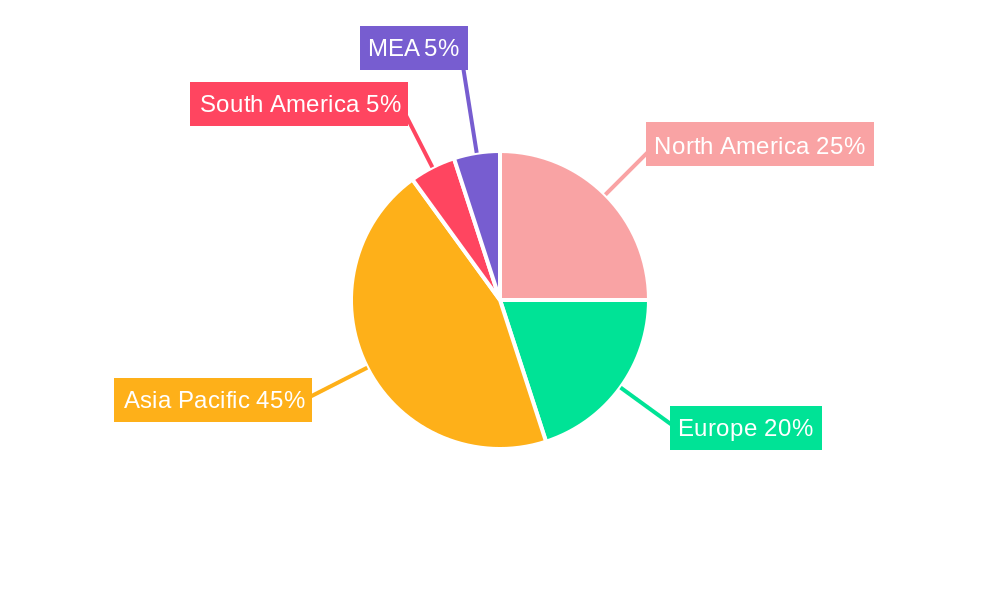
The market's segmentation reveals further insights. Advanced packaging solutions, encompassing FO-WLP and other cutting-edge technologies, command a substantial market share and are expected to witness faster growth compared to traditional packaging methods. Geographically, Asia Pacific, particularly China, Japan, and South Korea, is anticipated to dominate the market due to the concentration of semiconductor manufacturing and electronics assembly. North America and Europe are expected to witness steady growth driven by innovation and adoption in various end-use sectors. However, challenges such as supply chain constraints, geopolitical factors, and the increasing complexity of packaging processes pose potential restraints on the overall market growth. Nevertheless, continuous technological advancements and collaborations among key players like Samsung Electronics, ASE Group, Amkor Technology, and others, are poised to drive further innovation and market expansion.
This in-depth report provides a comprehensive analysis of the Semiconductor Device Packaging Market, encompassing market dynamics, growth trends, regional dominance, product landscape, key players, and future outlook. The study period covers 2019-2033, with 2025 as the base and estimated year. The report segments the market by packaging type (Fan-out Wafer Level Packaging (FO-WLP): Traditional Packaging, Advanced Packaging), end-user industry (Consumer Electronics, Aerospace and Defense, Medical Devices, Communications and Telecom, Automotive Industry, Energy and Lighting), and geographic regions. This detailed analysis is crucial for industry professionals, investors, and strategic decision-makers seeking to understand and capitalize on the growth opportunities within this rapidly evolving market. The market size is projected to reach xx Million units by 2033.
Semiconductor Device Packaging Market Market Dynamics & Structure
The Semiconductor Device Packaging market is characterized by a moderately concentrated landscape with a few major players holding significant market share. Technological innovation, particularly in advanced packaging technologies like FO-WLP, is a key driver. Stringent regulatory frameworks related to material safety and performance standards also shape the market. The market faces competition from alternative interconnect technologies, and the emergence of new materials is constantly reshaping the competitive dynamics. The end-user demographics are diverse, with significant demand from consumer electronics, automotive, and communications sectors. M&A activity has been relatively frequent, with larger players acquiring smaller companies to expand their product portfolios and technological capabilities.
- Market Concentration: Top 5 players hold approximately xx% of the market share (2025).
- Technological Innovation: Focus on miniaturization, higher performance, and improved power efficiency.
- Regulatory Landscape: Compliance with RoHS, REACH, and other environmental regulations is crucial.
- Competitive Substitutes: Emerging interconnect technologies present competitive pressures.
- M&A Activity: Average of xx M&A deals per year observed during 2019-2024.
- Innovation Barriers: High R&D costs and complexities in process integration pose significant challenges.
Semiconductor Device Packaging Market Growth Trends & Insights
The Semiconductor Device Packaging market has experienced significant growth over the past few years, driven by the increasing demand for miniaturized and high-performance electronic devices across various sectors. The market is projected to exhibit a CAGR of xx% during the forecast period (2025-2033). This growth is fueled by the adoption of advanced packaging technologies, including 3D stacking and system-in-package (SiP) solutions, which enable greater functionality and improved performance in smaller form factors. The increasing adoption of 5G technology and the growth of the Internet of Things (IoT) are further contributing to market expansion. Consumer electronics remain the dominant end-user segment, followed by the automotive industry. Technological disruptions, such as the development of new materials and packaging processes, are constantly reshaping the market landscape. Changes in consumer behavior, such as increased demand for portable and connected devices, further drive market growth. Market penetration of advanced packaging is expected to reach xx% by 2033.
Dominant Regions, Countries, or Segments in Semiconductor Device Packaging Market
Asia-Pacific, particularly countries like China, South Korea, and Taiwan, dominate the Semiconductor Device Packaging market due to the presence of major semiconductor manufacturers and a robust electronics manufacturing ecosystem. Strong government support for the semiconductor industry, coupled with a large and growing consumer electronics market, fuels this dominance. The consumer electronics segment holds the largest market share, driven by the high demand for smartphones, wearables, and other consumer devices. Within packaging platforms, Advanced Packaging is experiencing faster growth compared to Traditional Packaging, owing to its ability to improve performance and miniaturization capabilities.
- Key Drivers: Strong government support for semiconductor industry growth, high consumer electronics demand, established manufacturing infrastructure, abundant skilled labor.
- Dominance Factors: High manufacturing capacity, presence of major players, cost-effective production.
- Growth Potential: Continued growth in consumer electronics, expansion of the automotive sector, advancements in advanced packaging technologies.
Semiconductor Device Packaging Market Product Landscape
The Semiconductor Device Packaging market offers a diverse range of products, including wire bonding, flip-chip packaging, and advanced packaging solutions like 3D stacking and system-in-package (SiP). Continuous advancements focus on enhancing performance metrics such as power efficiency, thermal management, and signal integrity. Unique selling propositions emphasize miniaturization, improved reliability, and cost-effectiveness. Recent technological advancements include the development of new materials, such as high-bandwidth interconnects and advanced substrate materials, which enable better performance and integration.
Key Drivers, Barriers & Challenges in Semiconductor Device Packaging Market
Key Drivers: The increasing demand for smaller, faster, and more power-efficient electronic devices is a major driver. Technological advancements in packaging technologies such as 3D stacking and SiP are also crucial drivers. Government initiatives to support the semiconductor industry in various regions boost market growth.
Challenges: Supply chain disruptions, particularly in the procurement of key materials, can impact production and lead times. Stringent regulatory requirements related to environmental compliance and product safety impose significant costs and challenges. Intense competition among established players and new entrants also creates challenges. These factors can result in a xx% reduction in production output during periods of significant supply chain disruption.
Emerging Opportunities in Semiconductor Device Packaging Market
Emerging opportunities lie in the development of innovative packaging solutions for next-generation electronic devices, particularly in areas like high-performance computing, artificial intelligence, and 5G applications. The growth of the automotive and medical device industries presents significant untapped market potential for advanced packaging technologies. The increasing demand for environmentally friendly materials and manufacturing processes creates opportunities for sustainable packaging solutions.
Growth Accelerators in the Semiconductor Device Packaging Market Industry
Technological advancements in materials science and packaging processes are key catalysts for long-term growth. Strategic partnerships and collaborations between semiconductor companies and packaging providers foster innovation and accelerate product development. Expansion into new markets and applications, such as the Internet of Things (IoT) and wearable electronics, also drives growth.
Key Players Shaping the Semiconductor Device Packaging Market Market
- Tianshui Huatian Technology Co Ltd
- Samsung Electronics Co Ltd
- ASE Group
- Amkor Technology
- UTAC Group
- Unisem (M) Berhad
- Chipbond Technology Corporation
- Powertech Technology Inc
- Siliconware Precision Industries Co Ltd (SPIL)
- JCET/STATS ChipPAC
- Interconnect Systems Inc (ISI)
- Chipmos Technologies Inc
- Intel Corporation
- Fujitsu Semiconductor Ltd
Notable Milestones in Semiconductor Device Packaging Market Sector
- November 2023: JCET Group's capital increase of RMB 4.4 billion (USD 0.61 billion) to expand automotive chip packaging capacity.
- September 2023: Intel Corporation launches a glass substrate for next-generation advanced packaging, advancing Moore's Law.
In-Depth Semiconductor Device Packaging Market Market Outlook
The Semiconductor Device Packaging market is poised for continued strong growth, driven by technological advancements, increasing demand from diverse end-user industries, and strategic investments by key players. The market's future potential is significant, particularly in emerging applications such as artificial intelligence, high-performance computing, and the Internet of Things. Strategic opportunities exist for companies that can develop innovative packaging solutions, optimize supply chains, and adapt to evolving regulatory landscapes. The market is expected to witness further consolidation through mergers and acquisitions, as players strive to enhance their technological capabilities and expand their market reach.
Semiconductor Device Packaging Market Segmentation
-
1. Packaging Platform
- 1.1. Advanced Packaging
- 1.2. Traditional Packaging
-
2. End-user Industry
- 2.1. Consumer Electronics
- 2.2. Aerospace and Defense
- 2.3. Medical Devices
- 2.4. Communications and Telecom
- 2.5. Automotive Industry
- 2.6. Energy and Lighting
Semiconductor Device Packaging Market Segmentation By Geography
- 1. United States
- 2. China
- 3. Taiwan
- 4. South Korea
- 5. Japan
- 6. Europe
- 7. Latin America
- 8. Middle East and Africa
Semiconductor Device Packaging Market REPORT HIGHLIGHTS
| Aspects | Details |
|---|---|
| Study Period | 2019-2033 |
| Base Year | 2024 |
| Estimated Year | 2025 |
| Forecast Period | 2025-2033 |
| Historical Period | 2019-2024 |
| Growth Rate | CAGR of 10.95% from 2019-2033 |
| Segmentation |
|
Table of Contents
- 1. Introduction
- 1.1. Research Scope
- 1.2. Market Segmentation
- 1.3. Research Methodology
- 1.4. Definitions and Assumptions
- 2. Executive Summary
- 2.1. Introduction
- 3. Market Dynamics
- 3.1. Introduction
- 3.2. Market Drivers
- 3.2.1. Growing Consumption of Semiconductor Devices Across Industries; Favorable Government Policies and Regulations in Developing Countries
- 3.3. Market Restrains
- 3.3.1. High Initial Investment and Increasing Complexity of Semiconductor IC Designs
- 3.4. Market Trends
- 3.4.1. Ultra High-density Fan-Out Advanced Packaging Segment to Hold Significant Market Share
- 4. Market Factor Analysis
- 4.1. Porters Five Forces
- 4.2. Supply/Value Chain
- 4.3. PESTEL analysis
- 4.4. Market Entropy
- 4.5. Patent/Trademark Analysis
- 5. Global Semiconductor Device Packaging Market Analysis, Insights and Forecast, 2019-2031
- 5.1. Market Analysis, Insights and Forecast - by Packaging Platform
- 5.1.1. Advanced Packaging
- 5.1.2. Traditional Packaging
- 5.2. Market Analysis, Insights and Forecast - by End-user Industry
- 5.2.1. Consumer Electronics
- 5.2.2. Aerospace and Defense
- 5.2.3. Medical Devices
- 5.2.4. Communications and Telecom
- 5.2.5. Automotive Industry
- 5.2.6. Energy and Lighting
- 5.3. Market Analysis, Insights and Forecast - by Region
- 5.3.1. United States
- 5.3.2. China
- 5.3.3. Taiwan
- 5.3.4. South Korea
- 5.3.5. Japan
- 5.3.6. Europe
- 5.3.7. Latin America
- 5.3.8. Middle East and Africa
- 5.1. Market Analysis, Insights and Forecast - by Packaging Platform
- 6. United States Semiconductor Device Packaging Market Analysis, Insights and Forecast, 2019-2031
- 6.1. Market Analysis, Insights and Forecast - by Packaging Platform
- 6.1.1. Advanced Packaging
- 6.1.2. Traditional Packaging
- 6.2. Market Analysis, Insights and Forecast - by End-user Industry
- 6.2.1. Consumer Electronics
- 6.2.2. Aerospace and Defense
- 6.2.3. Medical Devices
- 6.2.4. Communications and Telecom
- 6.2.5. Automotive Industry
- 6.2.6. Energy and Lighting
- 6.1. Market Analysis, Insights and Forecast - by Packaging Platform
- 7. China Semiconductor Device Packaging Market Analysis, Insights and Forecast, 2019-2031
- 7.1. Market Analysis, Insights and Forecast - by Packaging Platform
- 7.1.1. Advanced Packaging
- 7.1.2. Traditional Packaging
- 7.2. Market Analysis, Insights and Forecast - by End-user Industry
- 7.2.1. Consumer Electronics
- 7.2.2. Aerospace and Defense
- 7.2.3. Medical Devices
- 7.2.4. Communications and Telecom
- 7.2.5. Automotive Industry
- 7.2.6. Energy and Lighting
- 7.1. Market Analysis, Insights and Forecast - by Packaging Platform
- 8. Taiwan Semiconductor Device Packaging Market Analysis, Insights and Forecast, 2019-2031
- 8.1. Market Analysis, Insights and Forecast - by Packaging Platform
- 8.1.1. Advanced Packaging
- 8.1.2. Traditional Packaging
- 8.2. Market Analysis, Insights and Forecast - by End-user Industry
- 8.2.1. Consumer Electronics
- 8.2.2. Aerospace and Defense
- 8.2.3. Medical Devices
- 8.2.4. Communications and Telecom
- 8.2.5. Automotive Industry
- 8.2.6. Energy and Lighting
- 8.1. Market Analysis, Insights and Forecast - by Packaging Platform
- 9. South Korea Semiconductor Device Packaging Market Analysis, Insights and Forecast, 2019-2031
- 9.1. Market Analysis, Insights and Forecast - by Packaging Platform
- 9.1.1. Advanced Packaging
- 9.1.2. Traditional Packaging
- 9.2. Market Analysis, Insights and Forecast - by End-user Industry
- 9.2.1. Consumer Electronics
- 9.2.2. Aerospace and Defense
- 9.2.3. Medical Devices
- 9.2.4. Communications and Telecom
- 9.2.5. Automotive Industry
- 9.2.6. Energy and Lighting
- 9.1. Market Analysis, Insights and Forecast - by Packaging Platform
- 10. Japan Semiconductor Device Packaging Market Analysis, Insights and Forecast, 2019-2031
- 10.1. Market Analysis, Insights and Forecast - by Packaging Platform
- 10.1.1. Advanced Packaging
- 10.1.2. Traditional Packaging
- 10.2. Market Analysis, Insights and Forecast - by End-user Industry
- 10.2.1. Consumer Electronics
- 10.2.2. Aerospace and Defense
- 10.2.3. Medical Devices
- 10.2.4. Communications and Telecom
- 10.2.5. Automotive Industry
- 10.2.6. Energy and Lighting
- 10.1. Market Analysis, Insights and Forecast - by Packaging Platform
- 11. Europe Semiconductor Device Packaging Market Analysis, Insights and Forecast, 2019-2031
- 11.1. Market Analysis, Insights and Forecast - by Packaging Platform
- 11.1.1. Advanced Packaging
- 11.1.2. Traditional Packaging
- 11.2. Market Analysis, Insights and Forecast - by End-user Industry
- 11.2.1. Consumer Electronics
- 11.2.2. Aerospace and Defense
- 11.2.3. Medical Devices
- 11.2.4. Communications and Telecom
- 11.2.5. Automotive Industry
- 11.2.6. Energy and Lighting
- 11.1. Market Analysis, Insights and Forecast - by Packaging Platform
- 12. Latin America Semiconductor Device Packaging Market Analysis, Insights and Forecast, 2019-2031
- 12.1. Market Analysis, Insights and Forecast - by Packaging Platform
- 12.1.1. Advanced Packaging
- 12.1.2. Traditional Packaging
- 12.2. Market Analysis, Insights and Forecast - by End-user Industry
- 12.2.1. Consumer Electronics
- 12.2.2. Aerospace and Defense
- 12.2.3. Medical Devices
- 12.2.4. Communications and Telecom
- 12.2.5. Automotive Industry
- 12.2.6. Energy and Lighting
- 12.1. Market Analysis, Insights and Forecast - by Packaging Platform
- 13. Middle East and Africa Semiconductor Device Packaging Market Analysis, Insights and Forecast, 2019-2031
- 13.1. Market Analysis, Insights and Forecast - by Packaging Platform
- 13.1.1. Advanced Packaging
- 13.1.2. Traditional Packaging
- 13.2. Market Analysis, Insights and Forecast - by End-user Industry
- 13.2.1. Consumer Electronics
- 13.2.2. Aerospace and Defense
- 13.2.3. Medical Devices
- 13.2.4. Communications and Telecom
- 13.2.5. Automotive Industry
- 13.2.6. Energy and Lighting
- 13.1. Market Analysis, Insights and Forecast - by Packaging Platform
- 14. North America Semiconductor Device Packaging Market Analysis, Insights and Forecast, 2019-2031
- 14.1. Market Analysis, Insights and Forecast - By Country/Sub-region
- 14.1.1 United States
- 14.1.2 Canada
- 14.1.3 Mexico
- 15. Europe Semiconductor Device Packaging Market Analysis, Insights and Forecast, 2019-2031
- 15.1. Market Analysis, Insights and Forecast - By Country/Sub-region
- 15.1.1 Germany
- 15.1.2 United Kingdom
- 15.1.3 France
- 15.1.4 Spain
- 15.1.5 Italy
- 15.1.6 Spain
- 15.1.7 Belgium
- 15.1.8 Netherland
- 15.1.9 Nordics
- 15.1.10 Rest of Europe
- 16. Asia Pacific Semiconductor Device Packaging Market Analysis, Insights and Forecast, 2019-2031
- 16.1. Market Analysis, Insights and Forecast - By Country/Sub-region
- 16.1.1 China
- 16.1.2 Japan
- 16.1.3 India
- 16.1.4 South Korea
- 16.1.5 Southeast Asia
- 16.1.6 Australia
- 16.1.7 Indonesia
- 16.1.8 Phillipes
- 16.1.9 Singapore
- 16.1.10 Thailandc
- 16.1.11 Rest of Asia Pacific
- 17. South America Semiconductor Device Packaging Market Analysis, Insights and Forecast, 2019-2031
- 17.1. Market Analysis, Insights and Forecast - By Country/Sub-region
- 17.1.1 Brazil
- 17.1.2 Argentina
- 17.1.3 Peru
- 17.1.4 Chile
- 17.1.5 Colombia
- 17.1.6 Ecuador
- 17.1.7 Venezuela
- 17.1.8 Rest of South America
- 18. North America Semiconductor Device Packaging Market Analysis, Insights and Forecast, 2019-2031
- 18.1. Market Analysis, Insights and Forecast - By Country/Sub-region
- 18.1.1 United States
- 18.1.2 Canada
- 18.1.3 Mexico
- 19. MEA Semiconductor Device Packaging Market Analysis, Insights and Forecast, 2019-2031
- 19.1. Market Analysis, Insights and Forecast - By Country/Sub-region
- 19.1.1 United Arab Emirates
- 19.1.2 Saudi Arabia
- 19.1.3 South Africa
- 19.1.4 Rest of Middle East and Africa
- 20. Competitive Analysis
- 20.1. Global Market Share Analysis 2024
- 20.2. Company Profiles
- 20.2.1 Tianshui Huatian Technology Co Ltd
- 20.2.1.1. Overview
- 20.2.1.2. Products
- 20.2.1.3. SWOT Analysis
- 20.2.1.4. Recent Developments
- 20.2.1.5. Financials (Based on Availability)
- 20.2.2 Samsung Electronics Co Ltd
- 20.2.2.1. Overview
- 20.2.2.2. Products
- 20.2.2.3. SWOT Analysis
- 20.2.2.4. Recent Developments
- 20.2.2.5. Financials (Based on Availability)
- 20.2.3 ASE Group
- 20.2.3.1. Overview
- 20.2.3.2. Products
- 20.2.3.3. SWOT Analysis
- 20.2.3.4. Recent Developments
- 20.2.3.5. Financials (Based on Availability)
- 20.2.4 Amkor Technology
- 20.2.4.1. Overview
- 20.2.4.2. Products
- 20.2.4.3. SWOT Analysis
- 20.2.4.4. Recent Developments
- 20.2.4.5. Financials (Based on Availability)
- 20.2.5 UTAC Group
- 20.2.5.1. Overview
- 20.2.5.2. Products
- 20.2.5.3. SWOT Analysis
- 20.2.5.4. Recent Developments
- 20.2.5.5. Financials (Based on Availability)
- 20.2.6 Unisem (M) Berhad
- 20.2.6.1. Overview
- 20.2.6.2. Products
- 20.2.6.3. SWOT Analysis
- 20.2.6.4. Recent Developments
- 20.2.6.5. Financials (Based on Availability)
- 20.2.7 Chipbond Technology Corporation
- 20.2.7.1. Overview
- 20.2.7.2. Products
- 20.2.7.3. SWOT Analysis
- 20.2.7.4. Recent Developments
- 20.2.7.5. Financials (Based on Availability)
- 20.2.8 Powertech Technology Inc
- 20.2.8.1. Overview
- 20.2.8.2. Products
- 20.2.8.3. SWOT Analysis
- 20.2.8.4. Recent Developments
- 20.2.8.5. Financials (Based on Availability)
- 20.2.9 Siliconware Precision Industries Co Ltd (SPIL)
- 20.2.9.1. Overview
- 20.2.9.2. Products
- 20.2.9.3. SWOT Analysis
- 20.2.9.4. Recent Developments
- 20.2.9.5. Financials (Based on Availability)
- 20.2.10 JCET/STATS ChipPAC
- 20.2.10.1. Overview
- 20.2.10.2. Products
- 20.2.10.3. SWOT Analysis
- 20.2.10.4. Recent Developments
- 20.2.10.5. Financials (Based on Availability)
- 20.2.11 Interconnect Systems Inc (ISI)
- 20.2.11.1. Overview
- 20.2.11.2. Products
- 20.2.11.3. SWOT Analysis
- 20.2.11.4. Recent Developments
- 20.2.11.5. Financials (Based on Availability)
- 20.2.12 Chipmos Technologies Inc
- 20.2.12.1. Overview
- 20.2.12.2. Products
- 20.2.12.3. SWOT Analysis
- 20.2.12.4. Recent Developments
- 20.2.12.5. Financials (Based on Availability)
- 20.2.13 Intel Corporation
- 20.2.13.1. Overview
- 20.2.13.2. Products
- 20.2.13.3. SWOT Analysis
- 20.2.13.4. Recent Developments
- 20.2.13.5. Financials (Based on Availability)
- 20.2.14 Fujitsu Semiconductor Ltd
- 20.2.14.1. Overview
- 20.2.14.2. Products
- 20.2.14.3. SWOT Analysis
- 20.2.14.4. Recent Developments
- 20.2.14.5. Financials (Based on Availability)
- 20.2.1 Tianshui Huatian Technology Co Ltd
List of Figures
- Figure 1: Global Semiconductor Device Packaging Market Revenue Breakdown (Million, %) by Region 2024 & 2032
- Figure 2: Global Semiconductor Device Packaging Market Volume Breakdown (K Unit, %) by Region 2024 & 2032
- Figure 3: North America Semiconductor Device Packaging Market Revenue (Million), by Country 2024 & 2032
- Figure 4: North America Semiconductor Device Packaging Market Volume (K Unit), by Country 2024 & 2032
- Figure 5: North America Semiconductor Device Packaging Market Revenue Share (%), by Country 2024 & 2032
- Figure 6: North America Semiconductor Device Packaging Market Volume Share (%), by Country 2024 & 2032
- Figure 7: Europe Semiconductor Device Packaging Market Revenue (Million), by Country 2024 & 2032
- Figure 8: Europe Semiconductor Device Packaging Market Volume (K Unit), by Country 2024 & 2032
- Figure 9: Europe Semiconductor Device Packaging Market Revenue Share (%), by Country 2024 & 2032
- Figure 10: Europe Semiconductor Device Packaging Market Volume Share (%), by Country 2024 & 2032
- Figure 11: Asia Pacific Semiconductor Device Packaging Market Revenue (Million), by Country 2024 & 2032
- Figure 12: Asia Pacific Semiconductor Device Packaging Market Volume (K Unit), by Country 2024 & 2032
- Figure 13: Asia Pacific Semiconductor Device Packaging Market Revenue Share (%), by Country 2024 & 2032
- Figure 14: Asia Pacific Semiconductor Device Packaging Market Volume Share (%), by Country 2024 & 2032
- Figure 15: South America Semiconductor Device Packaging Market Revenue (Million), by Country 2024 & 2032
- Figure 16: South America Semiconductor Device Packaging Market Volume (K Unit), by Country 2024 & 2032
- Figure 17: South America Semiconductor Device Packaging Market Revenue Share (%), by Country 2024 & 2032
- Figure 18: South America Semiconductor Device Packaging Market Volume Share (%), by Country 2024 & 2032
- Figure 19: North America Semiconductor Device Packaging Market Revenue (Million), by Country 2024 & 2032
- Figure 20: North America Semiconductor Device Packaging Market Volume (K Unit), by Country 2024 & 2032
- Figure 21: North America Semiconductor Device Packaging Market Revenue Share (%), by Country 2024 & 2032
- Figure 22: North America Semiconductor Device Packaging Market Volume Share (%), by Country 2024 & 2032
- Figure 23: MEA Semiconductor Device Packaging Market Revenue (Million), by Country 2024 & 2032
- Figure 24: MEA Semiconductor Device Packaging Market Volume (K Unit), by Country 2024 & 2032
- Figure 25: MEA Semiconductor Device Packaging Market Revenue Share (%), by Country 2024 & 2032
- Figure 26: MEA Semiconductor Device Packaging Market Volume Share (%), by Country 2024 & 2032
- Figure 27: United States Semiconductor Device Packaging Market Revenue (Million), by Packaging Platform 2024 & 2032
- Figure 28: United States Semiconductor Device Packaging Market Volume (K Unit), by Packaging Platform 2024 & 2032
- Figure 29: United States Semiconductor Device Packaging Market Revenue Share (%), by Packaging Platform 2024 & 2032
- Figure 30: United States Semiconductor Device Packaging Market Volume Share (%), by Packaging Platform 2024 & 2032
- Figure 31: United States Semiconductor Device Packaging Market Revenue (Million), by End-user Industry 2024 & 2032
- Figure 32: United States Semiconductor Device Packaging Market Volume (K Unit), by End-user Industry 2024 & 2032
- Figure 33: United States Semiconductor Device Packaging Market Revenue Share (%), by End-user Industry 2024 & 2032
- Figure 34: United States Semiconductor Device Packaging Market Volume Share (%), by End-user Industry 2024 & 2032
- Figure 35: United States Semiconductor Device Packaging Market Revenue (Million), by Country 2024 & 2032
- Figure 36: United States Semiconductor Device Packaging Market Volume (K Unit), by Country 2024 & 2032
- Figure 37: United States Semiconductor Device Packaging Market Revenue Share (%), by Country 2024 & 2032
- Figure 38: United States Semiconductor Device Packaging Market Volume Share (%), by Country 2024 & 2032
- Figure 39: China Semiconductor Device Packaging Market Revenue (Million), by Packaging Platform 2024 & 2032
- Figure 40: China Semiconductor Device Packaging Market Volume (K Unit), by Packaging Platform 2024 & 2032
- Figure 41: China Semiconductor Device Packaging Market Revenue Share (%), by Packaging Platform 2024 & 2032
- Figure 42: China Semiconductor Device Packaging Market Volume Share (%), by Packaging Platform 2024 & 2032
- Figure 43: China Semiconductor Device Packaging Market Revenue (Million), by End-user Industry 2024 & 2032
- Figure 44: China Semiconductor Device Packaging Market Volume (K Unit), by End-user Industry 2024 & 2032
- Figure 45: China Semiconductor Device Packaging Market Revenue Share (%), by End-user Industry 2024 & 2032
- Figure 46: China Semiconductor Device Packaging Market Volume Share (%), by End-user Industry 2024 & 2032
- Figure 47: China Semiconductor Device Packaging Market Revenue (Million), by Country 2024 & 2032
- Figure 48: China Semiconductor Device Packaging Market Volume (K Unit), by Country 2024 & 2032
- Figure 49: China Semiconductor Device Packaging Market Revenue Share (%), by Country 2024 & 2032
- Figure 50: China Semiconductor Device Packaging Market Volume Share (%), by Country 2024 & 2032
- Figure 51: Taiwan Semiconductor Device Packaging Market Revenue (Million), by Packaging Platform 2024 & 2032
- Figure 52: Taiwan Semiconductor Device Packaging Market Volume (K Unit), by Packaging Platform 2024 & 2032
- Figure 53: Taiwan Semiconductor Device Packaging Market Revenue Share (%), by Packaging Platform 2024 & 2032
- Figure 54: Taiwan Semiconductor Device Packaging Market Volume Share (%), by Packaging Platform 2024 & 2032
- Figure 55: Taiwan Semiconductor Device Packaging Market Revenue (Million), by End-user Industry 2024 & 2032
- Figure 56: Taiwan Semiconductor Device Packaging Market Volume (K Unit), by End-user Industry 2024 & 2032
- Figure 57: Taiwan Semiconductor Device Packaging Market Revenue Share (%), by End-user Industry 2024 & 2032
- Figure 58: Taiwan Semiconductor Device Packaging Market Volume Share (%), by End-user Industry 2024 & 2032
- Figure 59: Taiwan Semiconductor Device Packaging Market Revenue (Million), by Country 2024 & 2032
- Figure 60: Taiwan Semiconductor Device Packaging Market Volume (K Unit), by Country 2024 & 2032
- Figure 61: Taiwan Semiconductor Device Packaging Market Revenue Share (%), by Country 2024 & 2032
- Figure 62: Taiwan Semiconductor Device Packaging Market Volume Share (%), by Country 2024 & 2032
- Figure 63: South Korea Semiconductor Device Packaging Market Revenue (Million), by Packaging Platform 2024 & 2032
- Figure 64: South Korea Semiconductor Device Packaging Market Volume (K Unit), by Packaging Platform 2024 & 2032
- Figure 65: South Korea Semiconductor Device Packaging Market Revenue Share (%), by Packaging Platform 2024 & 2032
- Figure 66: South Korea Semiconductor Device Packaging Market Volume Share (%), by Packaging Platform 2024 & 2032
- Figure 67: South Korea Semiconductor Device Packaging Market Revenue (Million), by End-user Industry 2024 & 2032
- Figure 68: South Korea Semiconductor Device Packaging Market Volume (K Unit), by End-user Industry 2024 & 2032
- Figure 69: South Korea Semiconductor Device Packaging Market Revenue Share (%), by End-user Industry 2024 & 2032
- Figure 70: South Korea Semiconductor Device Packaging Market Volume Share (%), by End-user Industry 2024 & 2032
- Figure 71: South Korea Semiconductor Device Packaging Market Revenue (Million), by Country 2024 & 2032
- Figure 72: South Korea Semiconductor Device Packaging Market Volume (K Unit), by Country 2024 & 2032
- Figure 73: South Korea Semiconductor Device Packaging Market Revenue Share (%), by Country 2024 & 2032
- Figure 74: South Korea Semiconductor Device Packaging Market Volume Share (%), by Country 2024 & 2032
- Figure 75: Japan Semiconductor Device Packaging Market Revenue (Million), by Packaging Platform 2024 & 2032
- Figure 76: Japan Semiconductor Device Packaging Market Volume (K Unit), by Packaging Platform 2024 & 2032
- Figure 77: Japan Semiconductor Device Packaging Market Revenue Share (%), by Packaging Platform 2024 & 2032
- Figure 78: Japan Semiconductor Device Packaging Market Volume Share (%), by Packaging Platform 2024 & 2032
- Figure 79: Japan Semiconductor Device Packaging Market Revenue (Million), by End-user Industry 2024 & 2032
- Figure 80: Japan Semiconductor Device Packaging Market Volume (K Unit), by End-user Industry 2024 & 2032
- Figure 81: Japan Semiconductor Device Packaging Market Revenue Share (%), by End-user Industry 2024 & 2032
- Figure 82: Japan Semiconductor Device Packaging Market Volume Share (%), by End-user Industry 2024 & 2032
- Figure 83: Japan Semiconductor Device Packaging Market Revenue (Million), by Country 2024 & 2032
- Figure 84: Japan Semiconductor Device Packaging Market Volume (K Unit), by Country 2024 & 2032
- Figure 85: Japan Semiconductor Device Packaging Market Revenue Share (%), by Country 2024 & 2032
- Figure 86: Japan Semiconductor Device Packaging Market Volume Share (%), by Country 2024 & 2032
- Figure 87: Europe Semiconductor Device Packaging Market Revenue (Million), by Packaging Platform 2024 & 2032
- Figure 88: Europe Semiconductor Device Packaging Market Volume (K Unit), by Packaging Platform 2024 & 2032
- Figure 89: Europe Semiconductor Device Packaging Market Revenue Share (%), by Packaging Platform 2024 & 2032
- Figure 90: Europe Semiconductor Device Packaging Market Volume Share (%), by Packaging Platform 2024 & 2032
- Figure 91: Europe Semiconductor Device Packaging Market Revenue (Million), by End-user Industry 2024 & 2032
- Figure 92: Europe Semiconductor Device Packaging Market Volume (K Unit), by End-user Industry 2024 & 2032
- Figure 93: Europe Semiconductor Device Packaging Market Revenue Share (%), by End-user Industry 2024 & 2032
- Figure 94: Europe Semiconductor Device Packaging Market Volume Share (%), by End-user Industry 2024 & 2032
- Figure 95: Europe Semiconductor Device Packaging Market Revenue (Million), by Country 2024 & 2032
- Figure 96: Europe Semiconductor Device Packaging Market Volume (K Unit), by Country 2024 & 2032
- Figure 97: Europe Semiconductor Device Packaging Market Revenue Share (%), by Country 2024 & 2032
- Figure 98: Europe Semiconductor Device Packaging Market Volume Share (%), by Country 2024 & 2032
- Figure 99: Latin America Semiconductor Device Packaging Market Revenue (Million), by Packaging Platform 2024 & 2032
- Figure 100: Latin America Semiconductor Device Packaging Market Volume (K Unit), by Packaging Platform 2024 & 2032
- Figure 101: Latin America Semiconductor Device Packaging Market Revenue Share (%), by Packaging Platform 2024 & 2032
- Figure 102: Latin America Semiconductor Device Packaging Market Volume Share (%), by Packaging Platform 2024 & 2032
- Figure 103: Latin America Semiconductor Device Packaging Market Revenue (Million), by End-user Industry 2024 & 2032
- Figure 104: Latin America Semiconductor Device Packaging Market Volume (K Unit), by End-user Industry 2024 & 2032
- Figure 105: Latin America Semiconductor Device Packaging Market Revenue Share (%), by End-user Industry 2024 & 2032
- Figure 106: Latin America Semiconductor Device Packaging Market Volume Share (%), by End-user Industry 2024 & 2032
- Figure 107: Latin America Semiconductor Device Packaging Market Revenue (Million), by Country 2024 & 2032
- Figure 108: Latin America Semiconductor Device Packaging Market Volume (K Unit), by Country 2024 & 2032
- Figure 109: Latin America Semiconductor Device Packaging Market Revenue Share (%), by Country 2024 & 2032
- Figure 110: Latin America Semiconductor Device Packaging Market Volume Share (%), by Country 2024 & 2032
- Figure 111: Middle East and Africa Semiconductor Device Packaging Market Revenue (Million), by Packaging Platform 2024 & 2032
- Figure 112: Middle East and Africa Semiconductor Device Packaging Market Volume (K Unit), by Packaging Platform 2024 & 2032
- Figure 113: Middle East and Africa Semiconductor Device Packaging Market Revenue Share (%), by Packaging Platform 2024 & 2032
- Figure 114: Middle East and Africa Semiconductor Device Packaging Market Volume Share (%), by Packaging Platform 2024 & 2032
- Figure 115: Middle East and Africa Semiconductor Device Packaging Market Revenue (Million), by End-user Industry 2024 & 2032
- Figure 116: Middle East and Africa Semiconductor Device Packaging Market Volume (K Unit), by End-user Industry 2024 & 2032
- Figure 117: Middle East and Africa Semiconductor Device Packaging Market Revenue Share (%), by End-user Industry 2024 & 2032
- Figure 118: Middle East and Africa Semiconductor Device Packaging Market Volume Share (%), by End-user Industry 2024 & 2032
- Figure 119: Middle East and Africa Semiconductor Device Packaging Market Revenue (Million), by Country 2024 & 2032
- Figure 120: Middle East and Africa Semiconductor Device Packaging Market Volume (K Unit), by Country 2024 & 2032
- Figure 121: Middle East and Africa Semiconductor Device Packaging Market Revenue Share (%), by Country 2024 & 2032
- Figure 122: Middle East and Africa Semiconductor Device Packaging Market Volume Share (%), by Country 2024 & 2032
List of Tables
- Table 1: Global Semiconductor Device Packaging Market Revenue Million Forecast, by Region 2019 & 2032
- Table 2: Global Semiconductor Device Packaging Market Volume K Unit Forecast, by Region 2019 & 2032
- Table 3: Global Semiconductor Device Packaging Market Revenue Million Forecast, by Packaging Platform 2019 & 2032
- Table 4: Global Semiconductor Device Packaging Market Volume K Unit Forecast, by Packaging Platform 2019 & 2032
- Table 5: Global Semiconductor Device Packaging Market Revenue Million Forecast, by End-user Industry 2019 & 2032
- Table 6: Global Semiconductor Device Packaging Market Volume K Unit Forecast, by End-user Industry 2019 & 2032
- Table 7: Global Semiconductor Device Packaging Market Revenue Million Forecast, by Region 2019 & 2032
- Table 8: Global Semiconductor Device Packaging Market Volume K Unit Forecast, by Region 2019 & 2032
- Table 9: Global Semiconductor Device Packaging Market Revenue Million Forecast, by Country 2019 & 2032
- Table 10: Global Semiconductor Device Packaging Market Volume K Unit Forecast, by Country 2019 & 2032
- Table 11: United States Semiconductor Device Packaging Market Revenue (Million) Forecast, by Application 2019 & 2032
- Table 12: United States Semiconductor Device Packaging Market Volume (K Unit) Forecast, by Application 2019 & 2032
- Table 13: Canada Semiconductor Device Packaging Market Revenue (Million) Forecast, by Application 2019 & 2032
- Table 14: Canada Semiconductor Device Packaging Market Volume (K Unit) Forecast, by Application 2019 & 2032
- Table 15: Mexico Semiconductor Device Packaging Market Revenue (Million) Forecast, by Application 2019 & 2032
- Table 16: Mexico Semiconductor Device Packaging Market Volume (K Unit) Forecast, by Application 2019 & 2032
- Table 17: Global Semiconductor Device Packaging Market Revenue Million Forecast, by Country 2019 & 2032
- Table 18: Global Semiconductor Device Packaging Market Volume K Unit Forecast, by Country 2019 & 2032
- Table 19: Germany Semiconductor Device Packaging Market Revenue (Million) Forecast, by Application 2019 & 2032
- Table 20: Germany Semiconductor Device Packaging Market Volume (K Unit) Forecast, by Application 2019 & 2032
- Table 21: United Kingdom Semiconductor Device Packaging Market Revenue (Million) Forecast, by Application 2019 & 2032
- Table 22: United Kingdom Semiconductor Device Packaging Market Volume (K Unit) Forecast, by Application 2019 & 2032
- Table 23: France Semiconductor Device Packaging Market Revenue (Million) Forecast, by Application 2019 & 2032
- Table 24: France Semiconductor Device Packaging Market Volume (K Unit) Forecast, by Application 2019 & 2032
- Table 25: Spain Semiconductor Device Packaging Market Revenue (Million) Forecast, by Application 2019 & 2032
- Table 26: Spain Semiconductor Device Packaging Market Volume (K Unit) Forecast, by Application 2019 & 2032
- Table 27: Italy Semiconductor Device Packaging Market Revenue (Million) Forecast, by Application 2019 & 2032
- Table 28: Italy Semiconductor Device Packaging Market Volume (K Unit) Forecast, by Application 2019 & 2032
- Table 29: Spain Semiconductor Device Packaging Market Revenue (Million) Forecast, by Application 2019 & 2032
- Table 30: Spain Semiconductor Device Packaging Market Volume (K Unit) Forecast, by Application 2019 & 2032
- Table 31: Belgium Semiconductor Device Packaging Market Revenue (Million) Forecast, by Application 2019 & 2032
- Table 32: Belgium Semiconductor Device Packaging Market Volume (K Unit) Forecast, by Application 2019 & 2032
- Table 33: Netherland Semiconductor Device Packaging Market Revenue (Million) Forecast, by Application 2019 & 2032
- Table 34: Netherland Semiconductor Device Packaging Market Volume (K Unit) Forecast, by Application 2019 & 2032
- Table 35: Nordics Semiconductor Device Packaging Market Revenue (Million) Forecast, by Application 2019 & 2032
- Table 36: Nordics Semiconductor Device Packaging Market Volume (K Unit) Forecast, by Application 2019 & 2032
- Table 37: Rest of Europe Semiconductor Device Packaging Market Revenue (Million) Forecast, by Application 2019 & 2032
- Table 38: Rest of Europe Semiconductor Device Packaging Market Volume (K Unit) Forecast, by Application 2019 & 2032
- Table 39: Global Semiconductor Device Packaging Market Revenue Million Forecast, by Country 2019 & 2032
- Table 40: Global Semiconductor Device Packaging Market Volume K Unit Forecast, by Country 2019 & 2032
- Table 41: China Semiconductor Device Packaging Market Revenue (Million) Forecast, by Application 2019 & 2032
- Table 42: China Semiconductor Device Packaging Market Volume (K Unit) Forecast, by Application 2019 & 2032
- Table 43: Japan Semiconductor Device Packaging Market Revenue (Million) Forecast, by Application 2019 & 2032
- Table 44: Japan Semiconductor Device Packaging Market Volume (K Unit) Forecast, by Application 2019 & 2032
- Table 45: India Semiconductor Device Packaging Market Revenue (Million) Forecast, by Application 2019 & 2032
- Table 46: India Semiconductor Device Packaging Market Volume (K Unit) Forecast, by Application 2019 & 2032
- Table 47: South Korea Semiconductor Device Packaging Market Revenue (Million) Forecast, by Application 2019 & 2032
- Table 48: South Korea Semiconductor Device Packaging Market Volume (K Unit) Forecast, by Application 2019 & 2032
- Table 49: Southeast Asia Semiconductor Device Packaging Market Revenue (Million) Forecast, by Application 2019 & 2032
- Table 50: Southeast Asia Semiconductor Device Packaging Market Volume (K Unit) Forecast, by Application 2019 & 2032
- Table 51: Australia Semiconductor Device Packaging Market Revenue (Million) Forecast, by Application 2019 & 2032
- Table 52: Australia Semiconductor Device Packaging Market Volume (K Unit) Forecast, by Application 2019 & 2032
- Table 53: Indonesia Semiconductor Device Packaging Market Revenue (Million) Forecast, by Application 2019 & 2032
- Table 54: Indonesia Semiconductor Device Packaging Market Volume (K Unit) Forecast, by Application 2019 & 2032
- Table 55: Phillipes Semiconductor Device Packaging Market Revenue (Million) Forecast, by Application 2019 & 2032
- Table 56: Phillipes Semiconductor Device Packaging Market Volume (K Unit) Forecast, by Application 2019 & 2032
- Table 57: Singapore Semiconductor Device Packaging Market Revenue (Million) Forecast, by Application 2019 & 2032
- Table 58: Singapore Semiconductor Device Packaging Market Volume (K Unit) Forecast, by Application 2019 & 2032
- Table 59: Thailandc Semiconductor Device Packaging Market Revenue (Million) Forecast, by Application 2019 & 2032
- Table 60: Thailandc Semiconductor Device Packaging Market Volume (K Unit) Forecast, by Application 2019 & 2032
- Table 61: Rest of Asia Pacific Semiconductor Device Packaging Market Revenue (Million) Forecast, by Application 2019 & 2032
- Table 62: Rest of Asia Pacific Semiconductor Device Packaging Market Volume (K Unit) Forecast, by Application 2019 & 2032
- Table 63: Global Semiconductor Device Packaging Market Revenue Million Forecast, by Country 2019 & 2032
- Table 64: Global Semiconductor Device Packaging Market Volume K Unit Forecast, by Country 2019 & 2032
- Table 65: Brazil Semiconductor Device Packaging Market Revenue (Million) Forecast, by Application 2019 & 2032
- Table 66: Brazil Semiconductor Device Packaging Market Volume (K Unit) Forecast, by Application 2019 & 2032
- Table 67: Argentina Semiconductor Device Packaging Market Revenue (Million) Forecast, by Application 2019 & 2032
- Table 68: Argentina Semiconductor Device Packaging Market Volume (K Unit) Forecast, by Application 2019 & 2032
- Table 69: Peru Semiconductor Device Packaging Market Revenue (Million) Forecast, by Application 2019 & 2032
- Table 70: Peru Semiconductor Device Packaging Market Volume (K Unit) Forecast, by Application 2019 & 2032
- Table 71: Chile Semiconductor Device Packaging Market Revenue (Million) Forecast, by Application 2019 & 2032
- Table 72: Chile Semiconductor Device Packaging Market Volume (K Unit) Forecast, by Application 2019 & 2032
- Table 73: Colombia Semiconductor Device Packaging Market Revenue (Million) Forecast, by Application 2019 & 2032
- Table 74: Colombia Semiconductor Device Packaging Market Volume (K Unit) Forecast, by Application 2019 & 2032
- Table 75: Ecuador Semiconductor Device Packaging Market Revenue (Million) Forecast, by Application 2019 & 2032
- Table 76: Ecuador Semiconductor Device Packaging Market Volume (K Unit) Forecast, by Application 2019 & 2032
- Table 77: Venezuela Semiconductor Device Packaging Market Revenue (Million) Forecast, by Application 2019 & 2032
- Table 78: Venezuela Semiconductor Device Packaging Market Volume (K Unit) Forecast, by Application 2019 & 2032
- Table 79: Rest of South America Semiconductor Device Packaging Market Revenue (Million) Forecast, by Application 2019 & 2032
- Table 80: Rest of South America Semiconductor Device Packaging Market Volume (K Unit) Forecast, by Application 2019 & 2032
- Table 81: Global Semiconductor Device Packaging Market Revenue Million Forecast, by Country 2019 & 2032
- Table 82: Global Semiconductor Device Packaging Market Volume K Unit Forecast, by Country 2019 & 2032
- Table 83: United States Semiconductor Device Packaging Market Revenue (Million) Forecast, by Application 2019 & 2032
- Table 84: United States Semiconductor Device Packaging Market Volume (K Unit) Forecast, by Application 2019 & 2032
- Table 85: Canada Semiconductor Device Packaging Market Revenue (Million) Forecast, by Application 2019 & 2032
- Table 86: Canada Semiconductor Device Packaging Market Volume (K Unit) Forecast, by Application 2019 & 2032
- Table 87: Mexico Semiconductor Device Packaging Market Revenue (Million) Forecast, by Application 2019 & 2032
- Table 88: Mexico Semiconductor Device Packaging Market Volume (K Unit) Forecast, by Application 2019 & 2032
- Table 89: Global Semiconductor Device Packaging Market Revenue Million Forecast, by Country 2019 & 2032
- Table 90: Global Semiconductor Device Packaging Market Volume K Unit Forecast, by Country 2019 & 2032
- Table 91: United Arab Emirates Semiconductor Device Packaging Market Revenue (Million) Forecast, by Application 2019 & 2032
- Table 92: United Arab Emirates Semiconductor Device Packaging Market Volume (K Unit) Forecast, by Application 2019 & 2032
- Table 93: Saudi Arabia Semiconductor Device Packaging Market Revenue (Million) Forecast, by Application 2019 & 2032
- Table 94: Saudi Arabia Semiconductor Device Packaging Market Volume (K Unit) Forecast, by Application 2019 & 2032
- Table 95: South Africa Semiconductor Device Packaging Market Revenue (Million) Forecast, by Application 2019 & 2032
- Table 96: South Africa Semiconductor Device Packaging Market Volume (K Unit) Forecast, by Application 2019 & 2032
- Table 97: Rest of Middle East and Africa Semiconductor Device Packaging Market Revenue (Million) Forecast, by Application 2019 & 2032
- Table 98: Rest of Middle East and Africa Semiconductor Device Packaging Market Volume (K Unit) Forecast, by Application 2019 & 2032
- Table 99: Global Semiconductor Device Packaging Market Revenue Million Forecast, by Packaging Platform 2019 & 2032
- Table 100: Global Semiconductor Device Packaging Market Volume K Unit Forecast, by Packaging Platform 2019 & 2032
- Table 101: Global Semiconductor Device Packaging Market Revenue Million Forecast, by End-user Industry 2019 & 2032
- Table 102: Global Semiconductor Device Packaging Market Volume K Unit Forecast, by End-user Industry 2019 & 2032
- Table 103: Global Semiconductor Device Packaging Market Revenue Million Forecast, by Country 2019 & 2032
- Table 104: Global Semiconductor Device Packaging Market Volume K Unit Forecast, by Country 2019 & 2032
- Table 105: Global Semiconductor Device Packaging Market Revenue Million Forecast, by Packaging Platform 2019 & 2032
- Table 106: Global Semiconductor Device Packaging Market Volume K Unit Forecast, by Packaging Platform 2019 & 2032
- Table 107: Global Semiconductor Device Packaging Market Revenue Million Forecast, by End-user Industry 2019 & 2032
- Table 108: Global Semiconductor Device Packaging Market Volume K Unit Forecast, by End-user Industry 2019 & 2032
- Table 109: Global Semiconductor Device Packaging Market Revenue Million Forecast, by Country 2019 & 2032
- Table 110: Global Semiconductor Device Packaging Market Volume K Unit Forecast, by Country 2019 & 2032
- Table 111: Global Semiconductor Device Packaging Market Revenue Million Forecast, by Packaging Platform 2019 & 2032
- Table 112: Global Semiconductor Device Packaging Market Volume K Unit Forecast, by Packaging Platform 2019 & 2032
- Table 113: Global Semiconductor Device Packaging Market Revenue Million Forecast, by End-user Industry 2019 & 2032
- Table 114: Global Semiconductor Device Packaging Market Volume K Unit Forecast, by End-user Industry 2019 & 2032
- Table 115: Global Semiconductor Device Packaging Market Revenue Million Forecast, by Country 2019 & 2032
- Table 116: Global Semiconductor Device Packaging Market Volume K Unit Forecast, by Country 2019 & 2032
- Table 117: Global Semiconductor Device Packaging Market Revenue Million Forecast, by Packaging Platform 2019 & 2032
- Table 118: Global Semiconductor Device Packaging Market Volume K Unit Forecast, by Packaging Platform 2019 & 2032
- Table 119: Global Semiconductor Device Packaging Market Revenue Million Forecast, by End-user Industry 2019 & 2032
- Table 120: Global Semiconductor Device Packaging Market Volume K Unit Forecast, by End-user Industry 2019 & 2032
- Table 121: Global Semiconductor Device Packaging Market Revenue Million Forecast, by Country 2019 & 2032
- Table 122: Global Semiconductor Device Packaging Market Volume K Unit Forecast, by Country 2019 & 2032
- Table 123: Global Semiconductor Device Packaging Market Revenue Million Forecast, by Packaging Platform 2019 & 2032
- Table 124: Global Semiconductor Device Packaging Market Volume K Unit Forecast, by Packaging Platform 2019 & 2032
- Table 125: Global Semiconductor Device Packaging Market Revenue Million Forecast, by End-user Industry 2019 & 2032
- Table 126: Global Semiconductor Device Packaging Market Volume K Unit Forecast, by End-user Industry 2019 & 2032
- Table 127: Global Semiconductor Device Packaging Market Revenue Million Forecast, by Country 2019 & 2032
- Table 128: Global Semiconductor Device Packaging Market Volume K Unit Forecast, by Country 2019 & 2032
- Table 129: Global Semiconductor Device Packaging Market Revenue Million Forecast, by Packaging Platform 2019 & 2032
- Table 130: Global Semiconductor Device Packaging Market Volume K Unit Forecast, by Packaging Platform 2019 & 2032
- Table 131: Global Semiconductor Device Packaging Market Revenue Million Forecast, by End-user Industry 2019 & 2032
- Table 132: Global Semiconductor Device Packaging Market Volume K Unit Forecast, by End-user Industry 2019 & 2032
- Table 133: Global Semiconductor Device Packaging Market Revenue Million Forecast, by Country 2019 & 2032
- Table 134: Global Semiconductor Device Packaging Market Volume K Unit Forecast, by Country 2019 & 2032
- Table 135: Global Semiconductor Device Packaging Market Revenue Million Forecast, by Packaging Platform 2019 & 2032
- Table 136: Global Semiconductor Device Packaging Market Volume K Unit Forecast, by Packaging Platform 2019 & 2032
- Table 137: Global Semiconductor Device Packaging Market Revenue Million Forecast, by End-user Industry 2019 & 2032
- Table 138: Global Semiconductor Device Packaging Market Volume K Unit Forecast, by End-user Industry 2019 & 2032
- Table 139: Global Semiconductor Device Packaging Market Revenue Million Forecast, by Country 2019 & 2032
- Table 140: Global Semiconductor Device Packaging Market Volume K Unit Forecast, by Country 2019 & 2032
- Table 141: Global Semiconductor Device Packaging Market Revenue Million Forecast, by Packaging Platform 2019 & 2032
- Table 142: Global Semiconductor Device Packaging Market Volume K Unit Forecast, by Packaging Platform 2019 & 2032
- Table 143: Global Semiconductor Device Packaging Market Revenue Million Forecast, by End-user Industry 2019 & 2032
- Table 144: Global Semiconductor Device Packaging Market Volume K Unit Forecast, by End-user Industry 2019 & 2032
- Table 145: Global Semiconductor Device Packaging Market Revenue Million Forecast, by Country 2019 & 2032
- Table 146: Global Semiconductor Device Packaging Market Volume K Unit Forecast, by Country 2019 & 2032
Frequently Asked Questions
1. What is the projected Compound Annual Growth Rate (CAGR) of the Semiconductor Device Packaging Market?
The projected CAGR is approximately 10.95%.
2. Which companies are prominent players in the Semiconductor Device Packaging Market?
Key companies in the market include Tianshui Huatian Technology Co Ltd, Samsung Electronics Co Ltd, ASE Group, Amkor Technology, UTAC Group, Unisem (M) Berhad, Chipbond Technology Corporation, Powertech Technology Inc, Siliconware Precision Industries Co Ltd (SPIL), JCET/STATS ChipPAC, Interconnect Systems Inc (ISI), Chipmos Technologies Inc, Intel Corporation, Fujitsu Semiconductor Ltd.
3. What are the main segments of the Semiconductor Device Packaging Market?
The market segments include Packaging Platform, End-user Industry.
4. Can you provide details about the market size?
The market size is estimated to be USD 47.22 Million as of 2022.
5. What are some drivers contributing to market growth?
Growing Consumption of Semiconductor Devices Across Industries; Favorable Government Policies and Regulations in Developing Countries.
6. What are the notable trends driving market growth?
Ultra High-density Fan-Out Advanced Packaging Segment to Hold Significant Market Share.
7. Are there any restraints impacting market growth?
High Initial Investment and Increasing Complexity of Semiconductor IC Designs.
8. Can you provide examples of recent developments in the market?
November 2023 - JCET Group announced that its holding company, JCET Automotive Electronics (Shanghai) Co., Ltd., will receive a capital increase of RMB 4.4 billion (USD 0.61 billion), bringing its registered capital to RMB 4.8 billion (USD 0.67 billion). The investment aims to accelerate the construction of an advanced packaging factory for automotive chip products in Shanghai's Lingang Special Zone.
9. What pricing options are available for accessing the report?
Pricing options include single-user, multi-user, and enterprise licenses priced at USD 4750, USD 5250, and USD 8750 respectively.
10. Is the market size provided in terms of value or volume?
The market size is provided in terms of value, measured in Million and volume, measured in K Unit.
11. Are there any specific market keywords associated with the report?
Yes, the market keyword associated with the report is "Semiconductor Device Packaging Market," which aids in identifying and referencing the specific market segment covered.
12. How do I determine which pricing option suits my needs best?
The pricing options vary based on user requirements and access needs. Individual users may opt for single-user licenses, while businesses requiring broader access may choose multi-user or enterprise licenses for cost-effective access to the report.
13. Are there any additional resources or data provided in the Semiconductor Device Packaging Market report?
While the report offers comprehensive insights, it's advisable to review the specific contents or supplementary materials provided to ascertain if additional resources or data are available.
14. How can I stay updated on further developments or reports in the Semiconductor Device Packaging Market?
To stay informed about further developments, trends, and reports in the Semiconductor Device Packaging Market, consider subscribing to industry newsletters, following relevant companies and organizations, or regularly checking reputable industry news sources and publications.
Methodology
Step 1 - Identification of Relevant Samples Size from Population Database


Step 2 - Approaches for Defining Global Market Size (Value, Volume* & Price*)

Note*: In applicable scenarios
Step 3 - Data Sources
Primary Research
- Web Analytics
- Survey Reports
- Research Institute
- Latest Research Reports
- Opinion Leaders
Secondary Research
- Annual Reports
- White Paper
- Latest Press Release
- Industry Association
- Paid Database
- Investor Presentations

Step 4 - Data Triangulation
Involves using different sources of information in order to increase the validity of a study
These sources are likely to be stakeholders in a program - participants, other researchers, program staff, other community members, and so on.
Then we put all data in single framework & apply various statistical tools to find out the dynamic on the market.
During the analysis stage, feedback from the stakeholder groups would be compared to determine areas of agreement as well as areas of divergence


