

Key Insights
The global self-healing materials market is projected for substantial expansion, driven by increasing adoption across diverse industries. This growth is fueled by the inherent benefits of self-healing materials, including enhanced product durability, reduced maintenance expenses, and improved safety standards. Key sectors propelling this market include automotive, seeking lightweight and resilient components; aerospace, aiming to boost structural integrity and minimize operational disruptions; and healthcare, requiring advanced biocompatible materials for medical applications. The growing emphasis on sustainability also supports market growth, as self-healing materials reduce replacement frequency, thus minimizing waste and environmental impact. Market segmentation highlights robust growth in polymers, composites, and ceramics, with healthcare and automotive end-user industries leading the trajectory. The Asia-Pacific region, particularly China and India, presents significant growth potential due to rapid industrialization and infrastructure development. Challenges include high initial material costs and the relative immaturity of the technology. Continued research and development, supported by policies promoting sustainable technologies, are vital for market acceleration.
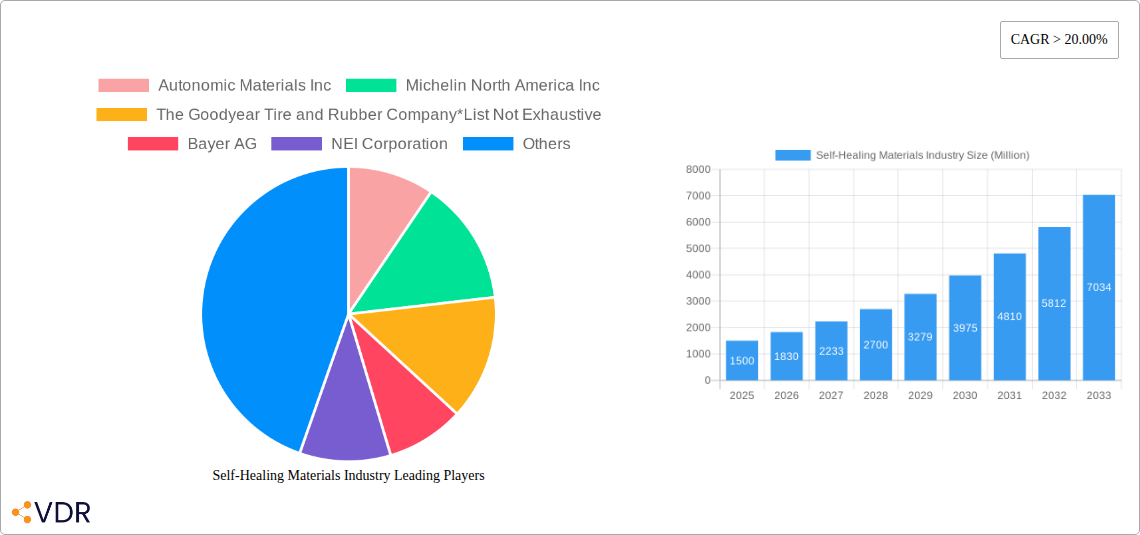
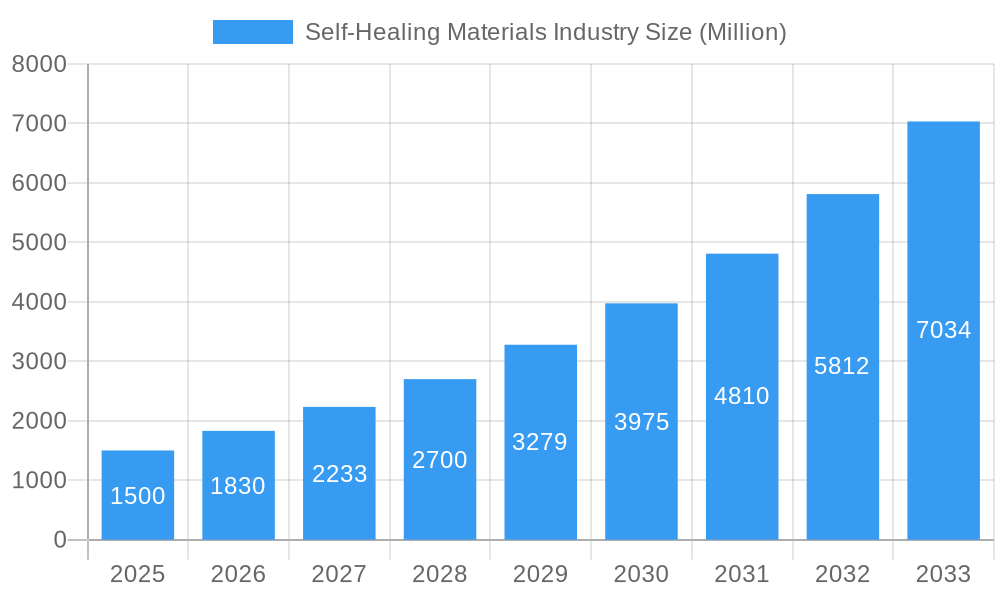
Self-Healing Materials Industry Market Size (In Billion)
The competitive landscape features established chemical corporations and specialized material innovators. Strategic collaborations are increasingly common, aiming to leverage complementary expertise and expedite product advancements. Future growth hinges on overcoming technological constraints, reducing production costs, and broadening application scope. Developing self-healing materials with tailored properties for specific industry needs will be crucial for realizing the market's full potential. Addressing challenges related to extreme condition durability, manufacturing scalability, and long-term performance reliability is paramount. Ongoing advancements in nanotechnology and materials science are expected to foster further innovation in this promising domain.
Self-Healing Materials Industry Company Market Share
Self-Healing Materials Market Analysis: 2019-2033
This comprehensive report offers an in-depth analysis of the self-healing materials market, detailing market size, growth trajectories, key players, and future opportunities. The analysis covers the period from 2019 to 2033, with a base year of 2025. The forecast period extends from 2025 to 2033. This report is essential for industry professionals, investors, and researchers seeking to understand and leverage the considerable potential of this innovative market segment. The market is segmented by material type (Polymers, Composites, Ceramics, Concrete, Others) and end-user industry (Healthcare, Automotive, Electrical & Electronics, Construction, Aerospace, Others).
Self-Healing Materials Industry Market Dynamics & Structure
The self-healing materials market is characterized by moderate concentration, with a few large players and numerous smaller specialized firms. Technological innovation is a primary driver, with ongoing research leading to advancements in polymer chemistry, composite materials, and smart materials. Stringent regulatory frameworks related to material safety and environmental impact influence market growth. Competitive product substitutes, such as traditional repair methods, pose a challenge, while the increasing demand for durable and sustainable materials fuels market expansion. End-user demographics, particularly in the construction and automotive sectors, heavily influence market demand. Mergers and acquisitions (M&A) activity is expected to remain moderate, with strategic partnerships becoming increasingly important.
- Market Concentration: Moderately concentrated, with a Herfindahl-Hirschman Index (HHI) estimated at xx in 2025.
- Technological Innovation: Significant R&D investments drive advancements in self-healing capabilities and material performance.
- Regulatory Framework: Stringent safety and environmental regulations influence material development and adoption.
- Competitive Substitutes: Traditional repair methods and materials pose a competitive threat.
- M&A Activity: Moderate M&A activity is expected, driven by strategic expansion and technology acquisition. Estimated deal volume at xx deals in 2024.
Self-Healing Materials Industry Growth Trends & Insights
The self-healing materials market is experiencing robust growth, driven by increasing demand across various end-use sectors. The market size is projected to reach xx million by 2033, exhibiting a CAGR of xx% during the forecast period. Adoption rates are rising steadily, particularly in applications requiring enhanced durability and reduced maintenance. Technological disruptions, such as the development of novel self-healing polymers and composites, further accelerate market growth. Consumer behavior shifts towards sustainable and eco-friendly materials are also contributing to the market's expansion. Market penetration in key segments like automotive and aerospace is expected to increase significantly by 2033.
Dominant Regions, Countries, or Segments in Self-Healing Materials Industry
North America currently holds a dominant position in the self-healing materials market, driven by significant technological advancements and robust R&D activities. However, Asia-Pacific is projected to experience the fastest growth rate during the forecast period, fueled by rapid industrialization and increasing infrastructure development. The Polymers segment currently holds the largest market share by type, while the Automotive and Construction industries are the key end-user drivers.
- North America: Strong R&D investment and early adoption drive market dominance.
- Asia-Pacific: Rapid industrialization and infrastructure development fuel high growth potential.
- Europe: Significant market share, driven by strong manufacturing and automotive industries.
- Polymers Segment: Largest market share due to versatility and established applications.
- Automotive Industry: High demand for durable and lightweight components.
Self-Healing Materials Industry Product Landscape
The self-healing materials landscape encompasses a wide range of products, including self-healing polymers, composites, ceramics, and concrete. These materials leverage various mechanisms, such as microcapsule technology, vascular networks, and stimuli-responsive polymers, to achieve self-repair capabilities. Product innovation focuses on improving healing efficiency, durability, and cost-effectiveness. The unique selling propositions of these materials include enhanced longevity, reduced maintenance costs, and improved safety.
Key Drivers, Barriers & Challenges in Self-Healing Materials Industry
Key Drivers:
- Growing demand for durable and sustainable materials across various sectors.
- Advancements in materials science and nanotechnology leading to improved self-healing capabilities.
- Increasing government support for R&D and the development of innovative technologies.
Challenges:
- High initial cost of self-healing materials compared to conventional materials.
- Limited scalability and availability of some self-healing materials.
- Lack of awareness and understanding of the benefits of self-healing materials among end-users.
Emerging Opportunities in Self-Healing Materials Industry
The self-healing materials market presents several untapped opportunities, including the development of advanced self-healing coatings for infrastructure protection, the creation of self-healing electronics for increased device longevity, and the application of self-healing materials in biomedical devices. Further growth can be expected from exploring applications in the renewable energy sector, where extended lifespans of components are crucial.
Growth Accelerators in the Self-Healing Materials Industry
Technological breakthroughs in materials science and nanotechnology are expected to drive substantial growth, as is the development of novel self-healing mechanisms and functionalities. Strategic partnerships between material suppliers and end-users will play a significant role in accelerating market penetration. Expansion into emerging markets with growing infrastructure needs will also propel market expansion.
Key Players Shaping the Self-Healing Materials Industry Market
- Autonomic Materials Inc
- Michelin North America Inc
- The Goodyear Tire and Rubber Company
- Bayer AG
- NEI Corporation
- Evonik Industries AG
- MacDermid Autotype Ltd
- BASF SE
- Acciona S.A
- Covestro AG
- Apple Inc
Notable Milestones in Self-Healing Materials Industry Sector
- December 2022: Scientists at Riken, Japan, announced the creation of a self-healing polymer using readily available building blocks, significantly reducing production costs and expanding accessibility.
- October 2022: Researchers at North Carolina State University developed a new self-healing composite enabling in-situ repair of structures, extending the lifespan of components used in wind turbines and aircraft.
In-Depth Self-Healing Materials Industry Market Outlook
The self-healing materials market is poised for significant growth, driven by the continuous development of advanced materials and expansion into diverse applications. Strategic partnerships and R&D investments will further accelerate market penetration. Future opportunities lie in developing cost-effective self-healing solutions for various sectors, leading to a substantial increase in market size and influence.
Self-Healing Materials Industry Segmentation
-
1. Type
- 1.1. Polymers
- 1.2. Composites
- 1.3. Ceramics
- 1.4. Concrete
- 1.5. Other Types
-
2. End-user Industry
- 2.1. Healthcare
- 2.2. Automotive
- 2.3. Electrical and Electronics
- 2.4. Construction
- 2.5. Aerospace
- 2.6. Other End-user Industries
Self-Healing Materials Industry Segmentation By Geography
-
1. Asia Pacific
- 1.1. China
- 1.2. India
- 1.3. Japan
- 1.4. South Korea
- 1.5. ASEAN Countries
- 1.6. Rest of Asia Pacific
-
2. North America
- 2.1. United States
- 2.2. Canada
- 2.3. Mexico
-
3. Europe
- 3.1. Germany
- 3.2. United Kingdom
- 3.3. Italy
- 3.4. France
- 3.5. Rest of Europe
-
4. South America
- 4.1. Brazil
- 4.2. Argentina
- 4.3. Rest of South America
-
5. Middle East and Africa
- 5.1. Saudi Arabia
- 5.2. South Africa
- 5.3. Rest of Middle East and Africa
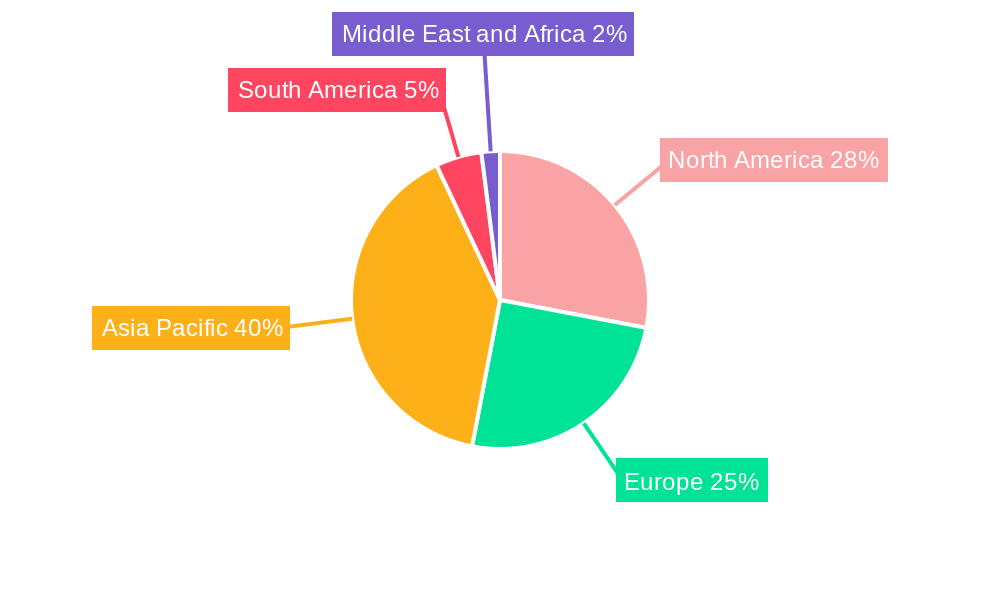
Self-Healing Materials Industry Regional Market Share
Geographic Coverage of Self-Healing Materials Industry
Self-Healing Materials Industry REPORT HIGHLIGHTS
| Aspects | Details |
|---|---|
| Study Period | 2020-2034 |
| Base Year | 2025 |
| Estimated Year | 2026 |
| Forecast Period | 2026-2034 |
| Historical Period | 2020-2025 |
| Growth Rate | CAGR of 31.5% from 2020-2034 |
| Segmentation |
|
Table of Contents
- 1. Introduction
- 1.1. Research Scope
- 1.2. Market Segmentation
- 1.3. Research Objective
- 1.4. Definitions and Assumptions
- 2. Executive Summary
- 2.1. Market Snapshot
- 3. Market Dynamics
- 3.1. Market Drivers
- 3.2. Market Restrains
- 3.3. Market Trends
- 3.4. Market Opportunities
- 4. Market Factor Analysis
- 4.1. Porters Five Forces
- 4.1.1. Bargaining Power of Suppliers
- 4.1.2. Bargaining Power of Buyers
- 4.1.3. Threat of New Entrants
- 4.1.4. Threat of Substitutes
- 4.1.5. Competitive Rivalry
- 4.2. PESTEL analysis
- 4.3. BCG Analysis
- 4.3.1. Stars (High Growth, High Market Share)
- 4.3.2. Cash Cows (Low Growth, High Market Share)
- 4.3.3. Question Mark (High Growth, Low Market Share)
- 4.3.4. Dogs (Low Growth, Low Market Share)
- 4.4. Ansoff Matrix Analysis
- 4.5. Supply Chain Analysis
- 4.6. Regulatory Landscape
- 4.7. Current Market Potential and Opportunity Assessment (TAM–SAM–SOM Framework)
- 4.8. VDR Analyst Note
- 4.1. Porters Five Forces
- 5. Market Analysis, Insights and Forecast 2021-2033
- 5.1. Market Analysis, Insights and Forecast - by Type
- 5.1.1. Polymers
- 5.1.2. Composites
- 5.1.3. Ceramics
- 5.1.4. Concrete
- 5.1.5. Other Types
- 5.2. Market Analysis, Insights and Forecast - by End-user Industry
- 5.2.1. Healthcare
- 5.2.2. Automotive
- 5.2.3. Electrical and Electronics
- 5.2.4. Construction
- 5.2.5. Aerospace
- 5.2.6. Other End-user Industries
- 5.3. Market Analysis, Insights and Forecast - by Region
- 5.3.1. Asia Pacific
- 5.3.2. North America
- 5.3.3. Europe
- 5.3.4. South America
- 5.3.5. Middle East and Africa
- 5.1. Market Analysis, Insights and Forecast - by Type
- 6. Global Self-Healing Materials Industry Analysis, Insights and Forecast, 2021-2033
- 6.1. Market Analysis, Insights and Forecast - by Type
- 6.1.1. Polymers
- 6.1.2. Composites
- 6.1.3. Ceramics
- 6.1.4. Concrete
- 6.1.5. Other Types
- 6.2. Market Analysis, Insights and Forecast - by End-user Industry
- 6.2.1. Healthcare
- 6.2.2. Automotive
- 6.2.3. Electrical and Electronics
- 6.2.4. Construction
- 6.2.5. Aerospace
- 6.2.6. Other End-user Industries
- 6.1. Market Analysis, Insights and Forecast - by Type
- 7. Asia Pacific Self-Healing Materials Industry Analysis, Insights and Forecast, 2021-2033
- 7.1. Market Analysis, Insights and Forecast - by Type
- 7.1.1. Polymers
- 7.1.2. Composites
- 7.1.3. Ceramics
- 7.1.4. Concrete
- 7.1.5. Other Types
- 7.2. Market Analysis, Insights and Forecast - by End-user Industry
- 7.2.1. Healthcare
- 7.2.2. Automotive
- 7.2.3. Electrical and Electronics
- 7.2.4. Construction
- 7.2.5. Aerospace
- 7.2.6. Other End-user Industries
- 7.1. Market Analysis, Insights and Forecast - by Type
- 8. North America Self-Healing Materials Industry Analysis, Insights and Forecast, 2021-2033
- 8.1. Market Analysis, Insights and Forecast - by Type
- 8.1.1. Polymers
- 8.1.2. Composites
- 8.1.3. Ceramics
- 8.1.4. Concrete
- 8.1.5. Other Types
- 8.2. Market Analysis, Insights and Forecast - by End-user Industry
- 8.2.1. Healthcare
- 8.2.2. Automotive
- 8.2.3. Electrical and Electronics
- 8.2.4. Construction
- 8.2.5. Aerospace
- 8.2.6. Other End-user Industries
- 8.1. Market Analysis, Insights and Forecast - by Type
- 9. Europe Self-Healing Materials Industry Analysis, Insights and Forecast, 2021-2033
- 9.1. Market Analysis, Insights and Forecast - by Type
- 9.1.1. Polymers
- 9.1.2. Composites
- 9.1.3. Ceramics
- 9.1.4. Concrete
- 9.1.5. Other Types
- 9.2. Market Analysis, Insights and Forecast - by End-user Industry
- 9.2.1. Healthcare
- 9.2.2. Automotive
- 9.2.3. Electrical and Electronics
- 9.2.4. Construction
- 9.2.5. Aerospace
- 9.2.6. Other End-user Industries
- 9.1. Market Analysis, Insights and Forecast - by Type
- 10. South America Self-Healing Materials Industry Analysis, Insights and Forecast, 2021-2033
- 10.1. Market Analysis, Insights and Forecast - by Type
- 10.1.1. Polymers
- 10.1.2. Composites
- 10.1.3. Ceramics
- 10.1.4. Concrete
- 10.1.5. Other Types
- 10.2. Market Analysis, Insights and Forecast - by End-user Industry
- 10.2.1. Healthcare
- 10.2.2. Automotive
- 10.2.3. Electrical and Electronics
- 10.2.4. Construction
- 10.2.5. Aerospace
- 10.2.6. Other End-user Industries
- 10.1. Market Analysis, Insights and Forecast - by Type
- 11. Middle East and Africa Self-Healing Materials Industry Analysis, Insights and Forecast, 2021-2033
- 11.1. Market Analysis, Insights and Forecast - by Type
- 11.1.1. Polymers
- 11.1.2. Composites
- 11.1.3. Ceramics
- 11.1.4. Concrete
- 11.1.5. Other Types
- 11.2. Market Analysis, Insights and Forecast - by End-user Industry
- 11.2.1. Healthcare
- 11.2.2. Automotive
- 11.2.3. Electrical and Electronics
- 11.2.4. Construction
- 11.2.5. Aerospace
- 11.2.6. Other End-user Industries
- 11.1. Market Analysis, Insights and Forecast - by Type
- 12. Competitive Analysis
- 12.1. Company Profiles
- 12.1.1 Autonomic Materials Inc
- 12.1.1.1. Company Overview
- 12.1.1.2. Products
- 12.1.1.3. Company Financials
- 12.1.1.4. SWOT Analysis
- 12.1.2 Michelin North America Inc
- 12.1.2.1. Company Overview
- 12.1.2.2. Products
- 12.1.2.3. Company Financials
- 12.1.2.4. SWOT Analysis
- 12.1.3 The Goodyear Tire and Rubber Company*List Not Exhaustive
- 12.1.3.1. Company Overview
- 12.1.3.2. Products
- 12.1.3.3. Company Financials
- 12.1.3.4. SWOT Analysis
- 12.1.4 Bayer AG
- 12.1.4.1. Company Overview
- 12.1.4.2. Products
- 12.1.4.3. Company Financials
- 12.1.4.4. SWOT Analysis
- 12.1.5 NEI Corporation
- 12.1.5.1. Company Overview
- 12.1.5.2. Products
- 12.1.5.3. Company Financials
- 12.1.5.4. SWOT Analysis
- 12.1.6 Evonik Industries AG
- 12.1.6.1. Company Overview
- 12.1.6.2. Products
- 12.1.6.3. Company Financials
- 12.1.6.4. SWOT Analysis
- 12.1.7 MacDermid Autotype Ltd
- 12.1.7.1. Company Overview
- 12.1.7.2. Products
- 12.1.7.3. Company Financials
- 12.1.7.4. SWOT Analysis
- 12.1.8 BASF SE
- 12.1.8.1. Company Overview
- 12.1.8.2. Products
- 12.1.8.3. Company Financials
- 12.1.8.4. SWOT Analysis
- 12.1.9 Acciona S A
- 12.1.9.1. Company Overview
- 12.1.9.2. Products
- 12.1.9.3. Company Financials
- 12.1.9.4. SWOT Analysis
- 12.1.10 Covestro AG
- 12.1.10.1. Company Overview
- 12.1.10.2. Products
- 12.1.10.3. Company Financials
- 12.1.10.4. SWOT Analysis
- 12.1.11 Apple Inc
- 12.1.11.1. Company Overview
- 12.1.11.2. Products
- 12.1.11.3. Company Financials
- 12.1.11.4. SWOT Analysis
- 12.1.1 Autonomic Materials Inc
- 12.2. Market Entropy
- 12.2.1 Company's Key Areas Served
- 12.2.2 Recent Developments
- 12.3. Company Market Share Analysis 2025
- 12.3.1 Top 5 Companies Market Share Analysis
- 12.3.2 Top 3 Companies Market Share Analysis
- 12.4. List of Potential Customers
- 13. Research Methodology
List of Figures
- Figure 1: Global Self-Healing Materials Industry Revenue Breakdown (billion, %) by Region 2025 & 2033
- Figure 2: Asia Pacific Self-Healing Materials Industry Revenue (billion), by Type 2025 & 2033
- Figure 3: Asia Pacific Self-Healing Materials Industry Revenue Share (%), by Type 2025 & 2033
- Figure 4: Asia Pacific Self-Healing Materials Industry Revenue (billion), by End-user Industry 2025 & 2033
- Figure 5: Asia Pacific Self-Healing Materials Industry Revenue Share (%), by End-user Industry 2025 & 2033
- Figure 6: Asia Pacific Self-Healing Materials Industry Revenue (billion), by Country 2025 & 2033
- Figure 7: Asia Pacific Self-Healing Materials Industry Revenue Share (%), by Country 2025 & 2033
- Figure 8: North America Self-Healing Materials Industry Revenue (billion), by Type 2025 & 2033
- Figure 9: North America Self-Healing Materials Industry Revenue Share (%), by Type 2025 & 2033
- Figure 10: North America Self-Healing Materials Industry Revenue (billion), by End-user Industry 2025 & 2033
- Figure 11: North America Self-Healing Materials Industry Revenue Share (%), by End-user Industry 2025 & 2033
- Figure 12: North America Self-Healing Materials Industry Revenue (billion), by Country 2025 & 2033
- Figure 13: North America Self-Healing Materials Industry Revenue Share (%), by Country 2025 & 2033
- Figure 14: Europe Self-Healing Materials Industry Revenue (billion), by Type 2025 & 2033
- Figure 15: Europe Self-Healing Materials Industry Revenue Share (%), by Type 2025 & 2033
- Figure 16: Europe Self-Healing Materials Industry Revenue (billion), by End-user Industry 2025 & 2033
- Figure 17: Europe Self-Healing Materials Industry Revenue Share (%), by End-user Industry 2025 & 2033
- Figure 18: Europe Self-Healing Materials Industry Revenue (billion), by Country 2025 & 2033
- Figure 19: Europe Self-Healing Materials Industry Revenue Share (%), by Country 2025 & 2033
- Figure 20: South America Self-Healing Materials Industry Revenue (billion), by Type 2025 & 2033
- Figure 21: South America Self-Healing Materials Industry Revenue Share (%), by Type 2025 & 2033
- Figure 22: South America Self-Healing Materials Industry Revenue (billion), by End-user Industry 2025 & 2033
- Figure 23: South America Self-Healing Materials Industry Revenue Share (%), by End-user Industry 2025 & 2033
- Figure 24: South America Self-Healing Materials Industry Revenue (billion), by Country 2025 & 2033
- Figure 25: South America Self-Healing Materials Industry Revenue Share (%), by Country 2025 & 2033
- Figure 26: Middle East and Africa Self-Healing Materials Industry Revenue (billion), by Type 2025 & 2033
- Figure 27: Middle East and Africa Self-Healing Materials Industry Revenue Share (%), by Type 2025 & 2033
- Figure 28: Middle East and Africa Self-Healing Materials Industry Revenue (billion), by End-user Industry 2025 & 2033
- Figure 29: Middle East and Africa Self-Healing Materials Industry Revenue Share (%), by End-user Industry 2025 & 2033
- Figure 30: Middle East and Africa Self-Healing Materials Industry Revenue (billion), by Country 2025 & 2033
- Figure 31: Middle East and Africa Self-Healing Materials Industry Revenue Share (%), by Country 2025 & 2033
List of Tables
- Table 1: Global Self-Healing Materials Industry Revenue billion Forecast, by Type 2020 & 2033
- Table 2: Global Self-Healing Materials Industry Revenue billion Forecast, by End-user Industry 2020 & 2033
- Table 3: Global Self-Healing Materials Industry Revenue billion Forecast, by Region 2020 & 2033
- Table 4: Global Self-Healing Materials Industry Revenue billion Forecast, by Type 2020 & 2033
- Table 5: Global Self-Healing Materials Industry Revenue billion Forecast, by End-user Industry 2020 & 2033
- Table 6: Global Self-Healing Materials Industry Revenue billion Forecast, by Country 2020 & 2033
- Table 7: China Self-Healing Materials Industry Revenue (billion) Forecast, by Application 2020 & 2033
- Table 8: India Self-Healing Materials Industry Revenue (billion) Forecast, by Application 2020 & 2033
- Table 9: Japan Self-Healing Materials Industry Revenue (billion) Forecast, by Application 2020 & 2033
- Table 10: South Korea Self-Healing Materials Industry Revenue (billion) Forecast, by Application 2020 & 2033
- Table 11: ASEAN Countries Self-Healing Materials Industry Revenue (billion) Forecast, by Application 2020 & 2033
- Table 12: Rest of Asia Pacific Self-Healing Materials Industry Revenue (billion) Forecast, by Application 2020 & 2033
- Table 13: Global Self-Healing Materials Industry Revenue billion Forecast, by Type 2020 & 2033
- Table 14: Global Self-Healing Materials Industry Revenue billion Forecast, by End-user Industry 2020 & 2033
- Table 15: Global Self-Healing Materials Industry Revenue billion Forecast, by Country 2020 & 2033
- Table 16: United States Self-Healing Materials Industry Revenue (billion) Forecast, by Application 2020 & 2033
- Table 17: Canada Self-Healing Materials Industry Revenue (billion) Forecast, by Application 2020 & 2033
- Table 18: Mexico Self-Healing Materials Industry Revenue (billion) Forecast, by Application 2020 & 2033
- Table 19: Global Self-Healing Materials Industry Revenue billion Forecast, by Type 2020 & 2033
- Table 20: Global Self-Healing Materials Industry Revenue billion Forecast, by End-user Industry 2020 & 2033
- Table 21: Global Self-Healing Materials Industry Revenue billion Forecast, by Country 2020 & 2033
- Table 22: Germany Self-Healing Materials Industry Revenue (billion) Forecast, by Application 2020 & 2033
- Table 23: United Kingdom Self-Healing Materials Industry Revenue (billion) Forecast, by Application 2020 & 2033
- Table 24: Italy Self-Healing Materials Industry Revenue (billion) Forecast, by Application 2020 & 2033
- Table 25: France Self-Healing Materials Industry Revenue (billion) Forecast, by Application 2020 & 2033
- Table 26: Rest of Europe Self-Healing Materials Industry Revenue (billion) Forecast, by Application 2020 & 2033
- Table 27: Global Self-Healing Materials Industry Revenue billion Forecast, by Type 2020 & 2033
- Table 28: Global Self-Healing Materials Industry Revenue billion Forecast, by End-user Industry 2020 & 2033
- Table 29: Global Self-Healing Materials Industry Revenue billion Forecast, by Country 2020 & 2033
- Table 30: Brazil Self-Healing Materials Industry Revenue (billion) Forecast, by Application 2020 & 2033
- Table 31: Argentina Self-Healing Materials Industry Revenue (billion) Forecast, by Application 2020 & 2033
- Table 32: Rest of South America Self-Healing Materials Industry Revenue (billion) Forecast, by Application 2020 & 2033
- Table 33: Global Self-Healing Materials Industry Revenue billion Forecast, by Type 2020 & 2033
- Table 34: Global Self-Healing Materials Industry Revenue billion Forecast, by End-user Industry 2020 & 2033
- Table 35: Global Self-Healing Materials Industry Revenue billion Forecast, by Country 2020 & 2033
- Table 36: Saudi Arabia Self-Healing Materials Industry Revenue (billion) Forecast, by Application 2020 & 2033
- Table 37: South Africa Self-Healing Materials Industry Revenue (billion) Forecast, by Application 2020 & 2033
- Table 38: Rest of Middle East and Africa Self-Healing Materials Industry Revenue (billion) Forecast, by Application 2020 & 2033
Frequently Asked Questions
1. What is the projected Compound Annual Growth Rate (CAGR) of the Self-Healing Materials Industry?
The projected CAGR is approximately 31.5%.
2. Which companies are prominent players in the Self-Healing Materials Industry?
Key companies in the market include Autonomic Materials Inc, Michelin North America Inc, The Goodyear Tire and Rubber Company*List Not Exhaustive, Bayer AG, NEI Corporation, Evonik Industries AG, MacDermid Autotype Ltd, BASF SE, Acciona S A, Covestro AG, Apple Inc.
3. What are the main segments of the Self-Healing Materials Industry?
The market segments include Type, End-user Industry.
4. Can you provide details about the market size?
The market size is estimated to be USD 109.3 billion as of 2022.
5. What are some drivers contributing to market growth?
Increased Development in the Construction Industry; Growing Use of Self-healing Materials in Biomimetics; Other Drivers.
6. What are the notable trends driving market growth?
Construction Inudstry to Dominate the Market.
7. Are there any restraints impacting market growth?
High Cost of Self-healing Materials; Other Restraints.
8. Can you provide examples of recent developments in the market?
December 2022: Scientists at Riken, Japan, announced that they had created a self-healing polymer using an off-the-shelf compound for the first time. It is reported that the polymer that heals itself is made from readily available building blocks.
9. What pricing options are available for accessing the report?
Pricing options include single-user, multi-user, and enterprise licenses priced at USD 4750, USD 5250, and USD 8750 respectively.
10. Is the market size provided in terms of value or volume?
The market size is provided in terms of value, measured in billion.
11. Are there any specific market keywords associated with the report?
Yes, the market keyword associated with the report is "Self-Healing Materials Industry," which aids in identifying and referencing the specific market segment covered.
12. How do I determine which pricing option suits my needs best?
The pricing options vary based on user requirements and access needs. Individual users may opt for single-user licenses, while businesses requiring broader access may choose multi-user or enterprise licenses for cost-effective access to the report.
13. Are there any additional resources or data provided in the Self-Healing Materials Industry report?
While the report offers comprehensive insights, it's advisable to review the specific contents or supplementary materials provided to ascertain if additional resources or data are available.
14. How can I stay updated on further developments or reports in the Self-Healing Materials Industry?
To stay informed about further developments, trends, and reports in the Self-Healing Materials Industry, consider subscribing to industry newsletters, following relevant companies and organizations, or regularly checking reputable industry news sources and publications.
Methodology
Step 1 - Identification of Relevant Samples Size from Population Database


Step 2 - Approaches for Defining Global Market Size (Value, Volume* & Price*)

Note*: In applicable scenarios
Step 3 - Data Sources
Primary Research
- Web Analytics
- Survey Reports
- Research Institute
- Latest Research Reports
- Opinion Leaders
Secondary Research
- Annual Reports
- White Paper
- Latest Press Release
- Industry Association
- Paid Database
- Investor Presentations

Step 4 - Data Triangulation
Involves using different sources of information in order to increase the validity of a study
These sources are likely to be stakeholders in a program - participants, other researchers, program staff, other community members, and so on.
Then we put all data in single framework & apply various statistical tools to find out the dynamic on the market.
During the analysis stage, feedback from the stakeholder groups would be compared to determine areas of agreement as well as areas of divergence