
Key Insights
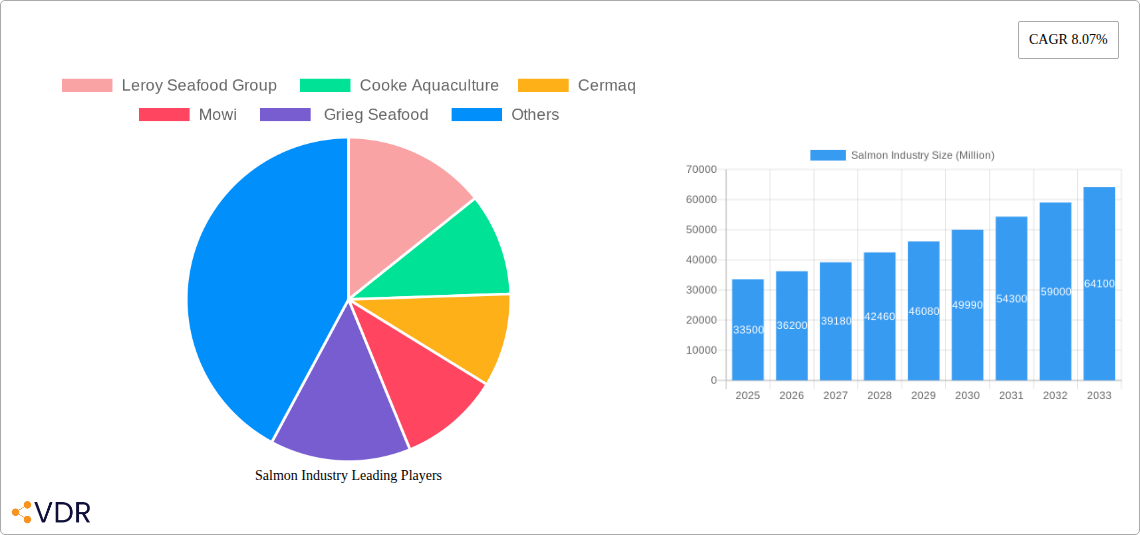
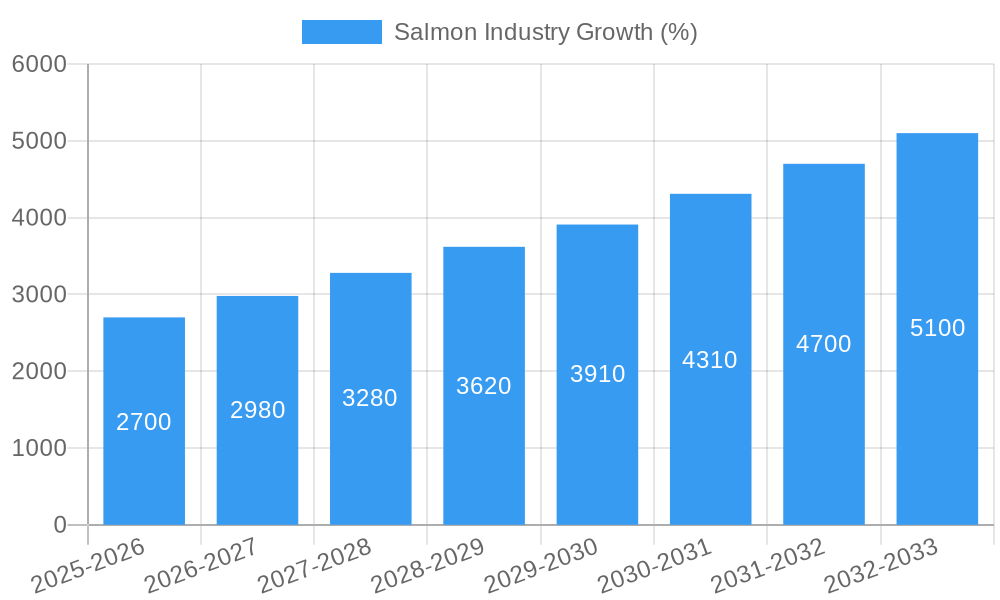
The global salmon industry, valued at $33.5 billion in 2025, is projected to experience robust growth, driven by increasing consumer demand for healthy protein sources and the rising popularity of sushi and other salmon-based dishes. The industry's Compound Annual Growth Rate (CAGR) of 8.07% from 2025 to 2033 indicates a significant expansion of the market, reaching an estimated value exceeding $65 billion by 2033. Key growth drivers include advancements in aquaculture techniques leading to increased production efficiency and sustainability concerns prompting a shift towards responsibly farmed salmon. Further fueling this growth is the rising disposable income in developing economies, broadening the consumer base for this premium protein. Market segmentation reveals that farmed salmon dominates the market share, followed by specific species like Atlantic salmon and Coho salmon. While the industry faces challenges including fluctuating feed costs, disease outbreaks, and regulatory hurdles related to environmental impact, ongoing innovation and a focus on sustainable practices are mitigating these risks. Major players like Leroy Seafood Group, Cooke Aquaculture, Cermaq, Mowi, and Grieg Seafood are strategically investing in research and development, sustainable aquaculture, and global expansion to maintain their market positions.
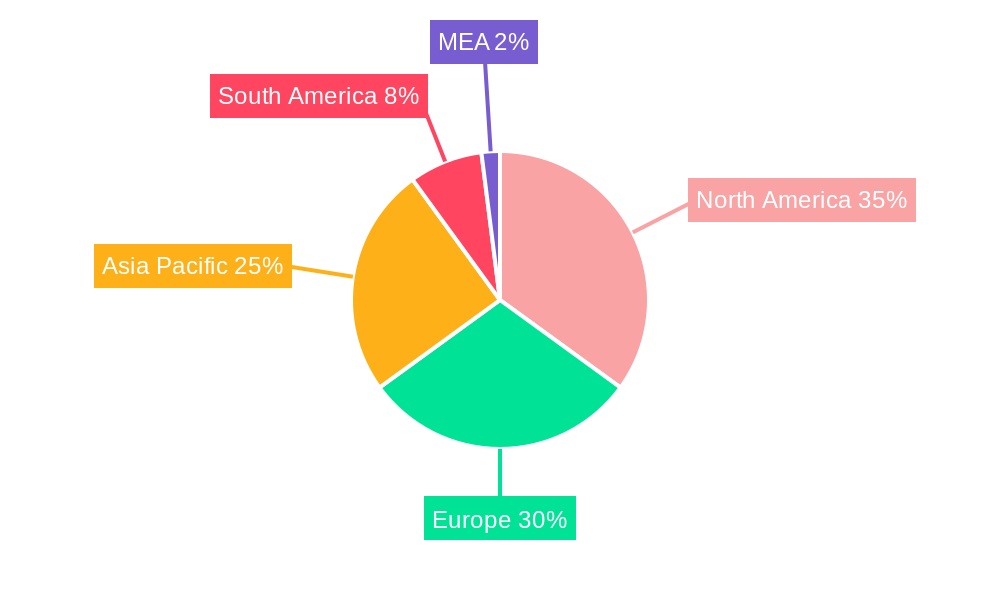
Regional analysis indicates a strong presence across North America, Europe, and the Asia-Pacific region, with North America and Europe holding significant shares, driven by established markets and high per capita consumption. The Asia-Pacific region is expected to witness accelerated growth due to increasing demand from China and Japan. South America, particularly Chile, is a significant producer and exporter, contributing considerably to the global supply chain. The Middle East and Africa represent emerging markets with significant growth potential, largely dependent on economic development and evolving consumer preferences. The continuing focus on product diversification, embracing value-added products, and exploring new markets will remain crucial for industry players seeking long-term success and profitability within this dynamic market landscape. The industry's ongoing commitment to sustainability will also be a key factor in shaping its future trajectory.
Salmon Industry Market Report: 2019-2033
This comprehensive report provides a detailed analysis of the global salmon industry, encompassing market dynamics, growth trends, key players, and future outlook. The study period covers 2019-2033, with 2025 serving as the base and estimated year. The report leverages extensive data analysis to provide valuable insights for industry professionals, investors, and stakeholders. Market values are presented in millions of units.
Salmon Industry Market Dynamics & Structure
The global salmon market, valued at $XX million in 2025, is characterized by a moderately concentrated structure with key players like Mowi, Leroy Seafood Group, Cooke Aquaculture, Cermaq, and Grieg Seafood holding significant market share. Technological innovations, particularly in aquaculture farming techniques (e.g., recirculating aquaculture systems (RAS)), are driving efficiency and sustainability. Stringent regulatory frameworks concerning environmental protection and food safety significantly influence market operations. Competitive pressures from substitute protein sources (e.g., plant-based alternatives) are growing, while consumer demand for sustainably sourced salmon fuels market growth. Mergers and acquisitions (M&A) activity within the sector remains relatively high, indicating a consolidation trend.
- Market Concentration: Mowi holds an estimated xx% market share in 2025, followed by Leroy Seafood Group (xx%), Cooke Aquaculture (xx%), Cermaq (xx%), and Grieg Seafood (xx%). The remaining market share is distributed amongst numerous smaller players.
- Technological Innovation: RAS technology adoption is increasing, enhancing production efficiency and reducing environmental impact. However, high initial investment costs represent a significant barrier to entry for smaller players.
- Regulatory Framework: Stringent regulations related to aquaculture practices, environmental protection, and food safety impact operational costs and market access.
- Competitive Substitutes: Plant-based seafood alternatives and other protein sources pose growing competitive pressure, impacting market demand.
- M&A Activity: The number of M&A deals in the salmon industry averaged xx deals per year during the historical period (2019-2024).
Salmon Industry Growth Trends & Insights
The global salmon market exhibits robust growth, driven by increasing consumer demand fueled by health and wellness trends. The market experienced a CAGR of xx% during the historical period (2019-2024) and is projected to reach $XX million by 2033, exhibiting a CAGR of xx% during the forecast period (2025-2033). This growth is significantly influenced by the increasing adoption of sustainable aquaculture practices, technological advancements in farming techniques and processing, and changing consumer preferences towards healthier protein sources. Market penetration of farmed salmon continues to increase, exceeding xx% globally in 2025. Technological disruptions, particularly automation and data analytics, are improving efficiency across the value chain. Consumer behavior shifts towards premium and sustainably sourced salmon are driving price premiums.
Dominant Regions, Countries, or Segments in Salmon Industry
Norway remains the dominant player in the global salmon market, accounting for the largest share of global salmon production in 2025. The farmed salmon segment constitutes the largest share of the market, driven by increased production efficiency and lower costs compared to wild-caught salmon. Within species types, Atlantic salmon dominates the market, followed by Coho and Chinook salmon.
- Key Drivers for Norway's Dominance: Established aquaculture infrastructure, favorable environmental conditions, government support for the industry, and access to advanced technology.
- Farmed Salmon Segment Dominance: Lower production costs, higher production volume, and consistent supply contribute to the dominance of this segment.
- Atlantic Salmon Dominance: High consumer demand, well-established supply chains, and established farming practices.
Salmon Industry Product Landscape
The salmon product landscape encompasses various forms, including fresh, frozen, processed (e.g., smoked, canned), and value-added products (e.g., ready-to-eat meals). Innovation focuses on enhancing product quality, extending shelf life, and offering convenient and value-added products. Technological advancements in processing and packaging improve product preservation and reduce waste. Unique selling propositions include sustainable sourcing certifications, traceability systems, and high-quality nutritional profiles.
Key Drivers, Barriers & Challenges in Salmon Industry
Key Drivers: Increasing consumer demand for healthy protein sources, growing adoption of sustainable aquaculture practices, technological advancements in farming and processing, and government support for the industry in key producing countries.
Key Challenges: Fluctuations in raw material prices, environmental concerns regarding aquaculture practices, regulatory hurdles, disease outbreaks, and increasing competition from substitute protein sources. Supply chain disruptions can lead to price volatility and reduced market accessibility, impacting profitability significantly (estimated xx% loss during major supply chain disruptions in 2024).
Emerging Opportunities in Salmon Industry
Emerging opportunities lie in expanding into new markets with high growth potential, developing innovative value-added products tailored to specific consumer needs, and utilizing technology to improve efficiency and traceability across the value chain. The growing popularity of functional foods and the demand for sustainably sourced products offer promising avenues for market expansion.
Growth Accelerators in the Salmon Industry
Technological breakthroughs in aquaculture, such as RAS technology and automation, are key growth accelerators. Strategic partnerships across the value chain, from feed producers to retailers, enhance efficiency and market access. Expansion into high-growth markets, particularly in Asia and the Americas, will further propel market growth.
Key Players Shaping the Salmon Industry Market
Notable Milestones in Salmon Industry Sector
- 2020: Increased focus on sustainability certifications across the industry.
- 2022: Significant investments in RAS technology by major players.
- 2023: Launch of several innovative value-added salmon products.
- 2024: Several major M&A deals reshaping the industry landscape.
In-Depth Salmon Industry Market Outlook
The salmon industry is poised for continued growth, driven by factors including increasing consumer demand, technological advancements, and the ongoing focus on sustainability. Strategic opportunities exist in innovation, technological adoption, and global market expansion, leading to a promising outlook for the industry's future potential.
Salmon Industry Segmentation
-
1. Species Type
- 1.1. Atlantic Salmon
- 1.2. Coho Salmon
- 1.3. Masu Salmon
- 1.4. Chinook Salmon
- 1.5. Other Species Types
-
2. Type
- 2.1. Farmed
- 2.2. Wild Captured
-
3. Species Type
- 3.1. Atlantic Salmon
- 3.2. Coho Salmon
- 3.3. Masu Salmon
- 3.4. Chinook Salmon
- 3.5. Other Species Types
-
4. Type
- 4.1. Farmed
- 4.2. Wild Captured
Salmon Industry Segmentation By Geography
-
1. North America
- 1.1. United States
- 1.2. Canada
-
2. Europe
- 2.1. Norway
- 2.2. Spain
- 2.3. Netherlands
- 2.4. France
- 2.5. Italy
- 2.6. Greece
- 2.7. United Kingdom
- 2.8. Scotland
-
3. Asia Pacific
- 3.1. China
- 3.2. Japan
- 3.3. Australia
-
4. South America
- 4.1. Chile
Salmon Industry REPORT HIGHLIGHTS
| Aspects | Details |
|---|---|
| Study Period | 2019-2033 |
| Base Year | 2024 |
| Estimated Year | 2025 |
| Forecast Period | 2025-2033 |
| Historical Period | 2019-2024 |
| Growth Rate | CAGR of 8.07% from 2019-2033 |
| Segmentation |
|
Table of Contents
- 1. Introduction
- 1.1. Research Scope
- 1.2. Market Segmentation
- 1.3. Research Methodology
- 1.4. Definitions and Assumptions
- 2. Executive Summary
- 2.1. Introduction
- 3. Market Dynamics
- 3.1. Introduction
- 3.2. Market Drivers
- 3.2.1. ; Awareness About Health Benefits Associated With Pecan Consumption; Wide Application of Pecan
- 3.3. Market Restrains
- 3.3.1. ; Volatility in the Prices; Adverse Weather Conditions Affecting Yield
- 3.4. Market Trends
- 3.4.1. Healthy Boost in the Salmon Production
- 4. Market Factor Analysis
- 4.1. Porters Five Forces
- 4.2. Supply/Value Chain
- 4.3. PESTEL analysis
- 4.4. Market Entropy
- 4.5. Patent/Trademark Analysis
- 5. Global Salmon Industry Analysis, Insights and Forecast, 2019-2031
- 5.1. Market Analysis, Insights and Forecast - by Species Type
- 5.1.1. Atlantic Salmon
- 5.1.2. Coho Salmon
- 5.1.3. Masu Salmon
- 5.1.4. Chinook Salmon
- 5.1.5. Other Species Types
- 5.2. Market Analysis, Insights and Forecast - by Type
- 5.2.1. Farmed
- 5.2.2. Wild Captured
- 5.3. Market Analysis, Insights and Forecast - by Species Type
- 5.3.1. Atlantic Salmon
- 5.3.2. Coho Salmon
- 5.3.3. Masu Salmon
- 5.3.4. Chinook Salmon
- 5.3.5. Other Species Types
- 5.4. Market Analysis, Insights and Forecast - by Type
- 5.4.1. Farmed
- 5.4.2. Wild Captured
- 5.5. Market Analysis, Insights and Forecast - by Region
- 5.5.1. North America
- 5.5.2. Europe
- 5.5.3. Asia Pacific
- 5.5.4. South America
- 5.1. Market Analysis, Insights and Forecast - by Species Type
- 6. North America Salmon Industry Analysis, Insights and Forecast, 2019-2031
- 6.1. Market Analysis, Insights and Forecast - by Species Type
- 6.1.1. Atlantic Salmon
- 6.1.2. Coho Salmon
- 6.1.3. Masu Salmon
- 6.1.4. Chinook Salmon
- 6.1.5. Other Species Types
- 6.2. Market Analysis, Insights and Forecast - by Type
- 6.2.1. Farmed
- 6.2.2. Wild Captured
- 6.3. Market Analysis, Insights and Forecast - by Species Type
- 6.3.1. Atlantic Salmon
- 6.3.2. Coho Salmon
- 6.3.3. Masu Salmon
- 6.3.4. Chinook Salmon
- 6.3.5. Other Species Types
- 6.4. Market Analysis, Insights and Forecast - by Type
- 6.4.1. Farmed
- 6.4.2. Wild Captured
- 6.1. Market Analysis, Insights and Forecast - by Species Type
- 7. Europe Salmon Industry Analysis, Insights and Forecast, 2019-2031
- 7.1. Market Analysis, Insights and Forecast - by Species Type
- 7.1.1. Atlantic Salmon
- 7.1.2. Coho Salmon
- 7.1.3. Masu Salmon
- 7.1.4. Chinook Salmon
- 7.1.5. Other Species Types
- 7.2. Market Analysis, Insights and Forecast - by Type
- 7.2.1. Farmed
- 7.2.2. Wild Captured
- 7.3. Market Analysis, Insights and Forecast - by Species Type
- 7.3.1. Atlantic Salmon
- 7.3.2. Coho Salmon
- 7.3.3. Masu Salmon
- 7.3.4. Chinook Salmon
- 7.3.5. Other Species Types
- 7.4. Market Analysis, Insights and Forecast - by Type
- 7.4.1. Farmed
- 7.4.2. Wild Captured
- 7.1. Market Analysis, Insights and Forecast - by Species Type
- 8. Asia Pacific Salmon Industry Analysis, Insights and Forecast, 2019-2031
- 8.1. Market Analysis, Insights and Forecast - by Species Type
- 8.1.1. Atlantic Salmon
- 8.1.2. Coho Salmon
- 8.1.3. Masu Salmon
- 8.1.4. Chinook Salmon
- 8.1.5. Other Species Types
- 8.2. Market Analysis, Insights and Forecast - by Type
- 8.2.1. Farmed
- 8.2.2. Wild Captured
- 8.3. Market Analysis, Insights and Forecast - by Species Type
- 8.3.1. Atlantic Salmon
- 8.3.2. Coho Salmon
- 8.3.3. Masu Salmon
- 8.3.4. Chinook Salmon
- 8.3.5. Other Species Types
- 8.4. Market Analysis, Insights and Forecast - by Type
- 8.4.1. Farmed
- 8.4.2. Wild Captured
- 8.1. Market Analysis, Insights and Forecast - by Species Type
- 9. South America Salmon Industry Analysis, Insights and Forecast, 2019-2031
- 9.1. Market Analysis, Insights and Forecast - by Species Type
- 9.1.1. Atlantic Salmon
- 9.1.2. Coho Salmon
- 9.1.3. Masu Salmon
- 9.1.4. Chinook Salmon
- 9.1.5. Other Species Types
- 9.2. Market Analysis, Insights and Forecast - by Type
- 9.2.1. Farmed
- 9.2.2. Wild Captured
- 9.3. Market Analysis, Insights and Forecast - by Species Type
- 9.3.1. Atlantic Salmon
- 9.3.2. Coho Salmon
- 9.3.3. Masu Salmon
- 9.3.4. Chinook Salmon
- 9.3.5. Other Species Types
- 9.4. Market Analysis, Insights and Forecast - by Type
- 9.4.1. Farmed
- 9.4.2. Wild Captured
- 9.1. Market Analysis, Insights and Forecast - by Species Type
- 10. North America Salmon Industry Analysis, Insights and Forecast, 2019-2031
- 10.1. Market Analysis, Insights and Forecast - By Country/Sub-region
- 10.1.1 United States
- 10.1.2 Canada
- 11. Europe Salmon Industry Analysis, Insights and Forecast, 2019-2031
- 11.1. Market Analysis, Insights and Forecast - By Country/Sub-region
- 11.1.1 Norway
- 11.1.2 Spain
- 11.1.3 Netherlands
- 11.1.4 France
- 11.1.5 Italy
- 11.1.6 Greece
- 11.1.7 United Kingdom
- 11.1.8 Scotland
- 12. Asia Pacific Salmon Industry Analysis, Insights and Forecast, 2019-2031
- 12.1. Market Analysis, Insights and Forecast - By Country/Sub-region
- 12.1.1 China
- 12.1.2 Japan
- 12.1.3 Australia
- 13. South America Salmon Industry Analysis, Insights and Forecast, 2019-2031
- 13.1. Market Analysis, Insights and Forecast - By Country/Sub-region
- 13.1.1. Chile
- 14. MEA Salmon Industry Analysis, Insights and Forecast, 2019-2031
- 14.1. Market Analysis, Insights and Forecast - By Country/Sub-region
- 14.1.1 Middle East
- 14.1.2 Africa
- 15. Competitive Analysis
- 15.1. Global Market Share Analysis 2024
- 15.2. Company Profiles
- 15.2.1 Leroy Seafood Group
- 15.2.1.1. Overview
- 15.2.1.2. Products
- 15.2.1.3. SWOT Analysis
- 15.2.1.4. Recent Developments
- 15.2.1.5. Financials (Based on Availability)
- 15.2.2 Cooke Aquaculture
- 15.2.2.1. Overview
- 15.2.2.2. Products
- 15.2.2.3. SWOT Analysis
- 15.2.2.4. Recent Developments
- 15.2.2.5. Financials (Based on Availability)
- 15.2.3 Cermaq
- 15.2.3.1. Overview
- 15.2.3.2. Products
- 15.2.3.3. SWOT Analysis
- 15.2.3.4. Recent Developments
- 15.2.3.5. Financials (Based on Availability)
- 15.2.4 Mowi
- 15.2.4.1. Overview
- 15.2.4.2. Products
- 15.2.4.3. SWOT Analysis
- 15.2.4.4. Recent Developments
- 15.2.4.5. Financials (Based on Availability)
- 15.2.5 Grieg Seafood
- 15.2.5.1. Overview
- 15.2.5.2. Products
- 15.2.5.3. SWOT Analysis
- 15.2.5.4. Recent Developments
- 15.2.5.5. Financials (Based on Availability)
- 15.2.1 Leroy Seafood Group
List of Figures
- Figure 1: Global Salmon Industry Revenue Breakdown (Million, %) by Region 2024 & 2032
- Figure 2: North America Salmon Industry Revenue (Million), by Country 2024 & 2032
- Figure 3: North America Salmon Industry Revenue Share (%), by Country 2024 & 2032
- Figure 4: Europe Salmon Industry Revenue (Million), by Country 2024 & 2032
- Figure 5: Europe Salmon Industry Revenue Share (%), by Country 2024 & 2032
- Figure 6: Asia Pacific Salmon Industry Revenue (Million), by Country 2024 & 2032
- Figure 7: Asia Pacific Salmon Industry Revenue Share (%), by Country 2024 & 2032
- Figure 8: South America Salmon Industry Revenue (Million), by Country 2024 & 2032
- Figure 9: South America Salmon Industry Revenue Share (%), by Country 2024 & 2032
- Figure 10: MEA Salmon Industry Revenue (Million), by Country 2024 & 2032
- Figure 11: MEA Salmon Industry Revenue Share (%), by Country 2024 & 2032
- Figure 12: North America Salmon Industry Revenue (Million), by Species Type 2024 & 2032
- Figure 13: North America Salmon Industry Revenue Share (%), by Species Type 2024 & 2032
- Figure 14: North America Salmon Industry Revenue (Million), by Type 2024 & 2032
- Figure 15: North America Salmon Industry Revenue Share (%), by Type 2024 & 2032
- Figure 16: North America Salmon Industry Revenue (Million), by Species Type 2024 & 2032
- Figure 17: North America Salmon Industry Revenue Share (%), by Species Type 2024 & 2032
- Figure 18: North America Salmon Industry Revenue (Million), by Type 2024 & 2032
- Figure 19: North America Salmon Industry Revenue Share (%), by Type 2024 & 2032
- Figure 20: North America Salmon Industry Revenue (Million), by Country 2024 & 2032
- Figure 21: North America Salmon Industry Revenue Share (%), by Country 2024 & 2032
- Figure 22: Europe Salmon Industry Revenue (Million), by Species Type 2024 & 2032
- Figure 23: Europe Salmon Industry Revenue Share (%), by Species Type 2024 & 2032
- Figure 24: Europe Salmon Industry Revenue (Million), by Type 2024 & 2032
- Figure 25: Europe Salmon Industry Revenue Share (%), by Type 2024 & 2032
- Figure 26: Europe Salmon Industry Revenue (Million), by Species Type 2024 & 2032
- Figure 27: Europe Salmon Industry Revenue Share (%), by Species Type 2024 & 2032
- Figure 28: Europe Salmon Industry Revenue (Million), by Type 2024 & 2032
- Figure 29: Europe Salmon Industry Revenue Share (%), by Type 2024 & 2032
- Figure 30: Europe Salmon Industry Revenue (Million), by Country 2024 & 2032
- Figure 31: Europe Salmon Industry Revenue Share (%), by Country 2024 & 2032
- Figure 32: Asia Pacific Salmon Industry Revenue (Million), by Species Type 2024 & 2032
- Figure 33: Asia Pacific Salmon Industry Revenue Share (%), by Species Type 2024 & 2032
- Figure 34: Asia Pacific Salmon Industry Revenue (Million), by Type 2024 & 2032
- Figure 35: Asia Pacific Salmon Industry Revenue Share (%), by Type 2024 & 2032
- Figure 36: Asia Pacific Salmon Industry Revenue (Million), by Species Type 2024 & 2032
- Figure 37: Asia Pacific Salmon Industry Revenue Share (%), by Species Type 2024 & 2032
- Figure 38: Asia Pacific Salmon Industry Revenue (Million), by Type 2024 & 2032
- Figure 39: Asia Pacific Salmon Industry Revenue Share (%), by Type 2024 & 2032
- Figure 40: Asia Pacific Salmon Industry Revenue (Million), by Country 2024 & 2032
- Figure 41: Asia Pacific Salmon Industry Revenue Share (%), by Country 2024 & 2032
- Figure 42: South America Salmon Industry Revenue (Million), by Species Type 2024 & 2032
- Figure 43: South America Salmon Industry Revenue Share (%), by Species Type 2024 & 2032
- Figure 44: South America Salmon Industry Revenue (Million), by Type 2024 & 2032
- Figure 45: South America Salmon Industry Revenue Share (%), by Type 2024 & 2032
- Figure 46: South America Salmon Industry Revenue (Million), by Species Type 2024 & 2032
- Figure 47: South America Salmon Industry Revenue Share (%), by Species Type 2024 & 2032
- Figure 48: South America Salmon Industry Revenue (Million), by Type 2024 & 2032
- Figure 49: South America Salmon Industry Revenue Share (%), by Type 2024 & 2032
- Figure 50: South America Salmon Industry Revenue (Million), by Country 2024 & 2032
- Figure 51: South America Salmon Industry Revenue Share (%), by Country 2024 & 2032
List of Tables
- Table 1: Global Salmon Industry Revenue Million Forecast, by Region 2019 & 2032
- Table 2: Global Salmon Industry Revenue Million Forecast, by Species Type 2019 & 2032
- Table 3: Global Salmon Industry Revenue Million Forecast, by Type 2019 & 2032
- Table 4: Global Salmon Industry Revenue Million Forecast, by Species Type 2019 & 2032
- Table 5: Global Salmon Industry Revenue Million Forecast, by Type 2019 & 2032
- Table 6: Global Salmon Industry Revenue Million Forecast, by Region 2019 & 2032
- Table 7: Global Salmon Industry Revenue Million Forecast, by Country 2019 & 2032
- Table 8: United States Salmon Industry Revenue (Million) Forecast, by Application 2019 & 2032
- Table 9: Canada Salmon Industry Revenue (Million) Forecast, by Application 2019 & 2032
- Table 10: Global Salmon Industry Revenue Million Forecast, by Country 2019 & 2032
- Table 11: Norway Salmon Industry Revenue (Million) Forecast, by Application 2019 & 2032
- Table 12: Spain Salmon Industry Revenue (Million) Forecast, by Application 2019 & 2032
- Table 13: Netherlands Salmon Industry Revenue (Million) Forecast, by Application 2019 & 2032
- Table 14: France Salmon Industry Revenue (Million) Forecast, by Application 2019 & 2032
- Table 15: Italy Salmon Industry Revenue (Million) Forecast, by Application 2019 & 2032
- Table 16: Greece Salmon Industry Revenue (Million) Forecast, by Application 2019 & 2032
- Table 17: United Kingdom Salmon Industry Revenue (Million) Forecast, by Application 2019 & 2032
- Table 18: Scotland Salmon Industry Revenue (Million) Forecast, by Application 2019 & 2032
- Table 19: Global Salmon Industry Revenue Million Forecast, by Country 2019 & 2032
- Table 20: China Salmon Industry Revenue (Million) Forecast, by Application 2019 & 2032
- Table 21: Japan Salmon Industry Revenue (Million) Forecast, by Application 2019 & 2032
- Table 22: Australia Salmon Industry Revenue (Million) Forecast, by Application 2019 & 2032
- Table 23: Global Salmon Industry Revenue Million Forecast, by Country 2019 & 2032
- Table 24: Chile Salmon Industry Revenue (Million) Forecast, by Application 2019 & 2032
- Table 25: Global Salmon Industry Revenue Million Forecast, by Country 2019 & 2032
- Table 26: Middle East Salmon Industry Revenue (Million) Forecast, by Application 2019 & 2032
- Table 27: Africa Salmon Industry Revenue (Million) Forecast, by Application 2019 & 2032
- Table 28: Global Salmon Industry Revenue Million Forecast, by Species Type 2019 & 2032
- Table 29: Global Salmon Industry Revenue Million Forecast, by Type 2019 & 2032
- Table 30: Global Salmon Industry Revenue Million Forecast, by Species Type 2019 & 2032
- Table 31: Global Salmon Industry Revenue Million Forecast, by Type 2019 & 2032
- Table 32: Global Salmon Industry Revenue Million Forecast, by Country 2019 & 2032
- Table 33: United States Salmon Industry Revenue (Million) Forecast, by Application 2019 & 2032
- Table 34: Canada Salmon Industry Revenue (Million) Forecast, by Application 2019 & 2032
- Table 35: Global Salmon Industry Revenue Million Forecast, by Species Type 2019 & 2032
- Table 36: Global Salmon Industry Revenue Million Forecast, by Type 2019 & 2032
- Table 37: Global Salmon Industry Revenue Million Forecast, by Species Type 2019 & 2032
- Table 38: Global Salmon Industry Revenue Million Forecast, by Type 2019 & 2032
- Table 39: Global Salmon Industry Revenue Million Forecast, by Country 2019 & 2032
- Table 40: Norway Salmon Industry Revenue (Million) Forecast, by Application 2019 & 2032
- Table 41: Spain Salmon Industry Revenue (Million) Forecast, by Application 2019 & 2032
- Table 42: Netherlands Salmon Industry Revenue (Million) Forecast, by Application 2019 & 2032
- Table 43: France Salmon Industry Revenue (Million) Forecast, by Application 2019 & 2032
- Table 44: Italy Salmon Industry Revenue (Million) Forecast, by Application 2019 & 2032
- Table 45: Greece Salmon Industry Revenue (Million) Forecast, by Application 2019 & 2032
- Table 46: United Kingdom Salmon Industry Revenue (Million) Forecast, by Application 2019 & 2032
- Table 47: Scotland Salmon Industry Revenue (Million) Forecast, by Application 2019 & 2032
- Table 48: Global Salmon Industry Revenue Million Forecast, by Species Type 2019 & 2032
- Table 49: Global Salmon Industry Revenue Million Forecast, by Type 2019 & 2032
- Table 50: Global Salmon Industry Revenue Million Forecast, by Species Type 2019 & 2032
- Table 51: Global Salmon Industry Revenue Million Forecast, by Type 2019 & 2032
- Table 52: Global Salmon Industry Revenue Million Forecast, by Country 2019 & 2032
- Table 53: China Salmon Industry Revenue (Million) Forecast, by Application 2019 & 2032
- Table 54: Japan Salmon Industry Revenue (Million) Forecast, by Application 2019 & 2032
- Table 55: Australia Salmon Industry Revenue (Million) Forecast, by Application 2019 & 2032
- Table 56: Global Salmon Industry Revenue Million Forecast, by Species Type 2019 & 2032
- Table 57: Global Salmon Industry Revenue Million Forecast, by Type 2019 & 2032
- Table 58: Global Salmon Industry Revenue Million Forecast, by Species Type 2019 & 2032
- Table 59: Global Salmon Industry Revenue Million Forecast, by Type 2019 & 2032
- Table 60: Global Salmon Industry Revenue Million Forecast, by Country 2019 & 2032
- Table 61: Chile Salmon Industry Revenue (Million) Forecast, by Application 2019 & 2032
Frequently Asked Questions
1. What is the projected Compound Annual Growth Rate (CAGR) of the Salmon Industry?
The projected CAGR is approximately 8.07%.
2. Which companies are prominent players in the Salmon Industry?
Key companies in the market include Leroy Seafood Group , Cooke Aquaculture , Cermaq, Mowi , Grieg Seafood .
3. What are the main segments of the Salmon Industry?
The market segments include Species Type, Type, Species Type, Type.
4. Can you provide details about the market size?
The market size is estimated to be USD 33.50 Million as of 2022.
5. What are some drivers contributing to market growth?
; Awareness About Health Benefits Associated With Pecan Consumption; Wide Application of Pecan.
6. What are the notable trends driving market growth?
Healthy Boost in the Salmon Production.
7. Are there any restraints impacting market growth?
; Volatility in the Prices; Adverse Weather Conditions Affecting Yield.
8. Can you provide examples of recent developments in the market?
N/A
9. What pricing options are available for accessing the report?
Pricing options include single-user, multi-user, and enterprise licenses priced at USD 4750, USD 5250, and USD 8750 respectively.
10. Is the market size provided in terms of value or volume?
The market size is provided in terms of value, measured in Million.
11. Are there any specific market keywords associated with the report?
Yes, the market keyword associated with the report is "Salmon Industry," which aids in identifying and referencing the specific market segment covered.
12. How do I determine which pricing option suits my needs best?
The pricing options vary based on user requirements and access needs. Individual users may opt for single-user licenses, while businesses requiring broader access may choose multi-user or enterprise licenses for cost-effective access to the report.
13. Are there any additional resources or data provided in the Salmon Industry report?
While the report offers comprehensive insights, it's advisable to review the specific contents or supplementary materials provided to ascertain if additional resources or data are available.
14. How can I stay updated on further developments or reports in the Salmon Industry?
To stay informed about further developments, trends, and reports in the Salmon Industry, consider subscribing to industry newsletters, following relevant companies and organizations, or regularly checking reputable industry news sources and publications.
Methodology
Step 1 - Identification of Relevant Samples Size from Population Database


Step 2 - Approaches for Defining Global Market Size (Value, Volume* & Price*)

Note*: In applicable scenarios
Step 3 - Data Sources
Primary Research
- Web Analytics
- Survey Reports
- Research Institute
- Latest Research Reports
- Opinion Leaders
Secondary Research
- Annual Reports
- White Paper
- Latest Press Release
- Industry Association
- Paid Database
- Investor Presentations

Step 4 - Data Triangulation
Involves using different sources of information in order to increase the validity of a study
These sources are likely to be stakeholders in a program - participants, other researchers, program staff, other community members, and so on.
Then we put all data in single framework & apply various statistical tools to find out the dynamic on the market.
During the analysis stage, feedback from the stakeholder groups would be compared to determine areas of agreement as well as areas of divergence


