
Key Insights
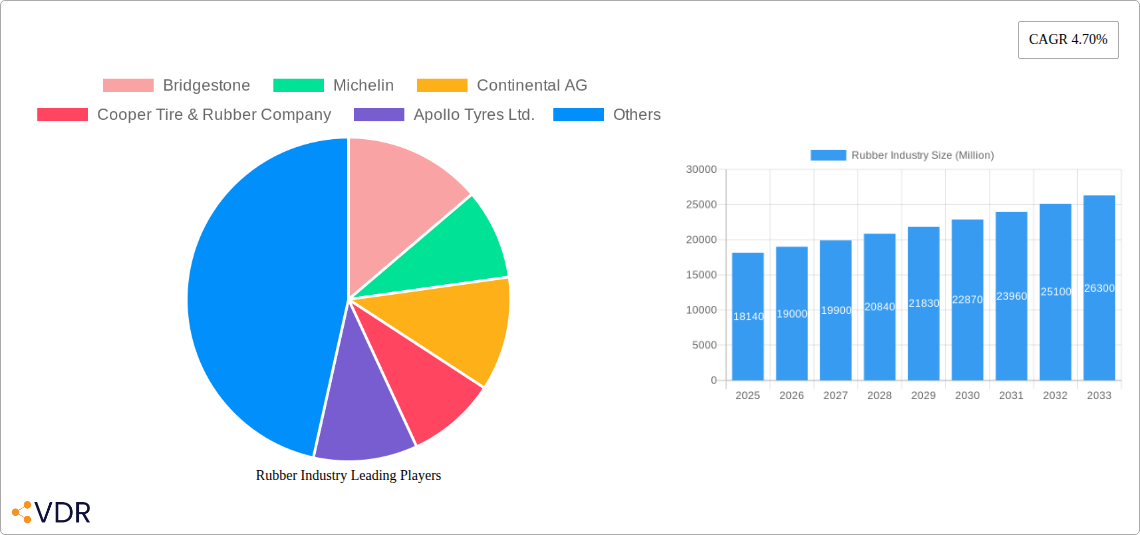
The global rubber industry, valued at $18.14 billion in 2025, is projected to experience robust growth, driven by a compound annual growth rate (CAGR) of 4.70% from 2025 to 2033. This expansion is fueled by several key factors. The automotive sector, a major consumer of rubber for tires and other components, is experiencing continuous growth, particularly in emerging economies. Increasing industrial automation and the rising demand for durable goods are also boosting the demand for rubber across various applications. Furthermore, advancements in rubber technology, leading to the development of high-performance, specialized rubbers for medical and consumer goods, are contributing to market expansion. While challenges such as fluctuating raw material prices and environmental concerns related to synthetic rubber production exist, innovation in sustainable rubber sourcing and manufacturing processes is mitigating these risks. The market segmentation reveals significant opportunities within specialized rubber products for niche applications, indicating a shift towards higher value-added segments. Strong regional growth is anticipated across Asia-Pacific, driven by increasing automotive production and infrastructure development in countries like China and India. North America and Europe will also maintain a significant market share, propelled by consistent demand from established industries and technological advancements.
The competitive landscape is dominated by major global players like Bridgestone, Michelin, and Goodyear, who continuously invest in research and development to maintain market leadership. However, the presence of several regional players provides opportunities for market diversification and specialization. The distribution channels are diverse, encompassing direct sales, distributors, and retail outlets, reflecting the varied needs of different customer segments. The forecast period (2025-2033) holds promising prospects for the industry, with continued growth fueled by the factors mentioned above. However, companies must focus on strategic partnerships, sustainable practices, and product diversification to navigate the evolving market dynamics and secure sustained growth.
Rubber Industry Market Report: 2019-2033
This comprehensive report provides a detailed analysis of the global rubber industry, encompassing market dynamics, growth trends, regional performance, and competitive landscapes. The study period covers 2019-2033, with 2025 as the base and estimated year. This in-depth analysis will equip industry professionals with actionable insights to navigate the evolving rubber market and capitalize on emerging opportunities. The report segments the market by product type (Natural Rubber, Synthetic Rubber, Specialty Rubber, Rubber Compounds), application (Automotive, Industrial, Medical, Consumer Goods), distribution channel (Direct Sales, Distributors, Retail), and end-user (Automotive Industry, Manufacturing, Healthcare, Construction, Consumer). Key players analyzed include Bridgestone, Michelin, Continental AG, Cooper Tire & Rubber Company, Apollo Tyres Ltd., Kumho Tire Co., Inc., The Goodyear Tire & Rubber Company, Pirelli & C. S.p.A., Sumitomo Rubber Industries, Ltd., and Hankook Tire & Technology.
Rubber Industry Market Dynamics & Structure
The global rubber industry is characterized by a moderately concentrated market structure, with a few dominant players holding significant market share. Market concentration is expected to remain relatively stable throughout the forecast period (2025-2033), although M&A activity could shift the landscape. Technological innovation, particularly in material science and manufacturing processes, is a key driver of growth. Stringent environmental regulations and increasing demand for sustainable rubber products are shaping industry practices. Competitive substitutes, such as plastics and other advanced materials, pose a constant challenge. The end-user demographics are evolving, with a rising demand from emerging economies and developing industries.
- Market Concentration: Top 5 players hold approximately xx% of the global market share in 2025.
- M&A Activity: An estimated xx number of significant M&A deals occurred between 2019 and 2024, valued at approximately $xx million.
- Technological Innovation: Focus on developing high-performance, sustainable, and cost-effective rubber compounds.
- Regulatory Framework: Compliance with environmental regulations and safety standards is a major operational cost.
- Competitive Substitutes: Increased competition from alternative materials is impacting growth in specific segments.
Rubber Industry Growth Trends & Insights
The global rubber industry experienced a CAGR of xx% during the historical period (2019-2024), driven primarily by robust demand from the automotive and industrial sectors. The market size is projected to reach xx million units by 2025 and xx million units by 2033, exhibiting a CAGR of xx% during the forecast period (2025-2033). This growth is fueled by increasing vehicle production, rising infrastructure spending in developing nations, and the growing adoption of rubber in diverse applications across various end-user industries. Technological disruptions, such as the development of advanced rubber compounds with improved properties, and shifts in consumer preferences towards sustainable and eco-friendly products are also influencing market dynamics. Adoption rates of specialty rubbers are expected to increase significantly due to their performance advantages in niche applications.

Dominant Regions, Countries, or Segments in Rubber Industry
Asia Pacific is projected to be the dominant region in the global rubber market during the forecast period, holding the largest market share. This dominance is attributable to the region's substantial automotive manufacturing base, rapid industrialization, and robust infrastructure development. Within Asia Pacific, China and India are anticipated to be the key growth drivers. In terms of product type, synthetic rubber holds the largest market share, driven by its versatility and cost-effectiveness. The automotive application segment is the largest end-user, followed by the industrial segment.
- Key Drivers in Asia Pacific: Rapid economic growth, expanding automotive industry, increasing infrastructure projects.
- Dominant Product Type: Synthetic rubber due to its cost-effectiveness and versatility.
- Leading Application Segment: Automotive industry due to its high demand for tires and other rubber components.
- Growth Potential: High growth potential in developing economies due to increased industrialization and infrastructure development.
Rubber Industry Product Landscape
The rubber industry exhibits a diverse product landscape, encompassing a wide range of natural and synthetic rubbers, specialty rubber compounds, and various rubber-based products. Recent innovations include the development of high-performance rubbers with enhanced durability, resilience, and resistance to environmental factors. The focus on sustainability is driving the development of bio-based and recycled rubber products. These advancements cater to the growing demands of diverse applications across various end-user industries. Unique selling propositions revolve around improved performance characteristics, sustainability, and cost-effectiveness.
Key Drivers, Barriers & Challenges in Rubber Industry
Key Drivers:
- Strong growth in the automotive and industrial sectors.
- Increasing demand for high-performance rubber compounds.
- Rise in infrastructure development projects globally.
- Growing adoption of rubber in various consumer goods.
Challenges:
- Fluctuations in raw material prices.
- Stringent environmental regulations.
- Intense competition from alternative materials.
- Supply chain disruptions.
The combined impact of these challenges and drivers is influencing market growth trends.
Emerging Opportunities in Rubber Industry
Emerging opportunities lie in the development and adoption of sustainable rubber products, expansion into untapped markets in developing economies, and innovation in advanced rubber compounds for niche applications (e.g., medical devices, aerospace). Furthermore, the rising demand for high-performance tires and components in the electric vehicle (EV) market presents significant opportunities for growth.
Growth Accelerators in the Rubber Industry Industry
Technological advancements in material science, process optimization, and manufacturing efficiency are key growth accelerators. Strategic partnerships and collaborations between raw material suppliers, rubber compound manufacturers, and end-users are fostering innovation and expanding market reach. Market expansion into emerging economies through strategic investments and partnerships offers lucrative growth potential.
Key Players Shaping the Rubber Industry Market
- Bridgestone
- Michelin
- Continental AG
- Cooper Tire & Rubber Company
- Apollo Tyres Ltd.
- Kumho Tire Co., Inc.
- The Goodyear Tire & Rubber Company
- Pirelli & C. S.p.A.
- Sumitomo Rubber Industries, Ltd.
- Hankook Tire & Technology
Notable Milestones in Rubber Industry Sector
- 2020: Introduction of a new bio-based rubber compound by xx company.
- 2021: Merger between xx and xx companies.
- 2022: Launch of a new high-performance tire by xx company.
- 2023: Significant investment in sustainable rubber production by xx company.
- 2024: New regulations on tire manufacturing imposed in xx region.
In-Depth Rubber Industry Market Outlook
The global rubber industry is poised for sustained growth over the next decade, driven by technological innovation, strategic partnerships, and expanding market opportunities in emerging economies. The industry's focus on sustainability and the development of eco-friendly products will further enhance its long-term growth potential. Strategic investments in research and development, coupled with effective market expansion strategies, will be crucial for companies to maintain a competitive edge in this dynamic market.
Rubber Industry Segmentation
- 1. Production Analysis
- 2. Consumption Analysis
- 3. Import Market Analysis (Value & Volume)
- 4. Export Market Analysis (Value & Volume)
- 5. Price Trend Analysis
Rubber Industry Segmentation By Geography
-
1. North America
- 1.1. United States
- 1.2. Mexico
-
2. Europe
- 2.1. Germany
- 2.2. France
- 2.3. Italy
- 2.4. Turkey
-
3. Asia Pacific
- 3.1. China
- 3.2. Malaysia
- 3.3. Thailand
- 3.4. Japan
- 3.5. India
- 3.6. Indonesia
-
4. South America
- 4.1. Brazil
- 4.2. Chile
-
5. Africa
- 5.1. South Africa

Rubber Industry REPORT HIGHLIGHTS
| Aspects | Details |
|---|---|
| Study Period | 2019-2033 |
| Base Year | 2024 |
| Estimated Year | 2025 |
| Forecast Period | 2025-2033 |
| Historical Period | 2019-2024 |
| Growth Rate | CAGR of 4.70% from 2019-2033 |
| Segmentation |
|
Table of Contents
- 1. Introduction
- 1.1. Research Scope
- 1.2. Market Segmentation
- 1.3. Research Methodology
- 1.4. Definitions and Assumptions
- 2. Executive Summary
- 2.1. Introduction
- 3. Market Dynamics
- 3.1. Introduction
- 3.2. Market Drivers
- 3.2.1. Increasing Berry Consumption for Health Benefits; Increasing Adoption of High-Technology Farm Practices; Growing Usage of Berries in the Food and Beverage Industries
- 3.3. Market Restrains
- 3.3.1. High Production Cost Involved in Berry Production; Increasing Disease and Pest Infestations
- 3.4. Market Trends
- 3.4.1. Increasing demand from Various Industries
- 4. Market Factor Analysis
- 4.1. Porters Five Forces
- 4.2. Supply/Value Chain
- 4.3. PESTEL analysis
- 4.4. Market Entropy
- 4.5. Patent/Trademark Analysis
- 5. Global Rubber Industry Analysis, Insights and Forecast, 2019-2031
- 5.1. Market Analysis, Insights and Forecast - by Production Analysis
- 5.2. Market Analysis, Insights and Forecast - by Consumption Analysis
- 5.3. Market Analysis, Insights and Forecast - by Import Market Analysis (Value & Volume)
- 5.4. Market Analysis, Insights and Forecast - by Export Market Analysis (Value & Volume)
- 5.5. Market Analysis, Insights and Forecast - by Price Trend Analysis
- 5.6. Market Analysis, Insights and Forecast - by Region
- 5.6.1. North America
- 5.6.2. Europe
- 5.6.3. Asia Pacific
- 5.6.4. South America
- 5.6.5. Africa
- 5.1. Market Analysis, Insights and Forecast - by Production Analysis
- 6. North America Rubber Industry Analysis, Insights and Forecast, 2019-2031
- 6.1. Market Analysis, Insights and Forecast - by Production Analysis
- 6.2. Market Analysis, Insights and Forecast - by Consumption Analysis
- 6.3. Market Analysis, Insights and Forecast - by Import Market Analysis (Value & Volume)
- 6.4. Market Analysis, Insights and Forecast - by Export Market Analysis (Value & Volume)
- 6.5. Market Analysis, Insights and Forecast - by Price Trend Analysis
- 6.1. Market Analysis, Insights and Forecast - by Production Analysis
- 7. Europe Rubber Industry Analysis, Insights and Forecast, 2019-2031
- 7.1. Market Analysis, Insights and Forecast - by Production Analysis
- 7.2. Market Analysis, Insights and Forecast - by Consumption Analysis
- 7.3. Market Analysis, Insights and Forecast - by Import Market Analysis (Value & Volume)
- 7.4. Market Analysis, Insights and Forecast - by Export Market Analysis (Value & Volume)
- 7.5. Market Analysis, Insights and Forecast - by Price Trend Analysis
- 7.1. Market Analysis, Insights and Forecast - by Production Analysis
- 8. Asia Pacific Rubber Industry Analysis, Insights and Forecast, 2019-2031
- 8.1. Market Analysis, Insights and Forecast - by Production Analysis
- 8.2. Market Analysis, Insights and Forecast - by Consumption Analysis
- 8.3. Market Analysis, Insights and Forecast - by Import Market Analysis (Value & Volume)
- 8.4. Market Analysis, Insights and Forecast - by Export Market Analysis (Value & Volume)
- 8.5. Market Analysis, Insights and Forecast - by Price Trend Analysis
- 8.1. Market Analysis, Insights and Forecast - by Production Analysis
- 9. South America Rubber Industry Analysis, Insights and Forecast, 2019-2031
- 9.1. Market Analysis, Insights and Forecast - by Production Analysis
- 9.2. Market Analysis, Insights and Forecast - by Consumption Analysis
- 9.3. Market Analysis, Insights and Forecast - by Import Market Analysis (Value & Volume)
- 9.4. Market Analysis, Insights and Forecast - by Export Market Analysis (Value & Volume)
- 9.5. Market Analysis, Insights and Forecast - by Price Trend Analysis
- 9.1. Market Analysis, Insights and Forecast - by Production Analysis
- 10. Africa Rubber Industry Analysis, Insights and Forecast, 2019-2031
- 10.1. Market Analysis, Insights and Forecast - by Production Analysis
- 10.2. Market Analysis, Insights and Forecast - by Consumption Analysis
- 10.3. Market Analysis, Insights and Forecast - by Import Market Analysis (Value & Volume)
- 10.4. Market Analysis, Insights and Forecast - by Export Market Analysis (Value & Volume)
- 10.5. Market Analysis, Insights and Forecast - by Price Trend Analysis
- 10.1. Market Analysis, Insights and Forecast - by Production Analysis
- 11. North America Rubber Industry Analysis, Insights and Forecast, 2019-2031
- 11.1. Market Analysis, Insights and Forecast - By Country/Sub-region
- 11.1.1 United States
- 11.1.2 Canada
- 11.1.3 Mexico
- 12. Europe Rubber Industry Analysis, Insights and Forecast, 2019-2031
- 12.1. Market Analysis, Insights and Forecast - By Country/Sub-region
- 12.1.1 Germany
- 12.1.2 United Kingdom
- 12.1.3 France
- 12.1.4 Spain
- 12.1.5 Italy
- 12.1.6 Spain
- 12.1.7 Belgium
- 12.1.8 Netherland
- 12.1.9 Nordics
- 12.1.10 Rest of Europe
- 13. Asia Pacific Rubber Industry Analysis, Insights and Forecast, 2019-2031
- 13.1. Market Analysis, Insights and Forecast - By Country/Sub-region
- 13.1.1 China
- 13.1.2 Japan
- 13.1.3 India
- 13.1.4 South Korea
- 13.1.5 Southeast Asia
- 13.1.6 Australia
- 13.1.7 Indonesia
- 13.1.8 Phillipes
- 13.1.9 Singapore
- 13.1.10 Thailandc
- 13.1.11 Rest of Asia Pacific
- 14. South America Rubber Industry Analysis, Insights and Forecast, 2019-2031
- 14.1. Market Analysis, Insights and Forecast - By Country/Sub-region
- 14.1.1 Brazil
- 14.1.2 Argentina
- 14.1.3 Peru
- 14.1.4 Chile
- 14.1.5 Colombia
- 14.1.6 Ecuador
- 14.1.7 Venezuela
- 14.1.8 Rest of South America
- 15. MEA Rubber Industry Analysis, Insights and Forecast, 2019-2031
- 15.1. Market Analysis, Insights and Forecast - By Country/Sub-region
- 15.1.1 United Arab Emirates
- 15.1.2 Saudi Arabia
- 15.1.3 South Africa
- 15.1.4 Rest of Middle East and Africa
- 16. Competitive Analysis
- 16.1. Global Market Share Analysis 2024
- 16.2. Company Profiles
- 16.2.1 Bridgestone
- 16.2.1.1. Overview
- 16.2.1.2. Products
- 16.2.1.3. SWOT Analysis
- 16.2.1.4. Recent Developments
- 16.2.1.5. Financials (Based on Availability)
- 16.2.2 Michelin
- 16.2.2.1. Overview
- 16.2.2.2. Products
- 16.2.2.3. SWOT Analysis
- 16.2.2.4. Recent Developments
- 16.2.2.5. Financials (Based on Availability)
- 16.2.3 Continental AG
- 16.2.3.1. Overview
- 16.2.3.2. Products
- 16.2.3.3. SWOT Analysis
- 16.2.3.4. Recent Developments
- 16.2.3.5. Financials (Based on Availability)
- 16.2.4 Cooper Tire & Rubber Company
- 16.2.4.1. Overview
- 16.2.4.2. Products
- 16.2.4.3. SWOT Analysis
- 16.2.4.4. Recent Developments
- 16.2.4.5. Financials (Based on Availability)
- 16.2.5 Apollo Tyres Ltd.
- 16.2.5.1. Overview
- 16.2.5.2. Products
- 16.2.5.3. SWOT Analysis
- 16.2.5.4. Recent Developments
- 16.2.5.5. Financials (Based on Availability)
- 16.2.6 Kumho Tire Co. Inc.
- 16.2.6.1. Overview
- 16.2.6.2. Products
- 16.2.6.3. SWOT Analysis
- 16.2.6.4. Recent Developments
- 16.2.6.5. Financials (Based on Availability)
- 16.2.7 The Goodyear Tire & Rubber Company
- 16.2.7.1. Overview
- 16.2.7.2. Products
- 16.2.7.3. SWOT Analysis
- 16.2.7.4. Recent Developments
- 16.2.7.5. Financials (Based on Availability)
- 16.2.8 Pirelli & C. S.p.A.
- 16.2.8.1. Overview
- 16.2.8.2. Products
- 16.2.8.3. SWOT Analysis
- 16.2.8.4. Recent Developments
- 16.2.8.5. Financials (Based on Availability)
- 16.2.9 Sumitomo Rubber Industries Ltd.
- 16.2.9.1. Overview
- 16.2.9.2. Products
- 16.2.9.3. SWOT Analysis
- 16.2.9.4. Recent Developments
- 16.2.9.5. Financials (Based on Availability)
- 16.2.10 Hankook Tire & Technology
- 16.2.10.1. Overview
- 16.2.10.2. Products
- 16.2.10.3. SWOT Analysis
- 16.2.10.4. Recent Developments
- 16.2.10.5. Financials (Based on Availability)
- 16.2.1 Bridgestone
List of Figures
- Figure 1: Global Rubber Industry Revenue Breakdown (Million, %) by Region 2024 & 2032
- Figure 2: North America Rubber Industry Revenue (Million), by Country 2024 & 2032
- Figure 3: North America Rubber Industry Revenue Share (%), by Country 2024 & 2032
- Figure 4: Europe Rubber Industry Revenue (Million), by Country 2024 & 2032
- Figure 5: Europe Rubber Industry Revenue Share (%), by Country 2024 & 2032
- Figure 6: Asia Pacific Rubber Industry Revenue (Million), by Country 2024 & 2032
- Figure 7: Asia Pacific Rubber Industry Revenue Share (%), by Country 2024 & 2032
- Figure 8: South America Rubber Industry Revenue (Million), by Country 2024 & 2032
- Figure 9: South America Rubber Industry Revenue Share (%), by Country 2024 & 2032
- Figure 10: MEA Rubber Industry Revenue (Million), by Country 2024 & 2032
- Figure 11: MEA Rubber Industry Revenue Share (%), by Country 2024 & 2032
- Figure 12: North America Rubber Industry Revenue (Million), by Production Analysis 2024 & 2032
- Figure 13: North America Rubber Industry Revenue Share (%), by Production Analysis 2024 & 2032
- Figure 14: North America Rubber Industry Revenue (Million), by Consumption Analysis 2024 & 2032
- Figure 15: North America Rubber Industry Revenue Share (%), by Consumption Analysis 2024 & 2032
- Figure 16: North America Rubber Industry Revenue (Million), by Import Market Analysis (Value & Volume) 2024 & 2032
- Figure 17: North America Rubber Industry Revenue Share (%), by Import Market Analysis (Value & Volume) 2024 & 2032
- Figure 18: North America Rubber Industry Revenue (Million), by Export Market Analysis (Value & Volume) 2024 & 2032
- Figure 19: North America Rubber Industry Revenue Share (%), by Export Market Analysis (Value & Volume) 2024 & 2032
- Figure 20: North America Rubber Industry Revenue (Million), by Price Trend Analysis 2024 & 2032
- Figure 21: North America Rubber Industry Revenue Share (%), by Price Trend Analysis 2024 & 2032
- Figure 22: North America Rubber Industry Revenue (Million), by Country 2024 & 2032
- Figure 23: North America Rubber Industry Revenue Share (%), by Country 2024 & 2032
- Figure 24: Europe Rubber Industry Revenue (Million), by Production Analysis 2024 & 2032
- Figure 25: Europe Rubber Industry Revenue Share (%), by Production Analysis 2024 & 2032
- Figure 26: Europe Rubber Industry Revenue (Million), by Consumption Analysis 2024 & 2032
- Figure 27: Europe Rubber Industry Revenue Share (%), by Consumption Analysis 2024 & 2032
- Figure 28: Europe Rubber Industry Revenue (Million), by Import Market Analysis (Value & Volume) 2024 & 2032
- Figure 29: Europe Rubber Industry Revenue Share (%), by Import Market Analysis (Value & Volume) 2024 & 2032
- Figure 30: Europe Rubber Industry Revenue (Million), by Export Market Analysis (Value & Volume) 2024 & 2032
- Figure 31: Europe Rubber Industry Revenue Share (%), by Export Market Analysis (Value & Volume) 2024 & 2032
- Figure 32: Europe Rubber Industry Revenue (Million), by Price Trend Analysis 2024 & 2032
- Figure 33: Europe Rubber Industry Revenue Share (%), by Price Trend Analysis 2024 & 2032
- Figure 34: Europe Rubber Industry Revenue (Million), by Country 2024 & 2032
- Figure 35: Europe Rubber Industry Revenue Share (%), by Country 2024 & 2032
- Figure 36: Asia Pacific Rubber Industry Revenue (Million), by Production Analysis 2024 & 2032
- Figure 37: Asia Pacific Rubber Industry Revenue Share (%), by Production Analysis 2024 & 2032
- Figure 38: Asia Pacific Rubber Industry Revenue (Million), by Consumption Analysis 2024 & 2032
- Figure 39: Asia Pacific Rubber Industry Revenue Share (%), by Consumption Analysis 2024 & 2032
- Figure 40: Asia Pacific Rubber Industry Revenue (Million), by Import Market Analysis (Value & Volume) 2024 & 2032
- Figure 41: Asia Pacific Rubber Industry Revenue Share (%), by Import Market Analysis (Value & Volume) 2024 & 2032
- Figure 42: Asia Pacific Rubber Industry Revenue (Million), by Export Market Analysis (Value & Volume) 2024 & 2032
- Figure 43: Asia Pacific Rubber Industry Revenue Share (%), by Export Market Analysis (Value & Volume) 2024 & 2032
- Figure 44: Asia Pacific Rubber Industry Revenue (Million), by Price Trend Analysis 2024 & 2032
- Figure 45: Asia Pacific Rubber Industry Revenue Share (%), by Price Trend Analysis 2024 & 2032
- Figure 46: Asia Pacific Rubber Industry Revenue (Million), by Country 2024 & 2032
- Figure 47: Asia Pacific Rubber Industry Revenue Share (%), by Country 2024 & 2032
- Figure 48: South America Rubber Industry Revenue (Million), by Production Analysis 2024 & 2032
- Figure 49: South America Rubber Industry Revenue Share (%), by Production Analysis 2024 & 2032
- Figure 50: South America Rubber Industry Revenue (Million), by Consumption Analysis 2024 & 2032
- Figure 51: South America Rubber Industry Revenue Share (%), by Consumption Analysis 2024 & 2032
- Figure 52: South America Rubber Industry Revenue (Million), by Import Market Analysis (Value & Volume) 2024 & 2032
- Figure 53: South America Rubber Industry Revenue Share (%), by Import Market Analysis (Value & Volume) 2024 & 2032
- Figure 54: South America Rubber Industry Revenue (Million), by Export Market Analysis (Value & Volume) 2024 & 2032
- Figure 55: South America Rubber Industry Revenue Share (%), by Export Market Analysis (Value & Volume) 2024 & 2032
- Figure 56: South America Rubber Industry Revenue (Million), by Price Trend Analysis 2024 & 2032
- Figure 57: South America Rubber Industry Revenue Share (%), by Price Trend Analysis 2024 & 2032
- Figure 58: South America Rubber Industry Revenue (Million), by Country 2024 & 2032
- Figure 59: South America Rubber Industry Revenue Share (%), by Country 2024 & 2032
- Figure 60: Africa Rubber Industry Revenue (Million), by Production Analysis 2024 & 2032
- Figure 61: Africa Rubber Industry Revenue Share (%), by Production Analysis 2024 & 2032
- Figure 62: Africa Rubber Industry Revenue (Million), by Consumption Analysis 2024 & 2032
- Figure 63: Africa Rubber Industry Revenue Share (%), by Consumption Analysis 2024 & 2032
- Figure 64: Africa Rubber Industry Revenue (Million), by Import Market Analysis (Value & Volume) 2024 & 2032
- Figure 65: Africa Rubber Industry Revenue Share (%), by Import Market Analysis (Value & Volume) 2024 & 2032
- Figure 66: Africa Rubber Industry Revenue (Million), by Export Market Analysis (Value & Volume) 2024 & 2032
- Figure 67: Africa Rubber Industry Revenue Share (%), by Export Market Analysis (Value & Volume) 2024 & 2032
- Figure 68: Africa Rubber Industry Revenue (Million), by Price Trend Analysis 2024 & 2032
- Figure 69: Africa Rubber Industry Revenue Share (%), by Price Trend Analysis 2024 & 2032
- Figure 70: Africa Rubber Industry Revenue (Million), by Country 2024 & 2032
- Figure 71: Africa Rubber Industry Revenue Share (%), by Country 2024 & 2032
List of Tables
- Table 1: Global Rubber Industry Revenue Million Forecast, by Region 2019 & 2032
- Table 2: Global Rubber Industry Revenue Million Forecast, by Production Analysis 2019 & 2032
- Table 3: Global Rubber Industry Revenue Million Forecast, by Consumption Analysis 2019 & 2032
- Table 4: Global Rubber Industry Revenue Million Forecast, by Import Market Analysis (Value & Volume) 2019 & 2032
- Table 5: Global Rubber Industry Revenue Million Forecast, by Export Market Analysis (Value & Volume) 2019 & 2032
- Table 6: Global Rubber Industry Revenue Million Forecast, by Price Trend Analysis 2019 & 2032
- Table 7: Global Rubber Industry Revenue Million Forecast, by Region 2019 & 2032
- Table 8: Global Rubber Industry Revenue Million Forecast, by Country 2019 & 2032
- Table 9: United States Rubber Industry Revenue (Million) Forecast, by Application 2019 & 2032
- Table 10: Canada Rubber Industry Revenue (Million) Forecast, by Application 2019 & 2032
- Table 11: Mexico Rubber Industry Revenue (Million) Forecast, by Application 2019 & 2032
- Table 12: Global Rubber Industry Revenue Million Forecast, by Country 2019 & 2032
- Table 13: Germany Rubber Industry Revenue (Million) Forecast, by Application 2019 & 2032
- Table 14: United Kingdom Rubber Industry Revenue (Million) Forecast, by Application 2019 & 2032
- Table 15: France Rubber Industry Revenue (Million) Forecast, by Application 2019 & 2032
- Table 16: Spain Rubber Industry Revenue (Million) Forecast, by Application 2019 & 2032
- Table 17: Italy Rubber Industry Revenue (Million) Forecast, by Application 2019 & 2032
- Table 18: Spain Rubber Industry Revenue (Million) Forecast, by Application 2019 & 2032
- Table 19: Belgium Rubber Industry Revenue (Million) Forecast, by Application 2019 & 2032
- Table 20: Netherland Rubber Industry Revenue (Million) Forecast, by Application 2019 & 2032
- Table 21: Nordics Rubber Industry Revenue (Million) Forecast, by Application 2019 & 2032
- Table 22: Rest of Europe Rubber Industry Revenue (Million) Forecast, by Application 2019 & 2032
- Table 23: Global Rubber Industry Revenue Million Forecast, by Country 2019 & 2032
- Table 24: China Rubber Industry Revenue (Million) Forecast, by Application 2019 & 2032
- Table 25: Japan Rubber Industry Revenue (Million) Forecast, by Application 2019 & 2032
- Table 26: India Rubber Industry Revenue (Million) Forecast, by Application 2019 & 2032
- Table 27: South Korea Rubber Industry Revenue (Million) Forecast, by Application 2019 & 2032
- Table 28: Southeast Asia Rubber Industry Revenue (Million) Forecast, by Application 2019 & 2032
- Table 29: Australia Rubber Industry Revenue (Million) Forecast, by Application 2019 & 2032
- Table 30: Indonesia Rubber Industry Revenue (Million) Forecast, by Application 2019 & 2032
- Table 31: Phillipes Rubber Industry Revenue (Million) Forecast, by Application 2019 & 2032
- Table 32: Singapore Rubber Industry Revenue (Million) Forecast, by Application 2019 & 2032
- Table 33: Thailandc Rubber Industry Revenue (Million) Forecast, by Application 2019 & 2032
- Table 34: Rest of Asia Pacific Rubber Industry Revenue (Million) Forecast, by Application 2019 & 2032
- Table 35: Global Rubber Industry Revenue Million Forecast, by Country 2019 & 2032
- Table 36: Brazil Rubber Industry Revenue (Million) Forecast, by Application 2019 & 2032
- Table 37: Argentina Rubber Industry Revenue (Million) Forecast, by Application 2019 & 2032
- Table 38: Peru Rubber Industry Revenue (Million) Forecast, by Application 2019 & 2032
- Table 39: Chile Rubber Industry Revenue (Million) Forecast, by Application 2019 & 2032
- Table 40: Colombia Rubber Industry Revenue (Million) Forecast, by Application 2019 & 2032
- Table 41: Ecuador Rubber Industry Revenue (Million) Forecast, by Application 2019 & 2032
- Table 42: Venezuela Rubber Industry Revenue (Million) Forecast, by Application 2019 & 2032
- Table 43: Rest of South America Rubber Industry Revenue (Million) Forecast, by Application 2019 & 2032
- Table 44: Global Rubber Industry Revenue Million Forecast, by Country 2019 & 2032
- Table 45: United Arab Emirates Rubber Industry Revenue (Million) Forecast, by Application 2019 & 2032
- Table 46: Saudi Arabia Rubber Industry Revenue (Million) Forecast, by Application 2019 & 2032
- Table 47: South Africa Rubber Industry Revenue (Million) Forecast, by Application 2019 & 2032
- Table 48: Rest of Middle East and Africa Rubber Industry Revenue (Million) Forecast, by Application 2019 & 2032
- Table 49: Global Rubber Industry Revenue Million Forecast, by Production Analysis 2019 & 2032
- Table 50: Global Rubber Industry Revenue Million Forecast, by Consumption Analysis 2019 & 2032
- Table 51: Global Rubber Industry Revenue Million Forecast, by Import Market Analysis (Value & Volume) 2019 & 2032
- Table 52: Global Rubber Industry Revenue Million Forecast, by Export Market Analysis (Value & Volume) 2019 & 2032
- Table 53: Global Rubber Industry Revenue Million Forecast, by Price Trend Analysis 2019 & 2032
- Table 54: Global Rubber Industry Revenue Million Forecast, by Country 2019 & 2032
- Table 55: United States Rubber Industry Revenue (Million) Forecast, by Application 2019 & 2032
- Table 56: Mexico Rubber Industry Revenue (Million) Forecast, by Application 2019 & 2032
- Table 57: Global Rubber Industry Revenue Million Forecast, by Production Analysis 2019 & 2032
- Table 58: Global Rubber Industry Revenue Million Forecast, by Consumption Analysis 2019 & 2032
- Table 59: Global Rubber Industry Revenue Million Forecast, by Import Market Analysis (Value & Volume) 2019 & 2032
- Table 60: Global Rubber Industry Revenue Million Forecast, by Export Market Analysis (Value & Volume) 2019 & 2032
- Table 61: Global Rubber Industry Revenue Million Forecast, by Price Trend Analysis 2019 & 2032
- Table 62: Global Rubber Industry Revenue Million Forecast, by Country 2019 & 2032
- Table 63: Germany Rubber Industry Revenue (Million) Forecast, by Application 2019 & 2032
- Table 64: France Rubber Industry Revenue (Million) Forecast, by Application 2019 & 2032
- Table 65: Italy Rubber Industry Revenue (Million) Forecast, by Application 2019 & 2032
- Table 66: Turkey Rubber Industry Revenue (Million) Forecast, by Application 2019 & 2032
- Table 67: Global Rubber Industry Revenue Million Forecast, by Production Analysis 2019 & 2032
- Table 68: Global Rubber Industry Revenue Million Forecast, by Consumption Analysis 2019 & 2032
- Table 69: Global Rubber Industry Revenue Million Forecast, by Import Market Analysis (Value & Volume) 2019 & 2032
- Table 70: Global Rubber Industry Revenue Million Forecast, by Export Market Analysis (Value & Volume) 2019 & 2032
- Table 71: Global Rubber Industry Revenue Million Forecast, by Price Trend Analysis 2019 & 2032
- Table 72: Global Rubber Industry Revenue Million Forecast, by Country 2019 & 2032
- Table 73: China Rubber Industry Revenue (Million) Forecast, by Application 2019 & 2032
- Table 74: Malaysia Rubber Industry Revenue (Million) Forecast, by Application 2019 & 2032
- Table 75: Thailand Rubber Industry Revenue (Million) Forecast, by Application 2019 & 2032
- Table 76: Japan Rubber Industry Revenue (Million) Forecast, by Application 2019 & 2032
- Table 77: India Rubber Industry Revenue (Million) Forecast, by Application 2019 & 2032
- Table 78: Indonesia Rubber Industry Revenue (Million) Forecast, by Application 2019 & 2032
- Table 79: Global Rubber Industry Revenue Million Forecast, by Production Analysis 2019 & 2032
- Table 80: Global Rubber Industry Revenue Million Forecast, by Consumption Analysis 2019 & 2032
- Table 81: Global Rubber Industry Revenue Million Forecast, by Import Market Analysis (Value & Volume) 2019 & 2032
- Table 82: Global Rubber Industry Revenue Million Forecast, by Export Market Analysis (Value & Volume) 2019 & 2032
- Table 83: Global Rubber Industry Revenue Million Forecast, by Price Trend Analysis 2019 & 2032
- Table 84: Global Rubber Industry Revenue Million Forecast, by Country 2019 & 2032
- Table 85: Brazil Rubber Industry Revenue (Million) Forecast, by Application 2019 & 2032
- Table 86: Chile Rubber Industry Revenue (Million) Forecast, by Application 2019 & 2032
- Table 87: Global Rubber Industry Revenue Million Forecast, by Production Analysis 2019 & 2032
- Table 88: Global Rubber Industry Revenue Million Forecast, by Consumption Analysis 2019 & 2032
- Table 89: Global Rubber Industry Revenue Million Forecast, by Import Market Analysis (Value & Volume) 2019 & 2032
- Table 90: Global Rubber Industry Revenue Million Forecast, by Export Market Analysis (Value & Volume) 2019 & 2032
- Table 91: Global Rubber Industry Revenue Million Forecast, by Price Trend Analysis 2019 & 2032
- Table 92: Global Rubber Industry Revenue Million Forecast, by Country 2019 & 2032
- Table 93: South Africa Rubber Industry Revenue (Million) Forecast, by Application 2019 & 2032
Frequently Asked Questions
1. What is the projected Compound Annual Growth Rate (CAGR) of the Rubber Industry?
The projected CAGR is approximately 4.70%.
2. Which companies are prominent players in the Rubber Industry?
Key companies in the market include Bridgestone , Michelin , Continental AG , Cooper Tire & Rubber Company , Apollo Tyres Ltd. , Kumho Tire Co., Inc., The Goodyear Tire & Rubber Company , Pirelli & C. S.p.A. , Sumitomo Rubber Industries, Ltd. , Hankook Tire & Technology.
3. What are the main segments of the Rubber Industry?
The market segments include Production Analysis, Consumption Analysis, Import Market Analysis (Value & Volume), Export Market Analysis (Value & Volume), Price Trend Analysis.
4. Can you provide details about the market size?
The market size is estimated to be USD 18.14 Million as of 2022.
5. What are some drivers contributing to market growth?
Increasing Berry Consumption for Health Benefits; Increasing Adoption of High-Technology Farm Practices; Growing Usage of Berries in the Food and Beverage Industries.
6. What are the notable trends driving market growth?
Increasing demand from Various Industries.
7. Are there any restraints impacting market growth?
High Production Cost Involved in Berry Production; Increasing Disease and Pest Infestations.
8. Can you provide examples of recent developments in the market?
N/A
9. What pricing options are available for accessing the report?
Pricing options include single-user, multi-user, and enterprise licenses priced at USD 4750, USD 5250, and USD 8750 respectively.
10. Is the market size provided in terms of value or volume?
The market size is provided in terms of value, measured in Million.
11. Are there any specific market keywords associated with the report?
Yes, the market keyword associated with the report is "Rubber Industry," which aids in identifying and referencing the specific market segment covered.
12. How do I determine which pricing option suits my needs best?
The pricing options vary based on user requirements and access needs. Individual users may opt for single-user licenses, while businesses requiring broader access may choose multi-user or enterprise licenses for cost-effective access to the report.
13. Are there any additional resources or data provided in the Rubber Industry report?
While the report offers comprehensive insights, it's advisable to review the specific contents or supplementary materials provided to ascertain if additional resources or data are available.
14. How can I stay updated on further developments or reports in the Rubber Industry?
To stay informed about further developments, trends, and reports in the Rubber Industry, consider subscribing to industry newsletters, following relevant companies and organizations, or regularly checking reputable industry news sources and publications.
Methodology
Step 1 - Identification of Relevant Samples Size from Population Database


Step 2 - Approaches for Defining Global Market Size (Value, Volume* & Price*)

Note*: In applicable scenarios
Step 3 - Data Sources
Primary Research
- Web Analytics
- Survey Reports
- Research Institute
- Latest Research Reports
- Opinion Leaders
Secondary Research
- Annual Reports
- White Paper
- Latest Press Release
- Industry Association
- Paid Database
- Investor Presentations

Step 4 - Data Triangulation
Involves using different sources of information in order to increase the validity of a study
These sources are likely to be stakeholders in a program - participants, other researchers, program staff, other community members, and so on.
Then we put all data in single framework & apply various statistical tools to find out the dynamic on the market.
During the analysis stage, feedback from the stakeholder groups would be compared to determine areas of agreement as well as areas of divergence


