

Key Insights
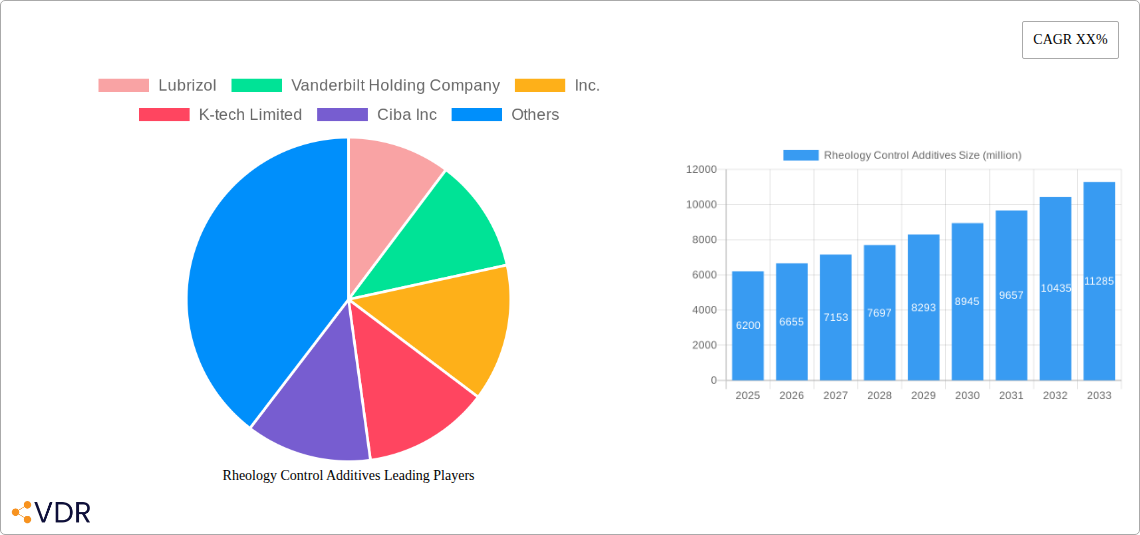
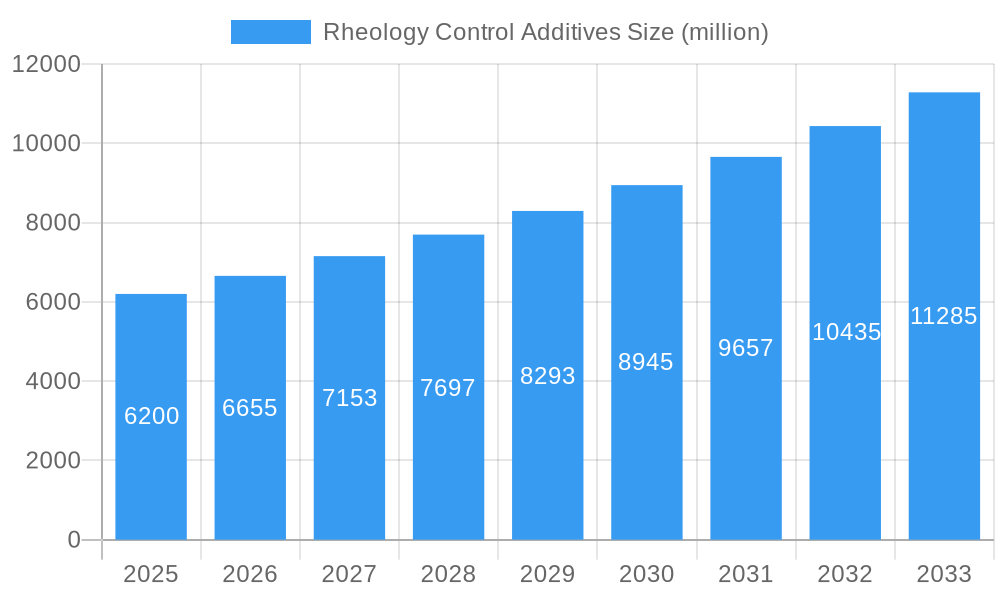
The global Rheology Control Additives market is projected to experience robust growth, driven by an estimated market size of USD 6,200 million in 2025 and a Compound Annual Growth Rate (CAGR) of approximately 7.5% between 2025 and 2033. This expansion is underpinned by a strong demand across diverse applications, particularly in the flourishing Food & Beverage sector, where precise texture and stability are paramount. The Architectural segment also presents significant opportunities, fueled by an increasing need for high-performance coatings and construction materials. Furthermore, the Family Decoration sector is contributing to market dynamism with rising consumer interest in DIY projects and customized home aesthetics. Emerging economies, especially within the Asia Pacific region, are anticipated to be key growth engines, owing to rapid industrialization and increasing disposable incomes. The market is further stimulated by innovations in rheology modifier technologies, leading to the development of specialized additives that enhance product performance and processing efficiency across various industries.
Rheology Control Additives Market Size (In Billion)
The market's growth trajectory is further supported by the broad adoption of both Powder and Liquid Rheology Control Additives, catering to a wide spectrum of formulation needs. Key market players are actively investing in research and development to introduce novel additives with improved sustainability profiles and enhanced functionalities, addressing growing environmental concerns and stricter regulatory landscapes. However, the market faces certain restraints, including the fluctuating raw material costs, which can impact profit margins for manufacturers. Geopolitical uncertainties and supply chain disruptions also pose potential challenges. Nevertheless, the overarching trend of increasing demand for sophisticated material properties across end-use industries, coupled with ongoing technological advancements in rheology control, is expected to propel the market towards sustained and significant expansion in the coming years.
Rheology Control Additives Company Market Share
Rheology Control Additives Market Report: Global Insights & Future Projections (2019-2033)
Unlock comprehensive insights into the global Rheology Control Additives market with this in-depth report. Covering the study period from 2019 to 2033, with a base and estimated year of 2025 and a forecast period of 2025-2033, this analysis delves into market dynamics, growth trends, regional dominance, product innovations, and key players. Essential for industry professionals, researchers, and investors seeking to understand the evolving landscape of rheology modifiers across diverse applications.
Rheology Control Additives Market Dynamics & Structure
The global Rheology Control Additives market is characterized by a moderate to high level of concentration, with key players like Lubrizol, Vanderbilt Holding Company, Inc., Evonik Industries, and Arkema Coating Resins holding significant market shares. Technological innovation serves as a primary driver, with ongoing research focused on developing additives with enhanced performance, sustainability, and ease of application. For instance, the demand for bio-based and low-VOC rheology modifiers is on the rise. Regulatory frameworks, particularly those related to environmental impact and product safety in sectors like Food & Beverage and Architectural applications, also shape market strategies. Competitive product substitutes, such as advanced formulation techniques and alternative thickening agents, pose a constant challenge, requiring manufacturers to continually innovate. End-user demographics are diverse, spanning industries from construction and automotive to personal care and food processing, each with unique performance demands. Mergers and acquisitions (M&A) remain a strategic tool for market consolidation and the acquisition of new technologies. Over the historical period (2019-2024), we observed a XX% increase in M&A deal volumes, indicating active consolidation.
- Market Concentration: Moderate to High, with key players dominating specific segments.
- Technological Innovation: Driven by demand for sustainability, high performance, and specialized functionalities.
- Regulatory Frameworks: Influenced by environmental protection and product safety standards.
- Competitive Landscape: Characterized by ongoing innovation and the emergence of alternative solutions.
- End-User Diversification: Spanning multiple industrial and consumer sectors.
- M&A Trends: Active consolidation and strategic acquisitions to gain market share and technological prowess.
Rheology Control Additives Growth Trends & Insights
The Rheology Control Additives market is projected to experience robust growth, driven by increasing demand from key application sectors and advancements in formulation science. The global market size for rheology control additives is estimated to reach $XX billion by 2025, with a projected Compound Annual Growth Rate (CAGR) of approximately XX% between 2025 and 2033. This expansion is fueled by several factors: the growing demand for high-performance coatings and paints in the Architectural and Family Decoration segments, the stringent requirements for texture and stability in the Food & Beverage industry, and the increasing use of specialized additives in industrial applications. Technological disruptions, such as the development of novel associative thickeners and advanced particulate rheology modifiers, are enhancing product efficacy and opening up new application avenues. Consumer behavior shifts, including a preference for environmentally friendly and sustainable products, are pushing manufacturers to invest in greener rheology control additive formulations. The market penetration of advanced rheology control additives is expected to rise significantly as industries recognize their value in improving product quality, process efficiency, and end-user experience.
- Market Size Evolution: Projected to reach $XX billion by 2025.
- CAGR: Anticipated at XX% during the forecast period (2025-2033).
- Adoption Rates: Steadily increasing across diverse industrial and consumer applications.
- Technological Disruptions: Novel thickeners and modifiers driving enhanced performance and new uses.
- Consumer Behavior Shifts: Growing demand for sustainable and eco-friendly rheology solutions.
- Market Penetration: Increasing as industries recognize the benefits of sophisticated rheology control.
Dominant Regions, Countries, or Segments in Rheology Control Additives
The Architectural segment, within the Application category, is a dominant driver of growth in the global Rheology Control Additives market. This dominance is largely attributed to the sustained global construction activities, coupled with increasing consumer demand for high-quality, durable, and aesthetically pleasing paints and coatings. The growing emphasis on sustainable building practices also fuels the adoption of low-VOC and eco-friendly architectural coatings, necessitating advanced rheology modifiers for optimal performance and application. In terms of regions, Asia Pacific stands out as the leading market, propelled by rapid urbanization, industrialization, and a burgeoning middle class with increased disposable income. Countries like China and India are major contributors due to their large-scale manufacturing capabilities and significant investments in infrastructure development and the construction sector.
- Dominant Application Segment: Architectural.
- Key Drivers: Global construction growth, demand for high-performance coatings, sustainable building initiatives, and increasing aesthetic preferences.
- Market Share: Expected to account for over XX% of the total market by 2025.
- Growth Potential: High due to ongoing infrastructure projects and renovation trends.
- Leading Region: Asia Pacific.
- Key Drivers: Rapid urbanization, industrial expansion, significant infrastructure investments, and a growing middle-class consumer base.
- Dominant Countries: China, India, and Southeast Asian nations.
- Economic Policies: Favorable government policies supporting manufacturing and construction sectors.
- Infrastructure Development: Extensive projects driving demand for construction materials and coatings.
Rheology Control Additives Product Landscape
The product landscape of Rheology Control Additives is dynamic, with continuous innovation focused on tailoring performance to specific applications. Liquid Rheology Control Additives, particularly associative thickeners and organoclays, are gaining prominence for their ease of dispersion and broad compatibility in various formulations, from water-based paints to personal care products. Innovations are geared towards enhanced shear-thinning properties, improved sag resistance, and better leveling characteristics. Powder rheology control additives, such as cellulosic ethers and fumed silicas, remain crucial for dry-mix applications and offer excellent cost-effectiveness. Unique selling propositions often lie in their ability to provide precise viscosity control with minimal impact on other formulation properties. Technological advancements are also addressing sustainability concerns, leading to the development of bio-derived and biodegradable rheology modifiers.
Key Drivers, Barriers & Challenges in Rheology Control Additives
Key Drivers: The primary forces propelling the Rheology Control Additives market include the growing demand for high-performance coatings and inks, the expanding applications in the Food & Beverage industry for texture modification and stability, and increasing regulatory pressure for environmentally friendly formulations. Technological advancements in additive synthesis are also a significant catalyst.
- Technological Advancements: Development of novel thickeners and modifiers with superior performance.
- Application Expansion: Growing use in paints, coatings, adhesives, food, personal care, and pharmaceuticals.
- Sustainability Demand: Increasing preference for eco-friendly and low-VOC additives.
- Infrastructure Development: Driving demand in construction and architectural applications.
Barriers & Challenges: Significant challenges include volatile raw material prices, impacting production costs and profitability. Stringent regulatory compliance for certain applications, especially in Food & Beverage and personal care, can also pose hurdles. Intense competition from established players and the potential for developing in-house rheology control solutions by large end-users represent competitive pressures. Supply chain disruptions, as witnessed in recent global events, can affect availability and delivery timelines.
- Raw Material Price Volatility: Affecting manufacturing costs and profit margins.
- Regulatory Hurdles: Compliance with evolving standards in various application sectors.
- Intense Competition: From both additive manufacturers and potential in-house solutions.
- Supply Chain Disruptions: Potential for delays and availability issues.
Emerging Opportunities in Rheology Control Additives
Emerging opportunities lie in the development of specialized rheology control additives for niche applications, such as 3D printing inks, advanced pharmaceutical formulations, and smart coatings with self-healing or responsive properties. The increasing focus on sustainable and bio-based ingredients presents a significant opportunity for manufacturers to develop eco-friendly rheology modifiers. Furthermore, untapped markets in developing economies, driven by rapid industrialization and infrastructure growth, offer substantial expansion potential. The growing trend towards personalized products in sectors like cosmetics and food also creates demand for tailored rheology solutions.
- Niche Application Development: 3D printing, pharmaceuticals, smart coatings.
- Sustainable & Bio-based Formulations: Meeting growing environmental consciousness.
- Emerging Market Penetration: Targeting developing economies with growing industrial needs.
- Personalized Product Solutions: Catering to customized formulations.
Growth Accelerators in the Rheology Control Additives Industry
Long-term growth in the Rheology Control Additives industry will be significantly accelerated by continuous technological breakthroughs in additive design, focusing on enhanced functionality and sustainability. Strategic partnerships and collaborations between additive manufacturers and end-users will foster innovation and faster product development cycles. Market expansion strategies, including the penetration of under-served geographic regions and the diversification of product portfolios to cater to emerging application needs, will further drive growth. Investments in research and development (R&D) to create novel additives with improved environmental profiles and performance characteristics will be crucial.
- Technological Breakthroughs: Focus on advanced functionalities and eco-friendly solutions.
- Strategic Partnerships: Collaborations driving innovation and market access.
- Market Expansion: Entering new geographies and application segments.
- R&D Investment: Developing next-generation rheology modifiers.
Key Players Shaping the Rheology Control Additives Market
- Lubrizol
- Vanderbilt Holding Company, Inc.
- K-tech Limited
- Ciba Inc
- Skyfield Minerals Pvt. Ltd.
- Evonik Industries
- Arkema Coating Resins
- Lucid Colloids Ltd
- Devine Chemicals Ltd
- Eastman
- KITO
Notable Milestones in Rheology Control Additives Sector
- 2020 March: Lubrizol launches new range of high-performance thickeners for sustainable coatings.
- 2021 September: Evonik Industries expands its portfolio with bio-based rheology modifiers for personal care.
- 2022 February: Arkema Coating Resins announces acquisition of a specialty additives company, enhancing its rheology control offerings.
- 2022 October: Vanderbilt Holding Company, Inc. introduces innovative organoclay technology for demanding industrial applications.
- 2023 April: K-tech Limited patents a novel powder rheology modifier for construction chemicals.
- 2024 January: Skyfield Minerals Pvt. Ltd. expands production capacity for mineral-based rheology additives.
In-Depth Rheology Control Additives Market Outlook
The future outlook for the Rheology Control Additives market is exceptionally promising, driven by sustained innovation and expanding application scope. Growth accelerators, including the unwavering demand for high-performance materials in construction, automotive, and packaging, coupled with the burgeoning Food & Beverage sector's need for precise texture control, will fuel market expansion. The increasing global emphasis on sustainability is creating significant opportunities for bio-based and environmentally friendly rheology modifiers, pushing manufacturers to invest heavily in green chemistry. Strategic partnerships and targeted R&D will unlock new frontiers, particularly in advanced materials and personalized product formulations. The market is poised for continued robust growth, with an estimated XX% expansion projected by 2033.
Rheology Control Additives Segmentation
-
1. Application
- 1.1. Family Decoration
- 1.2. Food & Beverage
- 1.3. Architectural
- 1.4. Others
-
2. Types
- 2.1. Powder Rheology Control Additives
- 2.2. Liquid Rheology Control Additives
Rheology Control Additives Segmentation By Geography
-
1. North America
- 1.1. United States
- 1.2. Canada
- 1.3. Mexico
-
2. South America
- 2.1. Brazil
- 2.2. Argentina
- 2.3. Rest of South America
-
3. Europe
- 3.1. United Kingdom
- 3.2. Germany
- 3.3. France
- 3.4. Italy
- 3.5. Spain
- 3.6. Russia
- 3.7. Benelux
- 3.8. Nordics
- 3.9. Rest of Europe
-
4. Middle East & Africa
- 4.1. Turkey
- 4.2. Israel
- 4.3. GCC
- 4.4. North Africa
- 4.5. South Africa
- 4.6. Rest of Middle East & Africa
-
5. Asia Pacific
- 5.1. China
- 5.2. India
- 5.3. Japan
- 5.4. South Korea
- 5.5. ASEAN
- 5.6. Oceania
- 5.7. Rest of Asia Pacific
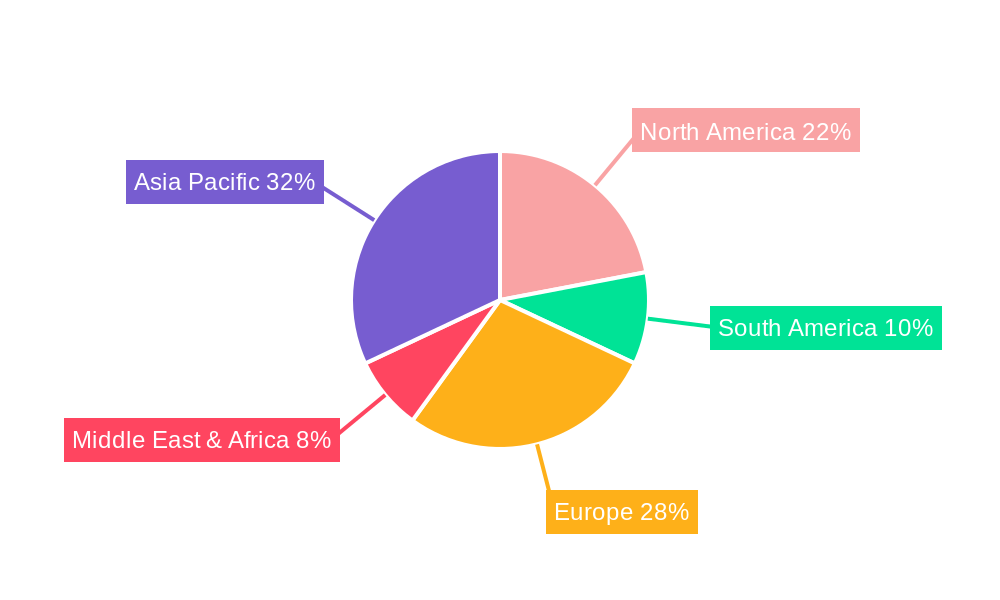
Rheology Control Additives Regional Market Share
Geographic Coverage of Rheology Control Additives
Rheology Control Additives REPORT HIGHLIGHTS
| Aspects | Details |
|---|---|
| Study Period | 2020-2034 |
| Base Year | 2025 |
| Estimated Year | 2026 |
| Forecast Period | 2026-2034 |
| Historical Period | 2020-2025 |
| Growth Rate | CAGR of 4.5% from 2020-2034 |
| Segmentation |
|
Table of Contents
- 1. Introduction
- 1.1. Research Scope
- 1.2. Market Segmentation
- 1.3. Research Objective
- 1.4. Definitions and Assumptions
- 2. Executive Summary
- 2.1. Market Snapshot
- 3. Market Dynamics
- 3.1. Market Drivers
- 3.2. Market Restrains
- 3.3. Market Trends
- 3.4. Market Opportunities
- 4. Market Factor Analysis
- 4.1. Porters Five Forces
- 4.1.1. Bargaining Power of Suppliers
- 4.1.2. Bargaining Power of Buyers
- 4.1.3. Threat of New Entrants
- 4.1.4. Threat of Substitutes
- 4.1.5. Competitive Rivalry
- 4.2. PESTEL analysis
- 4.3. BCG Analysis
- 4.3.1. Stars (High Growth, High Market Share)
- 4.3.2. Cash Cows (Low Growth, High Market Share)
- 4.3.3. Question Mark (High Growth, Low Market Share)
- 4.3.4. Dogs (Low Growth, Low Market Share)
- 4.4. Ansoff Matrix Analysis
- 4.5. Supply Chain Analysis
- 4.6. Regulatory Landscape
- 4.7. Current Market Potential and Opportunity Assessment (TAM–SAM–SOM Framework)
- 4.8. VDR Analyst Note
- 4.1. Porters Five Forces
- 5. Market Analysis, Insights and Forecast 2021-2033
- 5.1. Market Analysis, Insights and Forecast - by Application
- 5.1.1. Family Decoration
- 5.1.2. Food & Beverage
- 5.1.3. Architectural
- 5.1.4. Others
- 5.2. Market Analysis, Insights and Forecast - by Types
- 5.2.1. Powder Rheology Control Additives
- 5.2.2. Liquid Rheology Control Additives
- 5.3. Market Analysis, Insights and Forecast - by Region
- 5.3.1. North America
- 5.3.2. South America
- 5.3.3. Europe
- 5.3.4. Middle East & Africa
- 5.3.5. Asia Pacific
- 5.1. Market Analysis, Insights and Forecast - by Application
- 6. Global Rheology Control Additives Analysis, Insights and Forecast, 2021-2033
- 6.1. Market Analysis, Insights and Forecast - by Application
- 6.1.1. Family Decoration
- 6.1.2. Food & Beverage
- 6.1.3. Architectural
- 6.1.4. Others
- 6.2. Market Analysis, Insights and Forecast - by Types
- 6.2.1. Powder Rheology Control Additives
- 6.2.2. Liquid Rheology Control Additives
- 6.1. Market Analysis, Insights and Forecast - by Application
- 7. North America Rheology Control Additives Analysis, Insights and Forecast, 2021-2033
- 7.1. Market Analysis, Insights and Forecast - by Application
- 7.1.1. Family Decoration
- 7.1.2. Food & Beverage
- 7.1.3. Architectural
- 7.1.4. Others
- 7.2. Market Analysis, Insights and Forecast - by Types
- 7.2.1. Powder Rheology Control Additives
- 7.2.2. Liquid Rheology Control Additives
- 7.1. Market Analysis, Insights and Forecast - by Application
- 8. South America Rheology Control Additives Analysis, Insights and Forecast, 2021-2033
- 8.1. Market Analysis, Insights and Forecast - by Application
- 8.1.1. Family Decoration
- 8.1.2. Food & Beverage
- 8.1.3. Architectural
- 8.1.4. Others
- 8.2. Market Analysis, Insights and Forecast - by Types
- 8.2.1. Powder Rheology Control Additives
- 8.2.2. Liquid Rheology Control Additives
- 8.1. Market Analysis, Insights and Forecast - by Application
- 9. Europe Rheology Control Additives Analysis, Insights and Forecast, 2021-2033
- 9.1. Market Analysis, Insights and Forecast - by Application
- 9.1.1. Family Decoration
- 9.1.2. Food & Beverage
- 9.1.3. Architectural
- 9.1.4. Others
- 9.2. Market Analysis, Insights and Forecast - by Types
- 9.2.1. Powder Rheology Control Additives
- 9.2.2. Liquid Rheology Control Additives
- 9.1. Market Analysis, Insights and Forecast - by Application
- 10. Middle East & Africa Rheology Control Additives Analysis, Insights and Forecast, 2021-2033
- 10.1. Market Analysis, Insights and Forecast - by Application
- 10.1.1. Family Decoration
- 10.1.2. Food & Beverage
- 10.1.3. Architectural
- 10.1.4. Others
- 10.2. Market Analysis, Insights and Forecast - by Types
- 10.2.1. Powder Rheology Control Additives
- 10.2.2. Liquid Rheology Control Additives
- 10.1. Market Analysis, Insights and Forecast - by Application
- 11. Asia Pacific Rheology Control Additives Analysis, Insights and Forecast, 2021-2033
- 11.1. Market Analysis, Insights and Forecast - by Application
- 11.1.1. Family Decoration
- 11.1.2. Food & Beverage
- 11.1.3. Architectural
- 11.1.4. Others
- 11.2. Market Analysis, Insights and Forecast - by Types
- 11.2.1. Powder Rheology Control Additives
- 11.2.2. Liquid Rheology Control Additives
- 11.1. Market Analysis, Insights and Forecast - by Application
- 12. Competitive Analysis
- 12.1. Company Profiles
- 12.1.1 Lubrizol
- 12.1.1.1. Company Overview
- 12.1.1.2. Products
- 12.1.1.3. Company Financials
- 12.1.1.4. SWOT Analysis
- 12.1.2 Vanderbilt Holding Company
- 12.1.2.1. Company Overview
- 12.1.2.2. Products
- 12.1.2.3. Company Financials
- 12.1.2.4. SWOT Analysis
- 12.1.3 Inc.
- 12.1.3.1. Company Overview
- 12.1.3.2. Products
- 12.1.3.3. Company Financials
- 12.1.3.4. SWOT Analysis
- 12.1.4 K-tech Limited
- 12.1.4.1. Company Overview
- 12.1.4.2. Products
- 12.1.4.3. Company Financials
- 12.1.4.4. SWOT Analysis
- 12.1.5 Ciba Inc
- 12.1.5.1. Company Overview
- 12.1.5.2. Products
- 12.1.5.3. Company Financials
- 12.1.5.4. SWOT Analysis
- 12.1.6 Skyfield Minerals Pvt. Ltd.
- 12.1.6.1. Company Overview
- 12.1.6.2. Products
- 12.1.6.3. Company Financials
- 12.1.6.4. SWOT Analysis
- 12.1.7 Evonik Industries
- 12.1.7.1. Company Overview
- 12.1.7.2. Products
- 12.1.7.3. Company Financials
- 12.1.7.4. SWOT Analysis
- 12.1.8 Arkema Coating Resins
- 12.1.8.1. Company Overview
- 12.1.8.2. Products
- 12.1.8.3. Company Financials
- 12.1.8.4. SWOT Analysis
- 12.1.9 Lucid Colloids Ltd
- 12.1.9.1. Company Overview
- 12.1.9.2. Products
- 12.1.9.3. Company Financials
- 12.1.9.4. SWOT Analysis
- 12.1.10 Devine Chemicals Ltd
- 12.1.10.1. Company Overview
- 12.1.10.2. Products
- 12.1.10.3. Company Financials
- 12.1.10.4. SWOT Analysis
- 12.1.11 Eastman
- 12.1.11.1. Company Overview
- 12.1.11.2. Products
- 12.1.11.3. Company Financials
- 12.1.11.4. SWOT Analysis
- 12.1.12 KITO
- 12.1.12.1. Company Overview
- 12.1.12.2. Products
- 12.1.12.3. Company Financials
- 12.1.12.4. SWOT Analysis
- 12.1.1 Lubrizol
- 12.2. Market Entropy
- 12.2.1 Company's Key Areas Served
- 12.2.2 Recent Developments
- 12.3. Company Market Share Analysis 2025
- 12.3.1 Top 5 Companies Market Share Analysis
- 12.3.2 Top 3 Companies Market Share Analysis
- 12.4. List of Potential Customers
- 13. Research Methodology
List of Figures
- Figure 1: Global Rheology Control Additives Revenue Breakdown (undefined, %) by Region 2025 & 2033
- Figure 2: North America Rheology Control Additives Revenue (undefined), by Application 2025 & 2033
- Figure 3: North America Rheology Control Additives Revenue Share (%), by Application 2025 & 2033
- Figure 4: North America Rheology Control Additives Revenue (undefined), by Types 2025 & 2033
- Figure 5: North America Rheology Control Additives Revenue Share (%), by Types 2025 & 2033
- Figure 6: North America Rheology Control Additives Revenue (undefined), by Country 2025 & 2033
- Figure 7: North America Rheology Control Additives Revenue Share (%), by Country 2025 & 2033
- Figure 8: South America Rheology Control Additives Revenue (undefined), by Application 2025 & 2033
- Figure 9: South America Rheology Control Additives Revenue Share (%), by Application 2025 & 2033
- Figure 10: South America Rheology Control Additives Revenue (undefined), by Types 2025 & 2033
- Figure 11: South America Rheology Control Additives Revenue Share (%), by Types 2025 & 2033
- Figure 12: South America Rheology Control Additives Revenue (undefined), by Country 2025 & 2033
- Figure 13: South America Rheology Control Additives Revenue Share (%), by Country 2025 & 2033
- Figure 14: Europe Rheology Control Additives Revenue (undefined), by Application 2025 & 2033
- Figure 15: Europe Rheology Control Additives Revenue Share (%), by Application 2025 & 2033
- Figure 16: Europe Rheology Control Additives Revenue (undefined), by Types 2025 & 2033
- Figure 17: Europe Rheology Control Additives Revenue Share (%), by Types 2025 & 2033
- Figure 18: Europe Rheology Control Additives Revenue (undefined), by Country 2025 & 2033
- Figure 19: Europe Rheology Control Additives Revenue Share (%), by Country 2025 & 2033
- Figure 20: Middle East & Africa Rheology Control Additives Revenue (undefined), by Application 2025 & 2033
- Figure 21: Middle East & Africa Rheology Control Additives Revenue Share (%), by Application 2025 & 2033
- Figure 22: Middle East & Africa Rheology Control Additives Revenue (undefined), by Types 2025 & 2033
- Figure 23: Middle East & Africa Rheology Control Additives Revenue Share (%), by Types 2025 & 2033
- Figure 24: Middle East & Africa Rheology Control Additives Revenue (undefined), by Country 2025 & 2033
- Figure 25: Middle East & Africa Rheology Control Additives Revenue Share (%), by Country 2025 & 2033
- Figure 26: Asia Pacific Rheology Control Additives Revenue (undefined), by Application 2025 & 2033
- Figure 27: Asia Pacific Rheology Control Additives Revenue Share (%), by Application 2025 & 2033
- Figure 28: Asia Pacific Rheology Control Additives Revenue (undefined), by Types 2025 & 2033
- Figure 29: Asia Pacific Rheology Control Additives Revenue Share (%), by Types 2025 & 2033
- Figure 30: Asia Pacific Rheology Control Additives Revenue (undefined), by Country 2025 & 2033
- Figure 31: Asia Pacific Rheology Control Additives Revenue Share (%), by Country 2025 & 2033
List of Tables
- Table 1: Global Rheology Control Additives Revenue undefined Forecast, by Application 2020 & 2033
- Table 2: Global Rheology Control Additives Revenue undefined Forecast, by Types 2020 & 2033
- Table 3: Global Rheology Control Additives Revenue undefined Forecast, by Region 2020 & 2033
- Table 4: Global Rheology Control Additives Revenue undefined Forecast, by Application 2020 & 2033
- Table 5: Global Rheology Control Additives Revenue undefined Forecast, by Types 2020 & 2033
- Table 6: Global Rheology Control Additives Revenue undefined Forecast, by Country 2020 & 2033
- Table 7: United States Rheology Control Additives Revenue (undefined) Forecast, by Application 2020 & 2033
- Table 8: Canada Rheology Control Additives Revenue (undefined) Forecast, by Application 2020 & 2033
- Table 9: Mexico Rheology Control Additives Revenue (undefined) Forecast, by Application 2020 & 2033
- Table 10: Global Rheology Control Additives Revenue undefined Forecast, by Application 2020 & 2033
- Table 11: Global Rheology Control Additives Revenue undefined Forecast, by Types 2020 & 2033
- Table 12: Global Rheology Control Additives Revenue undefined Forecast, by Country 2020 & 2033
- Table 13: Brazil Rheology Control Additives Revenue (undefined) Forecast, by Application 2020 & 2033
- Table 14: Argentina Rheology Control Additives Revenue (undefined) Forecast, by Application 2020 & 2033
- Table 15: Rest of South America Rheology Control Additives Revenue (undefined) Forecast, by Application 2020 & 2033
- Table 16: Global Rheology Control Additives Revenue undefined Forecast, by Application 2020 & 2033
- Table 17: Global Rheology Control Additives Revenue undefined Forecast, by Types 2020 & 2033
- Table 18: Global Rheology Control Additives Revenue undefined Forecast, by Country 2020 & 2033
- Table 19: United Kingdom Rheology Control Additives Revenue (undefined) Forecast, by Application 2020 & 2033
- Table 20: Germany Rheology Control Additives Revenue (undefined) Forecast, by Application 2020 & 2033
- Table 21: France Rheology Control Additives Revenue (undefined) Forecast, by Application 2020 & 2033
- Table 22: Italy Rheology Control Additives Revenue (undefined) Forecast, by Application 2020 & 2033
- Table 23: Spain Rheology Control Additives Revenue (undefined) Forecast, by Application 2020 & 2033
- Table 24: Russia Rheology Control Additives Revenue (undefined) Forecast, by Application 2020 & 2033
- Table 25: Benelux Rheology Control Additives Revenue (undefined) Forecast, by Application 2020 & 2033
- Table 26: Nordics Rheology Control Additives Revenue (undefined) Forecast, by Application 2020 & 2033
- Table 27: Rest of Europe Rheology Control Additives Revenue (undefined) Forecast, by Application 2020 & 2033
- Table 28: Global Rheology Control Additives Revenue undefined Forecast, by Application 2020 & 2033
- Table 29: Global Rheology Control Additives Revenue undefined Forecast, by Types 2020 & 2033
- Table 30: Global Rheology Control Additives Revenue undefined Forecast, by Country 2020 & 2033
- Table 31: Turkey Rheology Control Additives Revenue (undefined) Forecast, by Application 2020 & 2033
- Table 32: Israel Rheology Control Additives Revenue (undefined) Forecast, by Application 2020 & 2033
- Table 33: GCC Rheology Control Additives Revenue (undefined) Forecast, by Application 2020 & 2033
- Table 34: North Africa Rheology Control Additives Revenue (undefined) Forecast, by Application 2020 & 2033
- Table 35: South Africa Rheology Control Additives Revenue (undefined) Forecast, by Application 2020 & 2033
- Table 36: Rest of Middle East & Africa Rheology Control Additives Revenue (undefined) Forecast, by Application 2020 & 2033
- Table 37: Global Rheology Control Additives Revenue undefined Forecast, by Application 2020 & 2033
- Table 38: Global Rheology Control Additives Revenue undefined Forecast, by Types 2020 & 2033
- Table 39: Global Rheology Control Additives Revenue undefined Forecast, by Country 2020 & 2033
- Table 40: China Rheology Control Additives Revenue (undefined) Forecast, by Application 2020 & 2033
- Table 41: India Rheology Control Additives Revenue (undefined) Forecast, by Application 2020 & 2033
- Table 42: Japan Rheology Control Additives Revenue (undefined) Forecast, by Application 2020 & 2033
- Table 43: South Korea Rheology Control Additives Revenue (undefined) Forecast, by Application 2020 & 2033
- Table 44: ASEAN Rheology Control Additives Revenue (undefined) Forecast, by Application 2020 & 2033
- Table 45: Oceania Rheology Control Additives Revenue (undefined) Forecast, by Application 2020 & 2033
- Table 46: Rest of Asia Pacific Rheology Control Additives Revenue (undefined) Forecast, by Application 2020 & 2033
Frequently Asked Questions
1. What is the projected Compound Annual Growth Rate (CAGR) of the Rheology Control Additives?
The projected CAGR is approximately 4.5%.
2. Which companies are prominent players in the Rheology Control Additives?
Key companies in the market include Lubrizol, Vanderbilt Holding Company, Inc., K-tech Limited, Ciba Inc, Skyfield Minerals Pvt. Ltd., Evonik Industries, Arkema Coating Resins, Lucid Colloids Ltd, Devine Chemicals Ltd, Eastman, KITO.
3. What are the main segments of the Rheology Control Additives?
The market segments include Application, Types.
4. Can you provide details about the market size?
The market size is estimated to be USD XXX N/A as of 2022.
5. What are some drivers contributing to market growth?
N/A
6. What are the notable trends driving market growth?
N/A
7. Are there any restraints impacting market growth?
N/A
8. Can you provide examples of recent developments in the market?
N/A
9. What pricing options are available for accessing the report?
Pricing options include single-user, multi-user, and enterprise licenses priced at USD 2900.00, USD 4350.00, and USD 5800.00 respectively.
10. Is the market size provided in terms of value or volume?
The market size is provided in terms of value, measured in N/A.
11. Are there any specific market keywords associated with the report?
Yes, the market keyword associated with the report is "Rheology Control Additives," which aids in identifying and referencing the specific market segment covered.
12. How do I determine which pricing option suits my needs best?
The pricing options vary based on user requirements and access needs. Individual users may opt for single-user licenses, while businesses requiring broader access may choose multi-user or enterprise licenses for cost-effective access to the report.
13. Are there any additional resources or data provided in the Rheology Control Additives report?
While the report offers comprehensive insights, it's advisable to review the specific contents or supplementary materials provided to ascertain if additional resources or data are available.
14. How can I stay updated on further developments or reports in the Rheology Control Additives?
To stay informed about further developments, trends, and reports in the Rheology Control Additives, consider subscribing to industry newsletters, following relevant companies and organizations, or regularly checking reputable industry news sources and publications.
Methodology
Step 1 - Identification of Relevant Samples Size from Population Database


Step 2 - Approaches for Defining Global Market Size (Value, Volume* & Price*)

Note*: In applicable scenarios
Step 3 - Data Sources
Primary Research
- Web Analytics
- Survey Reports
- Research Institute
- Latest Research Reports
- Opinion Leaders
Secondary Research
- Annual Reports
- White Paper
- Latest Press Release
- Industry Association
- Paid Database
- Investor Presentations

Step 4 - Data Triangulation
Involves using different sources of information in order to increase the validity of a study
These sources are likely to be stakeholders in a program - participants, other researchers, program staff, other community members, and so on.
Then we put all data in single framework & apply various statistical tools to find out the dynamic on the market.
During the analysis stage, feedback from the stakeholder groups would be compared to determine areas of agreement as well as areas of divergence