

Key Insights
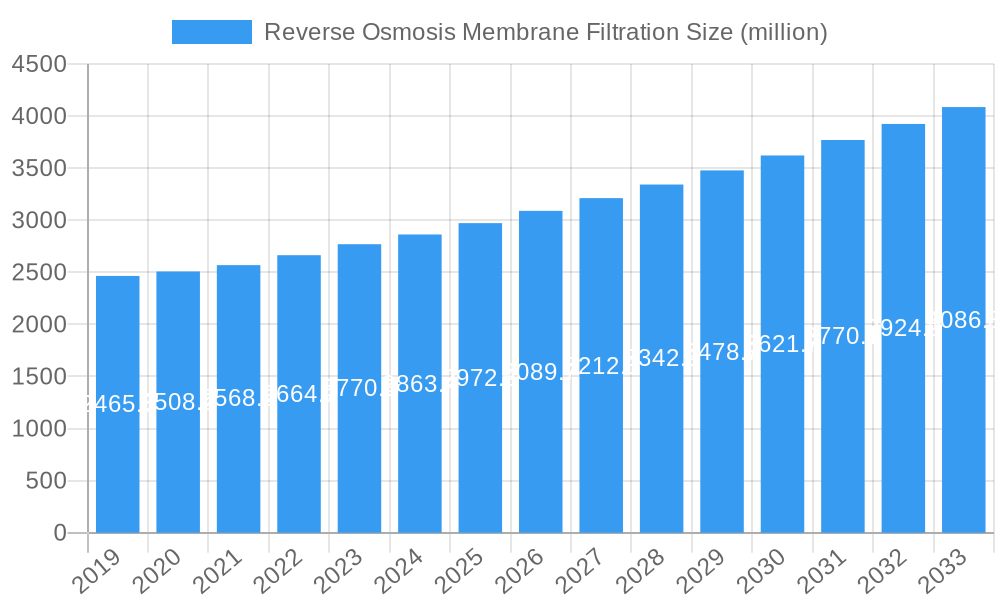
The global Reverse Osmosis (RO) Membrane Filtration market is poised for significant expansion, valued at USD 2863.4 million in 2025 and projected to grow at a Compound Annual Growth Rate (CAGR) of 4.1% through 2033. This robust growth is propelled by escalating global demand for clean water, driven by increasing population, industrialization, and the growing scarcity of freshwater resources. Desalination applications represent a major growth engine, as coastal regions and water-stressed areas increasingly rely on RO technology to convert seawater and brackish water into potable water. The food and beverage sector also contributes substantially, utilizing RO for purification, concentration, and ingredient processing to meet stringent quality and safety standards. Pharmaceutical applications, where high-purity water is critical for drug manufacturing and research, further underscore the market’s upward trajectory.
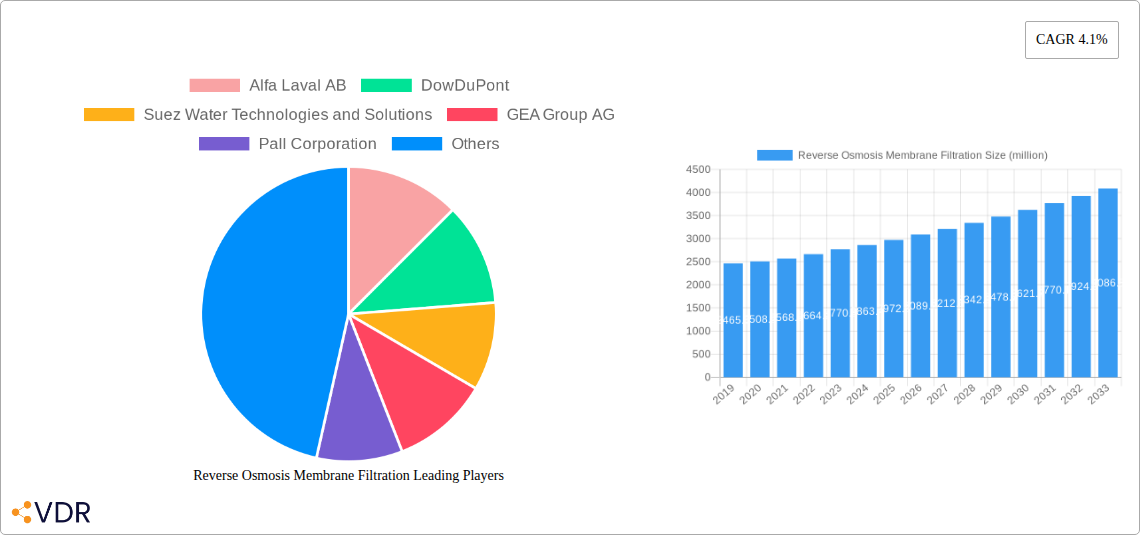
Reverse Osmosis Membrane Filtration Market Size (In Billion)
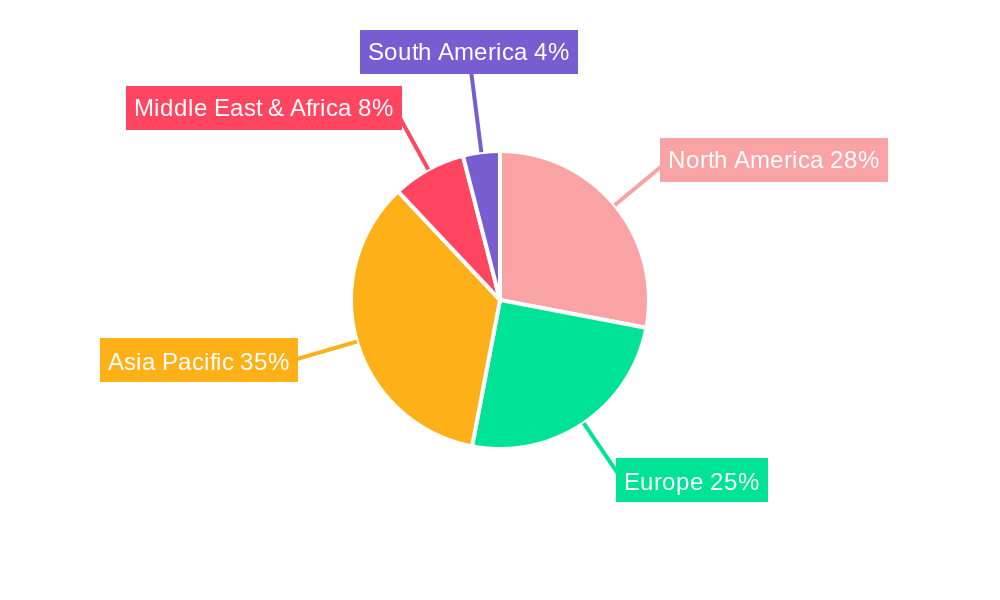
Emerging trends such as the development of advanced nano-composite membranes with enhanced flux and rejection rates, coupled with increased focus on energy-efficient RO systems, are shaping the market landscape. Leading players like Alfa Laval AB, DowDuPont, Suez Water Technologies and Solutions, and Toray Industries Inc. are actively investing in research and development to innovate and capture market share. Geographically, Asia Pacific, particularly China and India, is anticipated to witness rapid growth due to expanding industrial infrastructure and a substantial population requiring access to safe drinking water. North America and Europe are established markets with a strong emphasis on upgrading existing water treatment facilities and adopting advanced RO solutions. While market growth is strong, challenges such as the high energy consumption of some RO processes and the disposal of brine concentrate require ongoing technological advancements and strategic solutions from market participants.
Reverse Osmosis Membrane Filtration Company Market Share
Reverse Osmosis Membrane Filtration: Navigating a Thriving Global Market
This comprehensive report provides an in-depth analysis of the global Reverse Osmosis (RO) Membrane Filtration market, covering market dynamics, growth trends, regional dominance, product landscape, key drivers, barriers, emerging opportunities, growth accelerators, key players, notable milestones, and a future market outlook. The study encompasses the historical period of 2019-2024, with the base year set at 2025, and projects significant growth through to 2033. The analysis integrates high-traffic keywords such as "RO membrane filtration," "water purification technology," "desalination solutions," "industrial water treatment," and "membrane technology advancements" to maximize search engine visibility and attract industry professionals. We also delve into the parent and child market segments, providing a holistic view of the value chain and growth opportunities.
Reverse Osmosis Membrane Filtration Market Dynamics & Structure
The global Reverse Osmosis Membrane Filtration market is characterized by a moderately consolidated structure, with leading players like DowDuPont, Suez Water Technologies and Solutions, Veolia, Toray Industries Inc., and Koch Membrane Systems Inc. holding significant market share, estimated to be around 65% collectively in 2025. Technological innovation is a primary driver, with a continuous focus on developing high-rejection, low-pressure RO membranes, and advancements in anti-fouling coatings to improve performance and reduce operational costs. Regulatory frameworks, particularly those focused on water quality standards and environmental protection, are increasingly shaping market demands. Competitive product substitutes include Nanofiltration and Ultrafiltration, though RO membranes offer superior salt rejection. End-user demographics are shifting towards industrial and municipal sectors demanding higher purity water, with a notable increase in demand from developing economies. Mergers and Acquisitions (M&A) activity is steady, with an estimated 35 M&A deals in the historical period (2019-2024), primarily focused on expanding product portfolios and geographic reach.
- Market Concentration: Moderately consolidated with significant presence of key global players.
- Technological Innovation Drivers: Development of energy-efficient membranes, improved fouling resistance, and enhanced durability.
- Regulatory Frameworks: Stringent water quality standards and increasing environmental regulations are boosting demand.
- Competitive Product Substitutes: Ultrafiltration and Nanofiltration offer alternative solutions for specific purity requirements.
- End-User Demographics: Growing demand from industrial, municipal, and commercial sectors globally.
- M&A Trends: Strategic acquisitions to broaden product offerings and market presence, with an estimated 35 deals between 2019-2024.
Reverse Osmosis Membrane Filtration Growth Trends & Insights
The global Reverse Osmosis (RO) Membrane Filtration market is projected to experience robust growth, driven by escalating global water scarcity, increasing industrialization, and stringent environmental regulations. The market size is estimated to reach approximately $14.5 billion in 2025, with a projected Compound Annual Growth Rate (CAGR) of 7.8% from 2025 to 2033. This expansion is fueled by the growing adoption of RO technology in desalination plants to address freshwater deficits, particularly in arid regions. In the Food and Beverage sector, RO is essential for producing high-purity water for processing and product formulation, contributing to a significant market share. The Pharmaceutical industry relies heavily on RO for producing ultrapure water required for drug manufacturing and sterile processing. The Power Generation sector utilizes RO membranes for boiler feedwater treatment to prevent scaling and corrosion, ensuring operational efficiency. Furthermore, the Chemical and Petrochemical industries employ RO for process water purification and wastewater treatment. The Electronic Component Manufacturing sector demands extremely high-purity water for semiconductor fabrication, a niche but high-value application.
Technological disruptions are key growth enablers. Innovations in Thin Film Composite (TFC) membranes, such as improved permselectivity and reduced energy consumption, are enhancing RO system efficiency. The development of Nano-Composite Membranes with tailored pore structures and enhanced surface properties is also contributing to market expansion. Consumer behavior shifts are evident, with an increasing awareness of water quality and a preference for sustainably sourced and purified water products. The demand for point-of-use RO systems in residential and commercial settings is also on the rise. Adoption rates are high in developed nations with advanced water infrastructure, while emerging economies are rapidly increasing their adoption due to growing water challenges and infrastructural development. The market penetration of RO membrane filtration is estimated to be around 45% globally in 2025, with significant room for growth in untapped regions and applications.
Dominant Regions, Countries, or Segments in Reverse Osmosis Membrane Filtration
The Asia-Pacific region is projected to be the dominant force in the global Reverse Osmosis (RO) Membrane Filtration market, driven by a confluence of rapidly expanding economies, increasing industrialization, and significant investments in water infrastructure development. Countries like China and India are leading this growth, with their vast populations and burgeoning manufacturing sectors creating immense demand for purified water across various applications. Specifically, China stands out as a major contributor, accounting for an estimated 30% of the regional market share in 2025, due to its extensive investments in desalination, industrial water treatment, and stringent environmental policies.
Within the Application segments, Desalination is a primary growth engine, particularly in regions like the Middle East and North Africa, where water scarcity is a critical issue. The global market for RO in desalination is projected to reach $5.2 billion in 2025. This segment is propelled by government initiatives to secure freshwater resources and advancements in energy-efficient desalination technologies. The Food and Beverage sector also represents a substantial application, with an estimated market value of $2.5 billion in 2025, driven by the need for high-purity water in food processing, beverage production, and packaging.
In terms of Types, Thin Film Composite (TFC) Membranes are the dominant category, holding an estimated 70% of the global market share in 2025. This dominance is attributed to their superior performance characteristics, including high rejection rates, excellent chemical stability, and cost-effectiveness. The continuous innovation in TFC membrane technology, leading to improved flux and reduced energy consumption, further solidifies its leading position. The Chemical and Petrochemical industry, with an estimated market size of $1.8 billion in 2025, is another significant application area, fueled by the need for process water purification and stringent wastewater discharge regulations.
- Dominant Region: Asia-Pacific, with China leading the market.
- Leading Application: Desalination and Food & Beverage sectors.
- Dominant Membrane Type: Thin Film Composite (TFC) Membranes.
- Key Drivers: Water scarcity, industrial growth, stringent regulations, technological advancements.
- Market Share Insights: TFC membranes hold approximately 70% market share.
Reverse Osmosis Membrane Filtration Product Landscape
The Reverse Osmosis Membrane Filtration product landscape is characterized by continuous innovation focused on enhancing efficiency, durability, and sustainability. Leading companies are actively developing advanced Thin Film Composite (TFC) membranes with superior salt rejection and lower operating pressures, contributing to energy savings. Innovations include the incorporation of novel polymers and selective layers to improve flux and reduce fouling. Nano-Composite membranes are emerging with tailored pore structures for specific separation challenges. Applications range from large-scale industrial water treatment and desalination to specialized uses in the pharmaceutical and electronics industries, demanding ultra-high purity water. Performance metrics such as flux rate, rejection rate, and fouling resistance are key differentiators. Unique selling propositions often revolve around energy efficiency, reduced chemical usage, and longer membrane lifespan.
Key Drivers, Barriers & Challenges in Reverse Osmosis Membrane Filtration
The global Reverse Osmosis (RO) Membrane Filtration market is propelled by several key drivers. Escalating global water scarcity due to climate change and population growth is a primary catalyst, increasing the demand for desalination and water reuse technologies. Stringent environmental regulations mandating higher water quality standards for industrial discharge and consumption also fuel market expansion. Technological advancements, particularly in energy-efficient membranes and improved fouling resistance, are making RO systems more economically viable and attractive. The growing need for high-purity water in industries like pharmaceuticals, food and beverage, and electronics further contributes to market growth.
Key challenges and restraints in the RO membrane filtration market include the high initial capital cost of RO systems, particularly for large-scale desalination projects. The issue of membrane fouling remains a significant operational hurdle, necessitating regular cleaning and replacement, which adds to operational expenses. Energy consumption, although improving with technological advancements, can still be a limiting factor in certain applications and regions. Disposal of the concentrated brine byproduct from desalination processes also poses environmental concerns and regulatory complexities. Supply chain disruptions and the availability of raw materials for membrane manufacturing can impact production costs and lead times. Competitive pressures from other water treatment technologies, such as Ultrafiltration and Nanofiltration, also present a challenge, especially in applications where the highest level of purity is not strictly required.
Emerging Opportunities in Reverse Osmosis Membrane Filtration
Emerging opportunities in the Reverse Osmosis (RO) Membrane Filtration sector are abundant, driven by technological advancements and evolving global needs. The growing demand for decentralized water treatment solutions, particularly in developing regions and for remote industrial sites, presents a significant untapped market. Innovations in hybrid membrane systems that combine RO with other separation technologies to optimize performance and reduce energy consumption are gaining traction. The development of bio-fouling resistant membranes and smart membranes with integrated sensing capabilities offers avenues for improved operational efficiency and predictive maintenance. Furthermore, the increasing focus on water reuse and circular economy principles is creating substantial opportunities for RO in treating industrial wastewater and municipal effluent for various non-potable applications. The rising adoption of RO in niche sectors like the production of ultrapure water for the semiconductor and advanced battery manufacturing industries also presents high-growth potential.
Growth Accelerators in the Reverse Osmosis Membrane Filtration Industry
Several factors are accelerating long-term growth in the Reverse Osmosis (RO) Membrane Filtration industry. Strategic partnerships and collaborations between membrane manufacturers and system integrators are fostering innovation and facilitating market penetration into new geographies and applications. Technological breakthroughs in materials science, leading to the development of novel polymers and nanocomposite materials for RO membranes, are enhancing performance and reducing operational costs, making RO more competitive. Government incentives and supportive policies aimed at addressing water scarcity and promoting sustainable water management practices are significant growth accelerators. The increasing global focus on industrial water efficiency and the reduction of water footprints across manufacturing sectors also drives demand for advanced RO solutions. Furthermore, the expanding market for portable and energy-efficient RO systems for residential use, driven by consumer demand for clean drinking water, is a key growth stimulant.
Key Players Shaping the Reverse Osmosis Membrane Filtration Market
- Alfa Laval AB
- DowDuPont
- Suez Water Technologies and Solutions
- GEA Group AG
- Pall Corporation
- 3M Company
- Koch Membrane Systems Inc.
- Veolia
- SPX Flow
- Toray Industries Inc.
- Nitto Group Company
- LG Chem
- Axeon Water Technologies
- Lanxess AG
- Toyobo Co. Ltd.
- AMPAC USA
- Novasep
Notable Milestones in Reverse Osmosis Membrane Filtration Sector
- 2019: Launch of advanced TFC membranes with enhanced fouling resistance by Toray Industries Inc.
- 2020: Suez Water Technologies and Solutions acquired by Veolia, strengthening its position in water treatment.
- 2021: DowDuPont introduced new generation RO membranes with improved energy efficiency.
- 2022: Koch Membrane Systems Inc. partnered with a leading desalination provider for a mega-project in the Middle East.
- 2023: GEA Group AG expanded its membrane portfolio with a focus on industrial water reuse applications.
- 2024 (Q1): Pall Corporation announced advancements in nano-composite membranes for high-purity applications.
- 2024 (Q2): 3M Company launched a new line of RO membranes with extended lifespan and reduced operational costs.
In-Depth Reverse Osmosis Membrane Filtration Market Outlook
The future market outlook for Reverse Osmosis (RO) Membrane Filtration is exceptionally positive, characterized by sustained growth driven by escalating global water challenges and continuous technological innovation. Growth accelerators such as the development of highly energy-efficient membranes, smart filtration systems with predictive analytics, and the increasing focus on sustainable water management practices will further propel market expansion. Strategic opportunities lie in addressing water scarcity in emerging economies, expanding applications in the circular economy for water reuse, and catering to the ultra-high purity water demands of advanced manufacturing sectors. The market is poised for significant advancements in membrane material science and system design, ensuring its continued relevance and growth in providing critical water purification solutions worldwide.
Reverse Osmosis Membrane Filtration Segmentation
-
1. Application
- 1.1. Desalination
- 1.2. Food and Beverage
- 1.3. Pharmaceutical
- 1.4. Power Generation
- 1.5. Chemical and Petrochemical
- 1.6. Electronic Component Manufacturing
- 1.7. Others
-
2. Types
- 2.1. Thin Film Composite (TFC) Membranes
- 2.2. Cellulose Acetate (CA) Membranes
- 2.3. Nano-Composite Membranes
- 2.4. Others
Reverse Osmosis Membrane Filtration Segmentation By Geography
-
1. North America
- 1.1. United States
- 1.2. Canada
- 1.3. Mexico
-
2. South America
- 2.1. Brazil
- 2.2. Argentina
- 2.3. Rest of South America
-
3. Europe
- 3.1. United Kingdom
- 3.2. Germany
- 3.3. France
- 3.4. Italy
- 3.5. Spain
- 3.6. Russia
- 3.7. Benelux
- 3.8. Nordics
- 3.9. Rest of Europe
-
4. Middle East & Africa
- 4.1. Turkey
- 4.2. Israel
- 4.3. GCC
- 4.4. North Africa
- 4.5. South Africa
- 4.6. Rest of Middle East & Africa
-
5. Asia Pacific
- 5.1. China
- 5.2. India
- 5.3. Japan
- 5.4. South Korea
- 5.5. ASEAN
- 5.6. Oceania
- 5.7. Rest of Asia Pacific
Reverse Osmosis Membrane Filtration Regional Market Share
Geographic Coverage of Reverse Osmosis Membrane Filtration
Reverse Osmosis Membrane Filtration REPORT HIGHLIGHTS
| Aspects | Details |
|---|---|
| Study Period | 2020-2034 |
| Base Year | 2025 |
| Estimated Year | 2026 |
| Forecast Period | 2026-2034 |
| Historical Period | 2020-2025 |
| Growth Rate | CAGR of 4.1% from 2020-2034 |
| Segmentation |
|
Table of Contents
- 1. Introduction
- 1.1. Research Scope
- 1.2. Market Segmentation
- 1.3. Research Objective
- 1.4. Definitions and Assumptions
- 2. Executive Summary
- 2.1. Market Snapshot
- 3. Market Dynamics
- 3.1. Market Drivers
- 3.2. Market Restrains
- 3.3. Market Trends
- 3.4. Market Opportunities
- 4. Market Factor Analysis
- 4.1. Porters Five Forces
- 4.1.1. Bargaining Power of Suppliers
- 4.1.2. Bargaining Power of Buyers
- 4.1.3. Threat of New Entrants
- 4.1.4. Threat of Substitutes
- 4.1.5. Competitive Rivalry
- 4.2. PESTEL analysis
- 4.3. BCG Analysis
- 4.3.1. Stars (High Growth, High Market Share)
- 4.3.2. Cash Cows (Low Growth, High Market Share)
- 4.3.3. Question Mark (High Growth, Low Market Share)
- 4.3.4. Dogs (Low Growth, Low Market Share)
- 4.4. Ansoff Matrix Analysis
- 4.5. Supply Chain Analysis
- 4.6. Regulatory Landscape
- 4.7. Current Market Potential and Opportunity Assessment (TAM–SAM–SOM Framework)
- 4.8. VDR Analyst Note
- 4.1. Porters Five Forces
- 5. Market Analysis, Insights and Forecast 2021-2033
- 5.1. Market Analysis, Insights and Forecast - by Application
- 5.1.1. Desalination
- 5.1.2. Food and Beverage
- 5.1.3. Pharmaceutical
- 5.1.4. Power Generation
- 5.1.5. Chemical and Petrochemical
- 5.1.6. Electronic Component Manufacturing
- 5.1.7. Others
- 5.2. Market Analysis, Insights and Forecast - by Types
- 5.2.1. Thin Film Composite (TFC) Membranes
- 5.2.2. Cellulose Acetate (CA) Membranes
- 5.2.3. Nano-Composite Membranes
- 5.2.4. Others
- 5.3. Market Analysis, Insights and Forecast - by Region
- 5.3.1. North America
- 5.3.2. South America
- 5.3.3. Europe
- 5.3.4. Middle East & Africa
- 5.3.5. Asia Pacific
- 5.1. Market Analysis, Insights and Forecast - by Application
- 6. Global Reverse Osmosis Membrane Filtration Analysis, Insights and Forecast, 2021-2033
- 6.1. Market Analysis, Insights and Forecast - by Application
- 6.1.1. Desalination
- 6.1.2. Food and Beverage
- 6.1.3. Pharmaceutical
- 6.1.4. Power Generation
- 6.1.5. Chemical and Petrochemical
- 6.1.6. Electronic Component Manufacturing
- 6.1.7. Others
- 6.2. Market Analysis, Insights and Forecast - by Types
- 6.2.1. Thin Film Composite (TFC) Membranes
- 6.2.2. Cellulose Acetate (CA) Membranes
- 6.2.3. Nano-Composite Membranes
- 6.2.4. Others
- 6.1. Market Analysis, Insights and Forecast - by Application
- 7. North America Reverse Osmosis Membrane Filtration Analysis, Insights and Forecast, 2021-2033
- 7.1. Market Analysis, Insights and Forecast - by Application
- 7.1.1. Desalination
- 7.1.2. Food and Beverage
- 7.1.3. Pharmaceutical
- 7.1.4. Power Generation
- 7.1.5. Chemical and Petrochemical
- 7.1.6. Electronic Component Manufacturing
- 7.1.7. Others
- 7.2. Market Analysis, Insights and Forecast - by Types
- 7.2.1. Thin Film Composite (TFC) Membranes
- 7.2.2. Cellulose Acetate (CA) Membranes
- 7.2.3. Nano-Composite Membranes
- 7.2.4. Others
- 7.1. Market Analysis, Insights and Forecast - by Application
- 8. South America Reverse Osmosis Membrane Filtration Analysis, Insights and Forecast, 2021-2033
- 8.1. Market Analysis, Insights and Forecast - by Application
- 8.1.1. Desalination
- 8.1.2. Food and Beverage
- 8.1.3. Pharmaceutical
- 8.1.4. Power Generation
- 8.1.5. Chemical and Petrochemical
- 8.1.6. Electronic Component Manufacturing
- 8.1.7. Others
- 8.2. Market Analysis, Insights and Forecast - by Types
- 8.2.1. Thin Film Composite (TFC) Membranes
- 8.2.2. Cellulose Acetate (CA) Membranes
- 8.2.3. Nano-Composite Membranes
- 8.2.4. Others
- 8.1. Market Analysis, Insights and Forecast - by Application
- 9. Europe Reverse Osmosis Membrane Filtration Analysis, Insights and Forecast, 2021-2033
- 9.1. Market Analysis, Insights and Forecast - by Application
- 9.1.1. Desalination
- 9.1.2. Food and Beverage
- 9.1.3. Pharmaceutical
- 9.1.4. Power Generation
- 9.1.5. Chemical and Petrochemical
- 9.1.6. Electronic Component Manufacturing
- 9.1.7. Others
- 9.2. Market Analysis, Insights and Forecast - by Types
- 9.2.1. Thin Film Composite (TFC) Membranes
- 9.2.2. Cellulose Acetate (CA) Membranes
- 9.2.3. Nano-Composite Membranes
- 9.2.4. Others
- 9.1. Market Analysis, Insights and Forecast - by Application
- 10. Middle East & Africa Reverse Osmosis Membrane Filtration Analysis, Insights and Forecast, 2021-2033
- 10.1. Market Analysis, Insights and Forecast - by Application
- 10.1.1. Desalination
- 10.1.2. Food and Beverage
- 10.1.3. Pharmaceutical
- 10.1.4. Power Generation
- 10.1.5. Chemical and Petrochemical
- 10.1.6. Electronic Component Manufacturing
- 10.1.7. Others
- 10.2. Market Analysis, Insights and Forecast - by Types
- 10.2.1. Thin Film Composite (TFC) Membranes
- 10.2.2. Cellulose Acetate (CA) Membranes
- 10.2.3. Nano-Composite Membranes
- 10.2.4. Others
- 10.1. Market Analysis, Insights and Forecast - by Application
- 11. Asia Pacific Reverse Osmosis Membrane Filtration Analysis, Insights and Forecast, 2021-2033
- 11.1. Market Analysis, Insights and Forecast - by Application
- 11.1.1. Desalination
- 11.1.2. Food and Beverage
- 11.1.3. Pharmaceutical
- 11.1.4. Power Generation
- 11.1.5. Chemical and Petrochemical
- 11.1.6. Electronic Component Manufacturing
- 11.1.7. Others
- 11.2. Market Analysis, Insights and Forecast - by Types
- 11.2.1. Thin Film Composite (TFC) Membranes
- 11.2.2. Cellulose Acetate (CA) Membranes
- 11.2.3. Nano-Composite Membranes
- 11.2.4. Others
- 11.1. Market Analysis, Insights and Forecast - by Application
- 12. Competitive Analysis
- 12.1. Company Profiles
- 12.1.1 Alfa Laval AB
- 12.1.1.1. Company Overview
- 12.1.1.2. Products
- 12.1.1.3. Company Financials
- 12.1.1.4. SWOT Analysis
- 12.1.2 DowDuPont
- 12.1.2.1. Company Overview
- 12.1.2.2. Products
- 12.1.2.3. Company Financials
- 12.1.2.4. SWOT Analysis
- 12.1.3 Suez Water Technologies and Solutions
- 12.1.3.1. Company Overview
- 12.1.3.2. Products
- 12.1.3.3. Company Financials
- 12.1.3.4. SWOT Analysis
- 12.1.4 GEA Group AG
- 12.1.4.1. Company Overview
- 12.1.4.2. Products
- 12.1.4.3. Company Financials
- 12.1.4.4. SWOT Analysis
- 12.1.5 Pall Corporation
- 12.1.5.1. Company Overview
- 12.1.5.2. Products
- 12.1.5.3. Company Financials
- 12.1.5.4. SWOT Analysis
- 12.1.6 3M Company
- 12.1.6.1. Company Overview
- 12.1.6.2. Products
- 12.1.6.3. Company Financials
- 12.1.6.4. SWOT Analysis
- 12.1.7 Koch Membrane Systems Inc
- 12.1.7.1. Company Overview
- 12.1.7.2. Products
- 12.1.7.3. Company Financials
- 12.1.7.4. SWOT Analysis
- 12.1.8 Veolia
- 12.1.8.1. Company Overview
- 12.1.8.2. Products
- 12.1.8.3. Company Financials
- 12.1.8.4. SWOT Analysis
- 12.1.9 SPX Flow
- 12.1.9.1. Company Overview
- 12.1.9.2. Products
- 12.1.9.3. Company Financials
- 12.1.9.4. SWOT Analysis
- 12.1.10 Toray Industries Inc.
- 12.1.10.1. Company Overview
- 12.1.10.2. Products
- 12.1.10.3. Company Financials
- 12.1.10.4. SWOT Analysis
- 12.1.11 Nitto Group Company
- 12.1.11.1. Company Overview
- 12.1.11.2. Products
- 12.1.11.3. Company Financials
- 12.1.11.4. SWOT Analysis
- 12.1.12 LG Chem
- 12.1.12.1. Company Overview
- 12.1.12.2. Products
- 12.1.12.3. Company Financials
- 12.1.12.4. SWOT Analysis
- 12.1.13 Axeon Water Technologies
- 12.1.13.1. Company Overview
- 12.1.13.2. Products
- 12.1.13.3. Company Financials
- 12.1.13.4. SWOT Analysis
- 12.1.14 Lanxess AG
- 12.1.14.1. Company Overview
- 12.1.14.2. Products
- 12.1.14.3. Company Financials
- 12.1.14.4. SWOT Analysis
- 12.1.15 Toyobo Co. Ltd.
- 12.1.15.1. Company Overview
- 12.1.15.2. Products
- 12.1.15.3. Company Financials
- 12.1.15.4. SWOT Analysis
- 12.1.16 AMPAC USA
- 12.1.16.1. Company Overview
- 12.1.16.2. Products
- 12.1.16.3. Company Financials
- 12.1.16.4. SWOT Analysis
- 12.1.17 Novasep
- 12.1.17.1. Company Overview
- 12.1.17.2. Products
- 12.1.17.3. Company Financials
- 12.1.17.4. SWOT Analysis
- 12.1.1 Alfa Laval AB
- 12.2. Market Entropy
- 12.2.1 Company's Key Areas Served
- 12.2.2 Recent Developments
- 12.3. Company Market Share Analysis 2025
- 12.3.1 Top 5 Companies Market Share Analysis
- 12.3.2 Top 3 Companies Market Share Analysis
- 12.4. List of Potential Customers
- 13. Research Methodology
List of Figures
- Figure 1: Global Reverse Osmosis Membrane Filtration Revenue Breakdown (million, %) by Region 2025 & 2033
- Figure 2: Global Reverse Osmosis Membrane Filtration Volume Breakdown (K, %) by Region 2025 & 2033
- Figure 3: North America Reverse Osmosis Membrane Filtration Revenue (million), by Application 2025 & 2033
- Figure 4: North America Reverse Osmosis Membrane Filtration Volume (K), by Application 2025 & 2033
- Figure 5: North America Reverse Osmosis Membrane Filtration Revenue Share (%), by Application 2025 & 2033
- Figure 6: North America Reverse Osmosis Membrane Filtration Volume Share (%), by Application 2025 & 2033
- Figure 7: North America Reverse Osmosis Membrane Filtration Revenue (million), by Types 2025 & 2033
- Figure 8: North America Reverse Osmosis Membrane Filtration Volume (K), by Types 2025 & 2033
- Figure 9: North America Reverse Osmosis Membrane Filtration Revenue Share (%), by Types 2025 & 2033
- Figure 10: North America Reverse Osmosis Membrane Filtration Volume Share (%), by Types 2025 & 2033
- Figure 11: North America Reverse Osmosis Membrane Filtration Revenue (million), by Country 2025 & 2033
- Figure 12: North America Reverse Osmosis Membrane Filtration Volume (K), by Country 2025 & 2033
- Figure 13: North America Reverse Osmosis Membrane Filtration Revenue Share (%), by Country 2025 & 2033
- Figure 14: North America Reverse Osmosis Membrane Filtration Volume Share (%), by Country 2025 & 2033
- Figure 15: South America Reverse Osmosis Membrane Filtration Revenue (million), by Application 2025 & 2033
- Figure 16: South America Reverse Osmosis Membrane Filtration Volume (K), by Application 2025 & 2033
- Figure 17: South America Reverse Osmosis Membrane Filtration Revenue Share (%), by Application 2025 & 2033
- Figure 18: South America Reverse Osmosis Membrane Filtration Volume Share (%), by Application 2025 & 2033
- Figure 19: South America Reverse Osmosis Membrane Filtration Revenue (million), by Types 2025 & 2033
- Figure 20: South America Reverse Osmosis Membrane Filtration Volume (K), by Types 2025 & 2033
- Figure 21: South America Reverse Osmosis Membrane Filtration Revenue Share (%), by Types 2025 & 2033
- Figure 22: South America Reverse Osmosis Membrane Filtration Volume Share (%), by Types 2025 & 2033
- Figure 23: South America Reverse Osmosis Membrane Filtration Revenue (million), by Country 2025 & 2033
- Figure 24: South America Reverse Osmosis Membrane Filtration Volume (K), by Country 2025 & 2033
- Figure 25: South America Reverse Osmosis Membrane Filtration Revenue Share (%), by Country 2025 & 2033
- Figure 26: South America Reverse Osmosis Membrane Filtration Volume Share (%), by Country 2025 & 2033
- Figure 27: Europe Reverse Osmosis Membrane Filtration Revenue (million), by Application 2025 & 2033
- Figure 28: Europe Reverse Osmosis Membrane Filtration Volume (K), by Application 2025 & 2033
- Figure 29: Europe Reverse Osmosis Membrane Filtration Revenue Share (%), by Application 2025 & 2033
- Figure 30: Europe Reverse Osmosis Membrane Filtration Volume Share (%), by Application 2025 & 2033
- Figure 31: Europe Reverse Osmosis Membrane Filtration Revenue (million), by Types 2025 & 2033
- Figure 32: Europe Reverse Osmosis Membrane Filtration Volume (K), by Types 2025 & 2033
- Figure 33: Europe Reverse Osmosis Membrane Filtration Revenue Share (%), by Types 2025 & 2033
- Figure 34: Europe Reverse Osmosis Membrane Filtration Volume Share (%), by Types 2025 & 2033
- Figure 35: Europe Reverse Osmosis Membrane Filtration Revenue (million), by Country 2025 & 2033
- Figure 36: Europe Reverse Osmosis Membrane Filtration Volume (K), by Country 2025 & 2033
- Figure 37: Europe Reverse Osmosis Membrane Filtration Revenue Share (%), by Country 2025 & 2033
- Figure 38: Europe Reverse Osmosis Membrane Filtration Volume Share (%), by Country 2025 & 2033
- Figure 39: Middle East & Africa Reverse Osmosis Membrane Filtration Revenue (million), by Application 2025 & 2033
- Figure 40: Middle East & Africa Reverse Osmosis Membrane Filtration Volume (K), by Application 2025 & 2033
- Figure 41: Middle East & Africa Reverse Osmosis Membrane Filtration Revenue Share (%), by Application 2025 & 2033
- Figure 42: Middle East & Africa Reverse Osmosis Membrane Filtration Volume Share (%), by Application 2025 & 2033
- Figure 43: Middle East & Africa Reverse Osmosis Membrane Filtration Revenue (million), by Types 2025 & 2033
- Figure 44: Middle East & Africa Reverse Osmosis Membrane Filtration Volume (K), by Types 2025 & 2033
- Figure 45: Middle East & Africa Reverse Osmosis Membrane Filtration Revenue Share (%), by Types 2025 & 2033
- Figure 46: Middle East & Africa Reverse Osmosis Membrane Filtration Volume Share (%), by Types 2025 & 2033
- Figure 47: Middle East & Africa Reverse Osmosis Membrane Filtration Revenue (million), by Country 2025 & 2033
- Figure 48: Middle East & Africa Reverse Osmosis Membrane Filtration Volume (K), by Country 2025 & 2033
- Figure 49: Middle East & Africa Reverse Osmosis Membrane Filtration Revenue Share (%), by Country 2025 & 2033
- Figure 50: Middle East & Africa Reverse Osmosis Membrane Filtration Volume Share (%), by Country 2025 & 2033
- Figure 51: Asia Pacific Reverse Osmosis Membrane Filtration Revenue (million), by Application 2025 & 2033
- Figure 52: Asia Pacific Reverse Osmosis Membrane Filtration Volume (K), by Application 2025 & 2033
- Figure 53: Asia Pacific Reverse Osmosis Membrane Filtration Revenue Share (%), by Application 2025 & 2033
- Figure 54: Asia Pacific Reverse Osmosis Membrane Filtration Volume Share (%), by Application 2025 & 2033
- Figure 55: Asia Pacific Reverse Osmosis Membrane Filtration Revenue (million), by Types 2025 & 2033
- Figure 56: Asia Pacific Reverse Osmosis Membrane Filtration Volume (K), by Types 2025 & 2033
- Figure 57: Asia Pacific Reverse Osmosis Membrane Filtration Revenue Share (%), by Types 2025 & 2033
- Figure 58: Asia Pacific Reverse Osmosis Membrane Filtration Volume Share (%), by Types 2025 & 2033
- Figure 59: Asia Pacific Reverse Osmosis Membrane Filtration Revenue (million), by Country 2025 & 2033
- Figure 60: Asia Pacific Reverse Osmosis Membrane Filtration Volume (K), by Country 2025 & 2033
- Figure 61: Asia Pacific Reverse Osmosis Membrane Filtration Revenue Share (%), by Country 2025 & 2033
- Figure 62: Asia Pacific Reverse Osmosis Membrane Filtration Volume Share (%), by Country 2025 & 2033
List of Tables
- Table 1: Global Reverse Osmosis Membrane Filtration Revenue million Forecast, by Application 2020 & 2033
- Table 2: Global Reverse Osmosis Membrane Filtration Volume K Forecast, by Application 2020 & 2033
- Table 3: Global Reverse Osmosis Membrane Filtration Revenue million Forecast, by Types 2020 & 2033
- Table 4: Global Reverse Osmosis Membrane Filtration Volume K Forecast, by Types 2020 & 2033
- Table 5: Global Reverse Osmosis Membrane Filtration Revenue million Forecast, by Region 2020 & 2033
- Table 6: Global Reverse Osmosis Membrane Filtration Volume K Forecast, by Region 2020 & 2033
- Table 7: Global Reverse Osmosis Membrane Filtration Revenue million Forecast, by Application 2020 & 2033
- Table 8: Global Reverse Osmosis Membrane Filtration Volume K Forecast, by Application 2020 & 2033
- Table 9: Global Reverse Osmosis Membrane Filtration Revenue million Forecast, by Types 2020 & 2033
- Table 10: Global Reverse Osmosis Membrane Filtration Volume K Forecast, by Types 2020 & 2033
- Table 11: Global Reverse Osmosis Membrane Filtration Revenue million Forecast, by Country 2020 & 2033
- Table 12: Global Reverse Osmosis Membrane Filtration Volume K Forecast, by Country 2020 & 2033
- Table 13: United States Reverse Osmosis Membrane Filtration Revenue (million) Forecast, by Application 2020 & 2033
- Table 14: United States Reverse Osmosis Membrane Filtration Volume (K) Forecast, by Application 2020 & 2033
- Table 15: Canada Reverse Osmosis Membrane Filtration Revenue (million) Forecast, by Application 2020 & 2033
- Table 16: Canada Reverse Osmosis Membrane Filtration Volume (K) Forecast, by Application 2020 & 2033
- Table 17: Mexico Reverse Osmosis Membrane Filtration Revenue (million) Forecast, by Application 2020 & 2033
- Table 18: Mexico Reverse Osmosis Membrane Filtration Volume (K) Forecast, by Application 2020 & 2033
- Table 19: Global Reverse Osmosis Membrane Filtration Revenue million Forecast, by Application 2020 & 2033
- Table 20: Global Reverse Osmosis Membrane Filtration Volume K Forecast, by Application 2020 & 2033
- Table 21: Global Reverse Osmosis Membrane Filtration Revenue million Forecast, by Types 2020 & 2033
- Table 22: Global Reverse Osmosis Membrane Filtration Volume K Forecast, by Types 2020 & 2033
- Table 23: Global Reverse Osmosis Membrane Filtration Revenue million Forecast, by Country 2020 & 2033
- Table 24: Global Reverse Osmosis Membrane Filtration Volume K Forecast, by Country 2020 & 2033
- Table 25: Brazil Reverse Osmosis Membrane Filtration Revenue (million) Forecast, by Application 2020 & 2033
- Table 26: Brazil Reverse Osmosis Membrane Filtration Volume (K) Forecast, by Application 2020 & 2033
- Table 27: Argentina Reverse Osmosis Membrane Filtration Revenue (million) Forecast, by Application 2020 & 2033
- Table 28: Argentina Reverse Osmosis Membrane Filtration Volume (K) Forecast, by Application 2020 & 2033
- Table 29: Rest of South America Reverse Osmosis Membrane Filtration Revenue (million) Forecast, by Application 2020 & 2033
- Table 30: Rest of South America Reverse Osmosis Membrane Filtration Volume (K) Forecast, by Application 2020 & 2033
- Table 31: Global Reverse Osmosis Membrane Filtration Revenue million Forecast, by Application 2020 & 2033
- Table 32: Global Reverse Osmosis Membrane Filtration Volume K Forecast, by Application 2020 & 2033
- Table 33: Global Reverse Osmosis Membrane Filtration Revenue million Forecast, by Types 2020 & 2033
- Table 34: Global Reverse Osmosis Membrane Filtration Volume K Forecast, by Types 2020 & 2033
- Table 35: Global Reverse Osmosis Membrane Filtration Revenue million Forecast, by Country 2020 & 2033
- Table 36: Global Reverse Osmosis Membrane Filtration Volume K Forecast, by Country 2020 & 2033
- Table 37: United Kingdom Reverse Osmosis Membrane Filtration Revenue (million) Forecast, by Application 2020 & 2033
- Table 38: United Kingdom Reverse Osmosis Membrane Filtration Volume (K) Forecast, by Application 2020 & 2033
- Table 39: Germany Reverse Osmosis Membrane Filtration Revenue (million) Forecast, by Application 2020 & 2033
- Table 40: Germany Reverse Osmosis Membrane Filtration Volume (K) Forecast, by Application 2020 & 2033
- Table 41: France Reverse Osmosis Membrane Filtration Revenue (million) Forecast, by Application 2020 & 2033
- Table 42: France Reverse Osmosis Membrane Filtration Volume (K) Forecast, by Application 2020 & 2033
- Table 43: Italy Reverse Osmosis Membrane Filtration Revenue (million) Forecast, by Application 2020 & 2033
- Table 44: Italy Reverse Osmosis Membrane Filtration Volume (K) Forecast, by Application 2020 & 2033
- Table 45: Spain Reverse Osmosis Membrane Filtration Revenue (million) Forecast, by Application 2020 & 2033
- Table 46: Spain Reverse Osmosis Membrane Filtration Volume (K) Forecast, by Application 2020 & 2033
- Table 47: Russia Reverse Osmosis Membrane Filtration Revenue (million) Forecast, by Application 2020 & 2033
- Table 48: Russia Reverse Osmosis Membrane Filtration Volume (K) Forecast, by Application 2020 & 2033
- Table 49: Benelux Reverse Osmosis Membrane Filtration Revenue (million) Forecast, by Application 2020 & 2033
- Table 50: Benelux Reverse Osmosis Membrane Filtration Volume (K) Forecast, by Application 2020 & 2033
- Table 51: Nordics Reverse Osmosis Membrane Filtration Revenue (million) Forecast, by Application 2020 & 2033
- Table 52: Nordics Reverse Osmosis Membrane Filtration Volume (K) Forecast, by Application 2020 & 2033
- Table 53: Rest of Europe Reverse Osmosis Membrane Filtration Revenue (million) Forecast, by Application 2020 & 2033
- Table 54: Rest of Europe Reverse Osmosis Membrane Filtration Volume (K) Forecast, by Application 2020 & 2033
- Table 55: Global Reverse Osmosis Membrane Filtration Revenue million Forecast, by Application 2020 & 2033
- Table 56: Global Reverse Osmosis Membrane Filtration Volume K Forecast, by Application 2020 & 2033
- Table 57: Global Reverse Osmosis Membrane Filtration Revenue million Forecast, by Types 2020 & 2033
- Table 58: Global Reverse Osmosis Membrane Filtration Volume K Forecast, by Types 2020 & 2033
- Table 59: Global Reverse Osmosis Membrane Filtration Revenue million Forecast, by Country 2020 & 2033
- Table 60: Global Reverse Osmosis Membrane Filtration Volume K Forecast, by Country 2020 & 2033
- Table 61: Turkey Reverse Osmosis Membrane Filtration Revenue (million) Forecast, by Application 2020 & 2033
- Table 62: Turkey Reverse Osmosis Membrane Filtration Volume (K) Forecast, by Application 2020 & 2033
- Table 63: Israel Reverse Osmosis Membrane Filtration Revenue (million) Forecast, by Application 2020 & 2033
- Table 64: Israel Reverse Osmosis Membrane Filtration Volume (K) Forecast, by Application 2020 & 2033
- Table 65: GCC Reverse Osmosis Membrane Filtration Revenue (million) Forecast, by Application 2020 & 2033
- Table 66: GCC Reverse Osmosis Membrane Filtration Volume (K) Forecast, by Application 2020 & 2033
- Table 67: North Africa Reverse Osmosis Membrane Filtration Revenue (million) Forecast, by Application 2020 & 2033
- Table 68: North Africa Reverse Osmosis Membrane Filtration Volume (K) Forecast, by Application 2020 & 2033
- Table 69: South Africa Reverse Osmosis Membrane Filtration Revenue (million) Forecast, by Application 2020 & 2033
- Table 70: South Africa Reverse Osmosis Membrane Filtration Volume (K) Forecast, by Application 2020 & 2033
- Table 71: Rest of Middle East & Africa Reverse Osmosis Membrane Filtration Revenue (million) Forecast, by Application 2020 & 2033
- Table 72: Rest of Middle East & Africa Reverse Osmosis Membrane Filtration Volume (K) Forecast, by Application 2020 & 2033
- Table 73: Global Reverse Osmosis Membrane Filtration Revenue million Forecast, by Application 2020 & 2033
- Table 74: Global Reverse Osmosis Membrane Filtration Volume K Forecast, by Application 2020 & 2033
- Table 75: Global Reverse Osmosis Membrane Filtration Revenue million Forecast, by Types 2020 & 2033
- Table 76: Global Reverse Osmosis Membrane Filtration Volume K Forecast, by Types 2020 & 2033
- Table 77: Global Reverse Osmosis Membrane Filtration Revenue million Forecast, by Country 2020 & 2033
- Table 78: Global Reverse Osmosis Membrane Filtration Volume K Forecast, by Country 2020 & 2033
- Table 79: China Reverse Osmosis Membrane Filtration Revenue (million) Forecast, by Application 2020 & 2033
- Table 80: China Reverse Osmosis Membrane Filtration Volume (K) Forecast, by Application 2020 & 2033
- Table 81: India Reverse Osmosis Membrane Filtration Revenue (million) Forecast, by Application 2020 & 2033
- Table 82: India Reverse Osmosis Membrane Filtration Volume (K) Forecast, by Application 2020 & 2033
- Table 83: Japan Reverse Osmosis Membrane Filtration Revenue (million) Forecast, by Application 2020 & 2033
- Table 84: Japan Reverse Osmosis Membrane Filtration Volume (K) Forecast, by Application 2020 & 2033
- Table 85: South Korea Reverse Osmosis Membrane Filtration Revenue (million) Forecast, by Application 2020 & 2033
- Table 86: South Korea Reverse Osmosis Membrane Filtration Volume (K) Forecast, by Application 2020 & 2033
- Table 87: ASEAN Reverse Osmosis Membrane Filtration Revenue (million) Forecast, by Application 2020 & 2033
- Table 88: ASEAN Reverse Osmosis Membrane Filtration Volume (K) Forecast, by Application 2020 & 2033
- Table 89: Oceania Reverse Osmosis Membrane Filtration Revenue (million) Forecast, by Application 2020 & 2033
- Table 90: Oceania Reverse Osmosis Membrane Filtration Volume (K) Forecast, by Application 2020 & 2033
- Table 91: Rest of Asia Pacific Reverse Osmosis Membrane Filtration Revenue (million) Forecast, by Application 2020 & 2033
- Table 92: Rest of Asia Pacific Reverse Osmosis Membrane Filtration Volume (K) Forecast, by Application 2020 & 2033
Frequently Asked Questions
1. What is the projected Compound Annual Growth Rate (CAGR) of the Reverse Osmosis Membrane Filtration?
The projected CAGR is approximately 4.1%.
2. Which companies are prominent players in the Reverse Osmosis Membrane Filtration?
Key companies in the market include Alfa Laval AB, DowDuPont, Suez Water Technologies and Solutions, GEA Group AG, Pall Corporation, 3M Company, Koch Membrane Systems Inc, Veolia, SPX Flow, Toray Industries Inc., Nitto Group Company, LG Chem, Axeon Water Technologies, Lanxess AG, Toyobo Co. Ltd., AMPAC USA, Novasep.
3. What are the main segments of the Reverse Osmosis Membrane Filtration?
The market segments include Application, Types.
4. Can you provide details about the market size?
The market size is estimated to be USD 2863.4 million as of 2022.
5. What are some drivers contributing to market growth?
N/A
6. What are the notable trends driving market growth?
N/A
7. Are there any restraints impacting market growth?
N/A
8. Can you provide examples of recent developments in the market?
N/A
9. What pricing options are available for accessing the report?
Pricing options include single-user, multi-user, and enterprise licenses priced at USD 3950.00, USD 5925.00, and USD 7900.00 respectively.
10. Is the market size provided in terms of value or volume?
The market size is provided in terms of value, measured in million and volume, measured in K.
11. Are there any specific market keywords associated with the report?
Yes, the market keyword associated with the report is "Reverse Osmosis Membrane Filtration," which aids in identifying and referencing the specific market segment covered.
12. How do I determine which pricing option suits my needs best?
The pricing options vary based on user requirements and access needs. Individual users may opt for single-user licenses, while businesses requiring broader access may choose multi-user or enterprise licenses for cost-effective access to the report.
13. Are there any additional resources or data provided in the Reverse Osmosis Membrane Filtration report?
While the report offers comprehensive insights, it's advisable to review the specific contents or supplementary materials provided to ascertain if additional resources or data are available.
14. How can I stay updated on further developments or reports in the Reverse Osmosis Membrane Filtration?
To stay informed about further developments, trends, and reports in the Reverse Osmosis Membrane Filtration, consider subscribing to industry newsletters, following relevant companies and organizations, or regularly checking reputable industry news sources and publications.
Methodology
Step 1 - Identification of Relevant Samples Size from Population Database


Step 2 - Approaches for Defining Global Market Size (Value, Volume* & Price*)

Note*: In applicable scenarios
Step 3 - Data Sources
Primary Research
- Web Analytics
- Survey Reports
- Research Institute
- Latest Research Reports
- Opinion Leaders
Secondary Research
- Annual Reports
- White Paper
- Latest Press Release
- Industry Association
- Paid Database
- Investor Presentations

Step 4 - Data Triangulation
Involves using different sources of information in order to increase the validity of a study
These sources are likely to be stakeholders in a program - participants, other researchers, program staff, other community members, and so on.
Then we put all data in single framework & apply various statistical tools to find out the dynamic on the market.
During the analysis stage, feedback from the stakeholder groups would be compared to determine areas of agreement as well as areas of divergence