

Key Insights
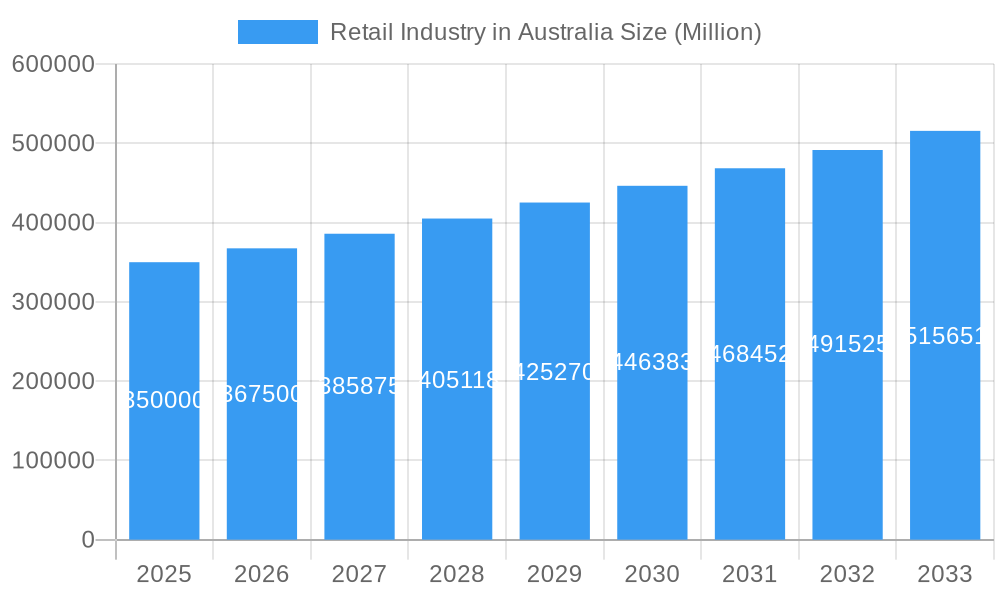
The Australian retail sector is poised for significant expansion, projected to reach a market size of $551.11 billion by 2025, with a Compound Annual Growth Rate (CAGR) of 3.1% through 2033. This robust growth is propelled by increasing consumer disposable income and widespread e-commerce adoption. Major retailers are actively embracing omnichannel strategies, enhancing customer convenience and choice. Additionally, a growing demand for experiential retail and a focus on sustainable and ethical product sourcing are creating new avenues for innovation. However, retailers face challenges including rising operational expenses, supply chain volatility, and intense competition. A clear consumer preference for value-driven offerings is intensifying market pressures.
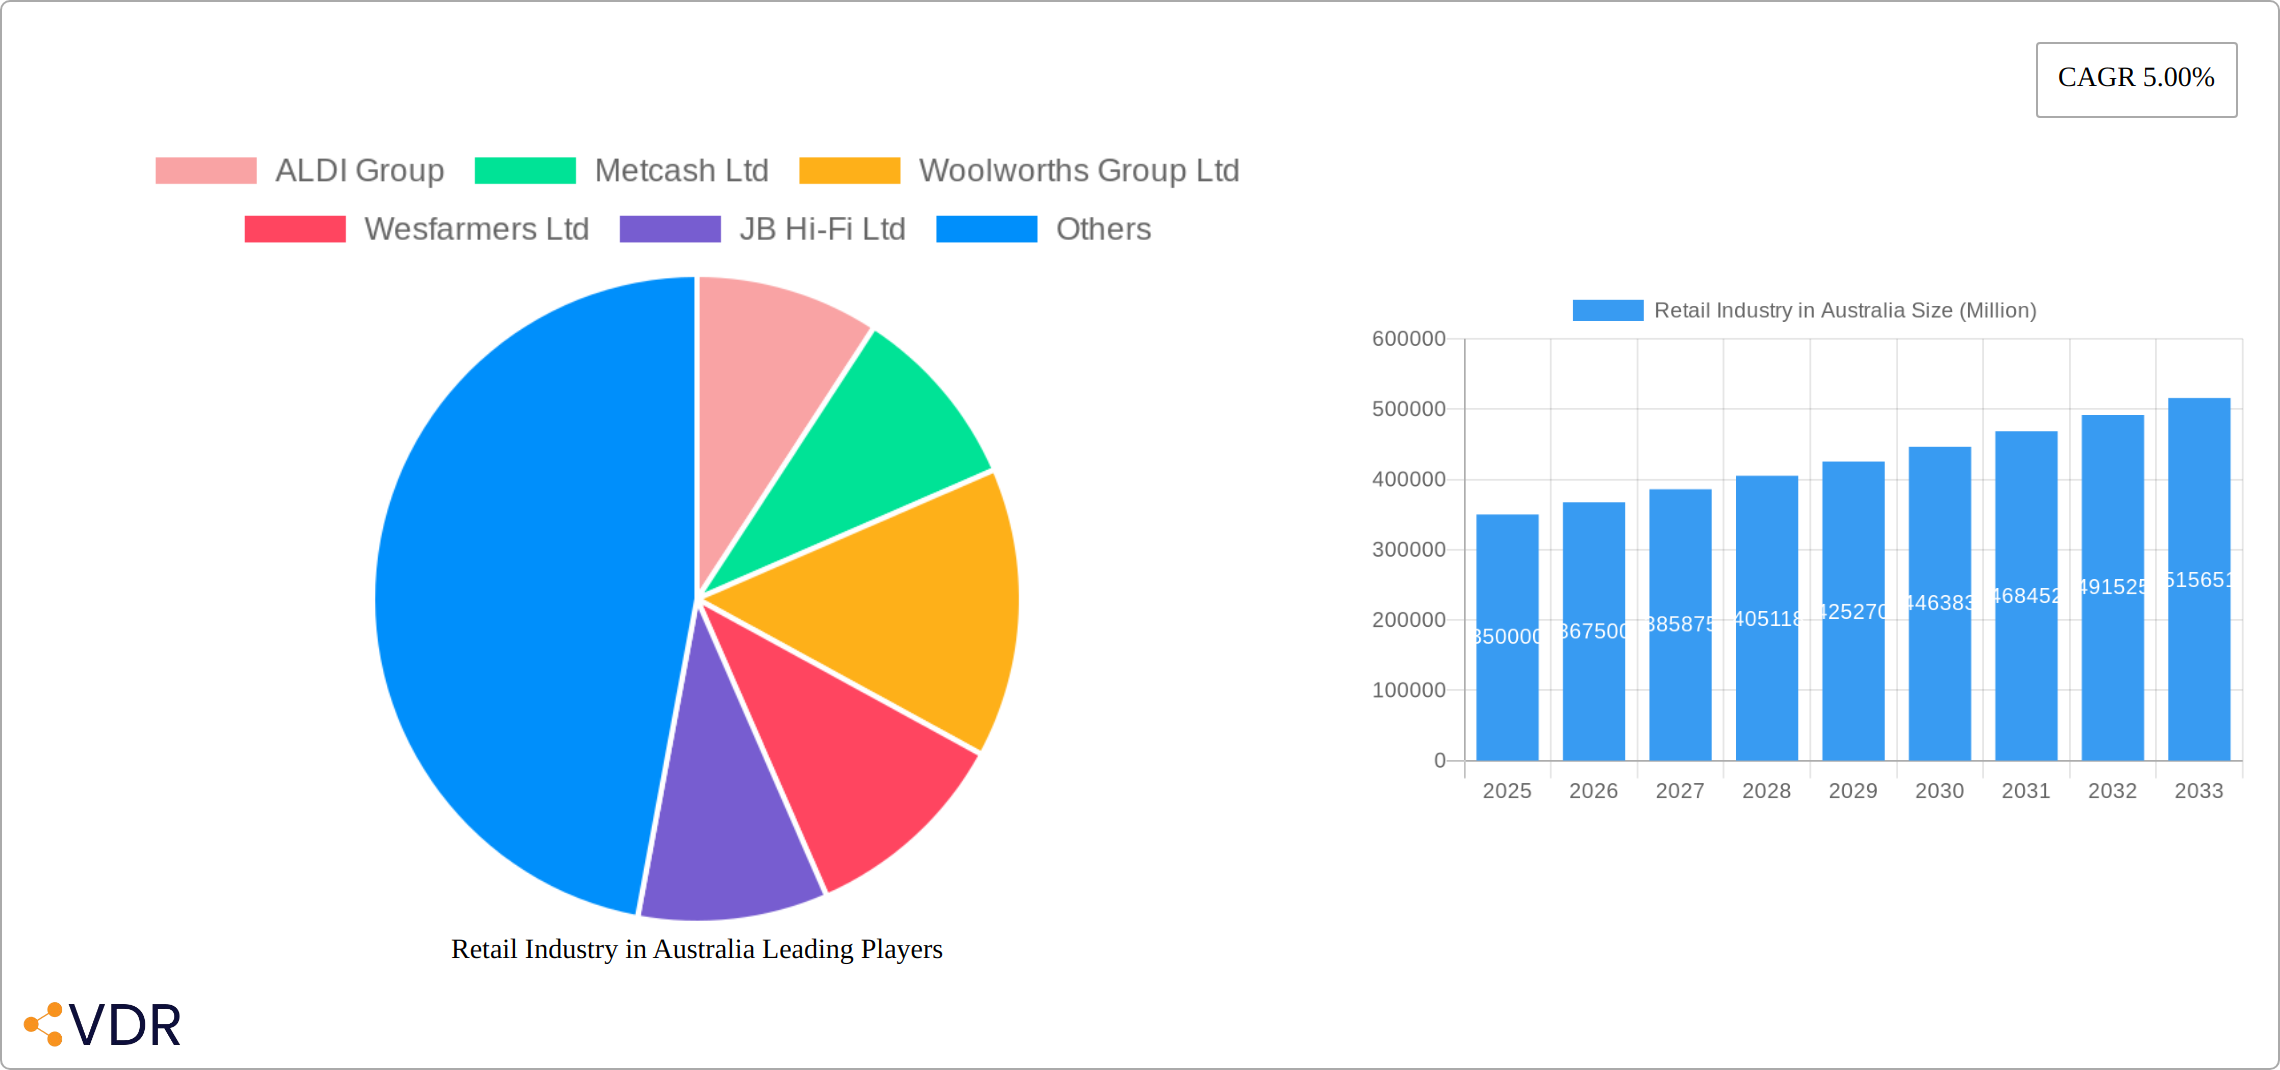
Retail Industry in Australia Market Size (In Billion)
The Australian retail market is diversified across grocery, apparel, electronics, home improvement, and specialty segments. Leading entities such as Coles Group, Woolworths Group, and Wesfarmers command significant market share in grocery and general merchandise, while JB Hi-Fi and Kogan.com are prominent in electronics and online retail. Metropolitan areas typically show higher retail engagement compared to regional centers. The forecast period (2025-2033) indicates sustained growth, emphasizing the critical need for strategic agility. Retailers must prioritize optimized omnichannel operations, elevated customer experiences, and adaptation to the preferences of a digitally proficient consumer base to thrive amidst evolving market dynamics and economic fluctuations.
Retail Industry in Australia Company Market Share
Retail Industry in Australia: A Comprehensive Market Report (2019-2033)
This comprehensive report provides an in-depth analysis of the Australian retail industry, covering market dynamics, growth trends, key players, and future outlook. The study period spans from 2019 to 2033, with 2025 serving as both the base and estimated year. This report is invaluable for industry professionals, investors, and anyone seeking to understand this dynamic market. The analysis incorporates data on major players like ALDI Group, Metcash Ltd, Woolworths Group Ltd, Wesfarmers Ltd, JB Hi-Fi Ltd, Coles Group, Kmart Australia Ltd, Myer Group Pty Ltd, David Jones Properties Pty Ltd, and Kogan.com Ltd (list not exhaustive), across various segments including grocery, apparel, electronics, and homewares. The report's detailed insights will help navigate the complexities of the Australian retail landscape and inform strategic decision-making.
Retail Industry in Australia Market Dynamics & Structure
This section analyzes the Australian retail market's structure, highlighting concentration levels, technological innovation, regulatory influences, competitive forces, consumer demographics, and M&A activity. The market is characterized by a high degree of competition, with a few dominant players commanding significant market share.
- Market Concentration: The top five retailers account for approximately xx% of the total market revenue (2024). Woolworths Group Ltd and Coles Group hold the largest market shares in the grocery segment.
- Technological Innovation: E-commerce penetration is rapidly increasing, driven by advancements in mobile technology and digital marketing. However, innovation is hindered by the high cost of implementation and the need for robust logistics infrastructure.
- Regulatory Framework: Australian retail is subject to various regulations concerning consumer protection, fair trading, and data privacy. These regulations influence pricing strategies and marketing practices.
- Competitive Product Substitutes: The rise of online marketplaces and direct-to-consumer brands poses a significant threat to traditional brick-and-mortar retailers.
- End-User Demographics: The Australian retail market caters to a diverse population with varying income levels and consumption patterns. Understanding these demographics is crucial for targeted marketing strategies.
- M&A Trends: The past five years have witnessed xx M&A deals in the Australian retail sector (2019-2024), primarily driven by consolidation and expansion strategies among major players.
Retail Industry in Australia Growth Trends & Insights
This section leverages [Insert Data Source, e.g., IBISWorld, Statista] to provide a detailed analysis of market size evolution, adoption rates, technological disruptions, and consumer behavior shifts within the Australian retail sector from 2019 to 2033. The market experienced a CAGR of xx% during the historical period (2019-2024) and is projected to grow at a CAGR of xx% during the forecast period (2025-2033). Key factors influencing growth include increasing urbanization, rising disposable incomes, and evolving consumer preferences. The shift towards online shopping and the adoption of omnichannel strategies are significant disruptors, forcing traditional retailers to adapt and innovate. Market penetration of e-commerce is expected to reach xx% by 2033.
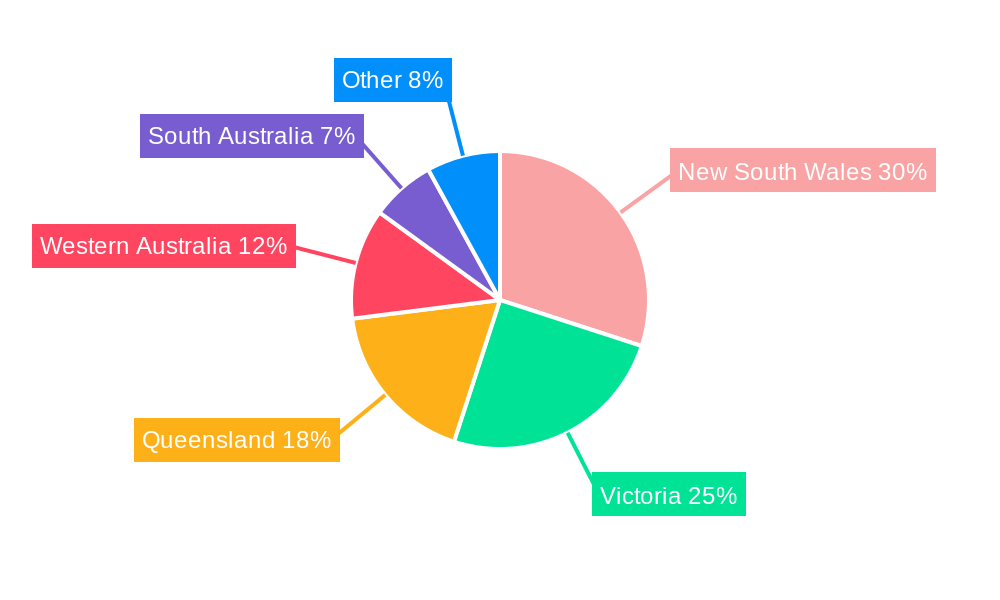
Dominant Regions, Countries, or Segments in Retail Industry in Australia
The Australian retail industry is characterized by dynamic growth concentrated in its major metropolitan hubs, particularly Sydney and Melbourne, which consistently lead in retail sales due to higher population density and economic activity. While these urban centers remain powerhouses, the rapid expansion of e-commerce is significantly leveling the playing field, offering consumers nationwide unprecedented access to a vast array of goods and services. This digital shift is not only bridging geographical divides but also fostering growth in previously underserved regional areas.
- Key Growth Drivers:
- Robust economic performance and population growth in key metropolitan areas.
- The continuous development and adoption of sophisticated e-commerce and omnichannel strategies.
- A sustained rise in consumer expenditure on discretionary goods and premium offerings.
- Proactive government policies and incentives aimed at nurturing and empowering small and medium-sized enterprises (SMEs) within the retail sector.
- Factors Influencing Market Dominance: The entrenched leadership of major supermarket chains like Woolworths and Coles in the grocery sector is largely attributable to their extensive and highly efficient distribution networks, coupled with decades of established brand trust and consumer loyalty.
Retail Industry in Australia Product Landscape
Australia's retail sector boasts an exceptionally diverse product landscape, encompassing everything from essential groceries and fashion apparel to cutting-edge electronics and home furnishings. The industry is actively embracing innovation, with a strong emphasis on delivering personalized customer journeys, implementing advanced inventory management solutions, and leveraging data analytics to refine pricing strategies and promotional campaigns. Furthermore, a growing consumer demand for sustainability and ethically sourced products is reshaping market offerings. Technological advancements, such as augmented reality (AR) for virtual try-ons and virtual reality (VR) for immersive shopping experiences, are increasingly being integrated into both physical and online retail environments to enhance customer engagement and satisfaction.
Key Drivers, Barriers & Challenges in Retail Industry in Australia
Key Drivers:
- Ascending Disposable Incomes: A consistent increase in household disposable incomes directly translates to heightened consumer purchasing power, driving spending across all retail segments.
- Pervasive Technological Advancements: The widespread adoption of e-commerce platforms and the strategic implementation of omnichannel retail models are fundamentally transforming how Australians shop.
- Supportive Government Initiatives: Ongoing government support through policies that bolster SMEs and investments in critical infrastructure continue to be significant catalysts for retail sector expansion.
Key Challenges:
- Supply Chain Vulnerabilities: Recent global disruptions have starkly illuminated the fragility of retail supply chains, leading to increased product shortages and rising operational costs.
- Intensified Competitive Landscape: The Australian market faces fierce competition from a growing number of both local and international retailers, creating downward pressure on profit margins.
- Navigating Regulatory Evolution: The dynamic nature of regulatory frameworks, particularly concerning data privacy and consumer protection, presents ongoing compliance challenges and potential cost increases for businesses.
Emerging Opportunities in Retail Industry in Australia
The Australian retail market is ripe with burgeoning opportunities for forward-thinking businesses:
- The Rise of Experiential Retail: A significant opportunity lies in creating unique, memorable, and engaging in-store and online shopping experiences that go beyond mere transactions, fostering customer loyalty and foot traffic.
- Prioritizing Sustainability and Ethical Sourcing: As consumer awareness of environmental and social responsibility grows, retailers that authentically embrace sustainable practices and ethical sourcing will capture a larger market share.
- Strategic Expansion into Regional Markets: Significant untapped potential exists within Australia's regional areas, particularly as e-commerce infrastructure continues to improve, enabling wider reach and increased accessibility.
Growth Accelerators in the Retail Industry in Australia Industry
Long-term growth in the Australian retail sector will be driven by continued technological advancements, strategic partnerships, and expansion into new markets. The ongoing development of sophisticated logistics networks and the adoption of artificial intelligence (AI) for personalized recommendations and efficient inventory management will play a crucial role.
Key Players Shaping the Retail Industry in Australia Market
- ALDI Group
- Metcash Ltd
- Woolworths Group Ltd
- Wesfarmers Ltd
- JB Hi-Fi Ltd
- Coles Group
- Kmart Australia Ltd
- Myer Group Pty Ltd
- David Jones Properties Pty Ltd
- Kogan.com Ltd
Notable Milestones in Retail Industry in Australia Sector
- November 2020: Wesfarmers expands Kmart operations, opening new stores in Victoria and Western Australia.
In-Depth Retail Industry in Australia Market Outlook
The Australian retail market is poised for continued growth, driven by evolving consumer preferences, technological innovation, and strategic investments by key players. The focus on omnichannel strategies, sustainability, and personalized experiences will shape the future of the industry. Opportunities exist for businesses that can adapt to the changing landscape and leverage technology to enhance the customer journey. The forecast period (2025-2033) presents significant potential for expansion and innovation within the Australian retail sector.
Retail Industry in Australia Segmentation
-
1. Product
- 1.1. Food and Beverages
- 1.2. Personal and Household Care
- 1.3. Apparel, Footwear, and Accessories
- 1.4. Furniture, Toys, and Hobby
- 1.5. Electronic and Household Appliances
- 1.6. Other Products
-
2. Distribution Channel
- 2.1. Supermar
- 2.2. Specialty Stores
- 2.3. Online
- 2.4. Other Distribution Channels
Retail Industry in Australia Segmentation By Geography
-
1. North America
- 1.1. United States
- 1.2. Canada
- 1.3. Mexico
-
2. South America
- 2.1. Brazil
- 2.2. Argentina
- 2.3. Rest of South America
-
3. Europe
- 3.1. United Kingdom
- 3.2. Germany
- 3.3. France
- 3.4. Italy
- 3.5. Spain
- 3.6. Russia
- 3.7. Benelux
- 3.8. Nordics
- 3.9. Rest of Europe
-
4. Middle East & Africa
- 4.1. Turkey
- 4.2. Israel
- 4.3. GCC
- 4.4. North Africa
- 4.5. South Africa
- 4.6. Rest of Middle East & Africa
-
5. Asia Pacific
- 5.1. China
- 5.2. India
- 5.3. Japan
- 5.4. South Korea
- 5.5. ASEAN
- 5.6. Oceania
- 5.7. Rest of Asia Pacific
Retail Industry in Australia Regional Market Share
Geographic Coverage of Retail Industry in Australia
Retail Industry in Australia REPORT HIGHLIGHTS
| Aspects | Details |
|---|---|
| Study Period | 2020-2034 |
| Base Year | 2025 |
| Estimated Year | 2026 |
| Forecast Period | 2026-2034 |
| Historical Period | 2020-2025 |
| Growth Rate | CAGR of 3.1% from 2020-2034 |
| Segmentation |
|
Table of Contents
- 1. Introduction
- 1.1. Research Scope
- 1.2. Market Segmentation
- 1.3. Research Objective
- 1.4. Definitions and Assumptions
- 2. Executive Summary
- 2.1. Market Snapshot
- 3. Market Dynamics
- 3.1. Market Drivers
- 3.2. Market Restrains
- 3.3. Market Trends
- 3.4. Market Opportunities
- 4. Market Factor Analysis
- 4.1. Porters Five Forces
- 4.1.1. Bargaining Power of Suppliers
- 4.1.2. Bargaining Power of Buyers
- 4.1.3. Threat of New Entrants
- 4.1.4. Threat of Substitutes
- 4.1.5. Competitive Rivalry
- 4.2. PESTEL analysis
- 4.3. BCG Analysis
- 4.3.1. Stars (High Growth, High Market Share)
- 4.3.2. Cash Cows (Low Growth, High Market Share)
- 4.3.3. Question Mark (High Growth, Low Market Share)
- 4.3.4. Dogs (Low Growth, Low Market Share)
- 4.4. Ansoff Matrix Analysis
- 4.5. Supply Chain Analysis
- 4.6. Regulatory Landscape
- 4.7. Current Market Potential and Opportunity Assessment (TAM–SAM–SOM Framework)
- 4.8. VDR Analyst Note
- 4.1. Porters Five Forces
- 5. Market Analysis, Insights and Forecast 2021-2033
- 5.1. Market Analysis, Insights and Forecast - by Product
- 5.1.1. Food and Beverages
- 5.1.2. Personal and Household Care
- 5.1.3. Apparel, Footwear, and Accessories
- 5.1.4. Furniture, Toys, and Hobby
- 5.1.5. Electronic and Household Appliances
- 5.1.6. Other Products
- 5.2. Market Analysis, Insights and Forecast - by Distribution Channel
- 5.2.1. Supermar
- 5.2.2. Specialty Stores
- 5.2.3. Online
- 5.2.4. Other Distribution Channels
- 5.3. Market Analysis, Insights and Forecast - by Region
- 5.3.1. North America
- 5.3.2. South America
- 5.3.3. Europe
- 5.3.4. Middle East & Africa
- 5.3.5. Asia Pacific
- 5.1. Market Analysis, Insights and Forecast - by Product
- 6. Global Retail Industry in Australia Analysis, Insights and Forecast, 2021-2033
- 6.1. Market Analysis, Insights and Forecast - by Product
- 6.1.1. Food and Beverages
- 6.1.2. Personal and Household Care
- 6.1.3. Apparel, Footwear, and Accessories
- 6.1.4. Furniture, Toys, and Hobby
- 6.1.5. Electronic and Household Appliances
- 6.1.6. Other Products
- 6.2. Market Analysis, Insights and Forecast - by Distribution Channel
- 6.2.1. Supermar
- 6.2.2. Specialty Stores
- 6.2.3. Online
- 6.2.4. Other Distribution Channels
- 6.1. Market Analysis, Insights and Forecast - by Product
- 7. North America Retail Industry in Australia Analysis, Insights and Forecast, 2021-2033
- 7.1. Market Analysis, Insights and Forecast - by Product
- 7.1.1. Food and Beverages
- 7.1.2. Personal and Household Care
- 7.1.3. Apparel, Footwear, and Accessories
- 7.1.4. Furniture, Toys, and Hobby
- 7.1.5. Electronic and Household Appliances
- 7.1.6. Other Products
- 7.2. Market Analysis, Insights and Forecast - by Distribution Channel
- 7.2.1. Supermar
- 7.2.2. Specialty Stores
- 7.2.3. Online
- 7.2.4. Other Distribution Channels
- 7.1. Market Analysis, Insights and Forecast - by Product
- 8. South America Retail Industry in Australia Analysis, Insights and Forecast, 2021-2033
- 8.1. Market Analysis, Insights and Forecast - by Product
- 8.1.1. Food and Beverages
- 8.1.2. Personal and Household Care
- 8.1.3. Apparel, Footwear, and Accessories
- 8.1.4. Furniture, Toys, and Hobby
- 8.1.5. Electronic and Household Appliances
- 8.1.6. Other Products
- 8.2. Market Analysis, Insights and Forecast - by Distribution Channel
- 8.2.1. Supermar
- 8.2.2. Specialty Stores
- 8.2.3. Online
- 8.2.4. Other Distribution Channels
- 8.1. Market Analysis, Insights and Forecast - by Product
- 9. Europe Retail Industry in Australia Analysis, Insights and Forecast, 2021-2033
- 9.1. Market Analysis, Insights and Forecast - by Product
- 9.1.1. Food and Beverages
- 9.1.2. Personal and Household Care
- 9.1.3. Apparel, Footwear, and Accessories
- 9.1.4. Furniture, Toys, and Hobby
- 9.1.5. Electronic and Household Appliances
- 9.1.6. Other Products
- 9.2. Market Analysis, Insights and Forecast - by Distribution Channel
- 9.2.1. Supermar
- 9.2.2. Specialty Stores
- 9.2.3. Online
- 9.2.4. Other Distribution Channels
- 9.1. Market Analysis, Insights and Forecast - by Product
- 10. Middle East & Africa Retail Industry in Australia Analysis, Insights and Forecast, 2021-2033
- 10.1. Market Analysis, Insights and Forecast - by Product
- 10.1.1. Food and Beverages
- 10.1.2. Personal and Household Care
- 10.1.3. Apparel, Footwear, and Accessories
- 10.1.4. Furniture, Toys, and Hobby
- 10.1.5. Electronic and Household Appliances
- 10.1.6. Other Products
- 10.2. Market Analysis, Insights and Forecast - by Distribution Channel
- 10.2.1. Supermar
- 10.2.2. Specialty Stores
- 10.2.3. Online
- 10.2.4. Other Distribution Channels
- 10.1. Market Analysis, Insights and Forecast - by Product
- 11. Asia Pacific Retail Industry in Australia Analysis, Insights and Forecast, 2021-2033
- 11.1. Market Analysis, Insights and Forecast - by Product
- 11.1.1. Food and Beverages
- 11.1.2. Personal and Household Care
- 11.1.3. Apparel, Footwear, and Accessories
- 11.1.4. Furniture, Toys, and Hobby
- 11.1.5. Electronic and Household Appliances
- 11.1.6. Other Products
- 11.2. Market Analysis, Insights and Forecast - by Distribution Channel
- 11.2.1. Supermar
- 11.2.2. Specialty Stores
- 11.2.3. Online
- 11.2.4. Other Distribution Channels
- 11.1. Market Analysis, Insights and Forecast - by Product
- 12. Competitive Analysis
- 12.1. Company Profiles
- 12.1.1 ALDI Group
- 12.1.1.1. Company Overview
- 12.1.1.2. Products
- 12.1.1.3. Company Financials
- 12.1.1.4. SWOT Analysis
- 12.1.2 Metcash Ltd
- 12.1.2.1. Company Overview
- 12.1.2.2. Products
- 12.1.2.3. Company Financials
- 12.1.2.4. SWOT Analysis
- 12.1.3 Woolworths Group Ltd
- 12.1.3.1. Company Overview
- 12.1.3.2. Products
- 12.1.3.3. Company Financials
- 12.1.3.4. SWOT Analysis
- 12.1.4 Wesfarmers Ltd
- 12.1.4.1. Company Overview
- 12.1.4.2. Products
- 12.1.4.3. Company Financials
- 12.1.4.4. SWOT Analysis
- 12.1.5 JB Hi-Fi Ltd
- 12.1.5.1. Company Overview
- 12.1.5.2. Products
- 12.1.5.3. Company Financials
- 12.1.5.4. SWOT Analysis
- 12.1.6 Coles Group
- 12.1.6.1. Company Overview
- 12.1.6.2. Products
- 12.1.6.3. Company Financials
- 12.1.6.4. SWOT Analysis
- 12.1.7 Kmart Australia Ltd
- 12.1.7.1. Company Overview
- 12.1.7.2. Products
- 12.1.7.3. Company Financials
- 12.1.7.4. SWOT Analysis
- 12.1.8 Myer Group Pty Ltd
- 12.1.8.1. Company Overview
- 12.1.8.2. Products
- 12.1.8.3. Company Financials
- 12.1.8.4. SWOT Analysis
- 12.1.9 David Jones Properties Pty Ltd
- 12.1.9.1. Company Overview
- 12.1.9.2. Products
- 12.1.9.3. Company Financials
- 12.1.9.4. SWOT Analysis
- 12.1.10 Kogan com Ltd**List Not Exhaustive
- 12.1.10.1. Company Overview
- 12.1.10.2. Products
- 12.1.10.3. Company Financials
- 12.1.10.4. SWOT Analysis
- 12.1.1 ALDI Group
- 12.2. Market Entropy
- 12.2.1 Company's Key Areas Served
- 12.2.2 Recent Developments
- 12.3. Company Market Share Analysis 2025
- 12.3.1 Top 5 Companies Market Share Analysis
- 12.3.2 Top 3 Companies Market Share Analysis
- 12.4. List of Potential Customers
- 13. Research Methodology
List of Figures
- Figure 1: Global Retail Industry in Australia Revenue Breakdown (billion, %) by Region 2025 & 2033
- Figure 2: North America Retail Industry in Australia Revenue (billion), by Product 2025 & 2033
- Figure 3: North America Retail Industry in Australia Revenue Share (%), by Product 2025 & 2033
- Figure 4: North America Retail Industry in Australia Revenue (billion), by Distribution Channel 2025 & 2033
- Figure 5: North America Retail Industry in Australia Revenue Share (%), by Distribution Channel 2025 & 2033
- Figure 6: North America Retail Industry in Australia Revenue (billion), by Country 2025 & 2033
- Figure 7: North America Retail Industry in Australia Revenue Share (%), by Country 2025 & 2033
- Figure 8: South America Retail Industry in Australia Revenue (billion), by Product 2025 & 2033
- Figure 9: South America Retail Industry in Australia Revenue Share (%), by Product 2025 & 2033
- Figure 10: South America Retail Industry in Australia Revenue (billion), by Distribution Channel 2025 & 2033
- Figure 11: South America Retail Industry in Australia Revenue Share (%), by Distribution Channel 2025 & 2033
- Figure 12: South America Retail Industry in Australia Revenue (billion), by Country 2025 & 2033
- Figure 13: South America Retail Industry in Australia Revenue Share (%), by Country 2025 & 2033
- Figure 14: Europe Retail Industry in Australia Revenue (billion), by Product 2025 & 2033
- Figure 15: Europe Retail Industry in Australia Revenue Share (%), by Product 2025 & 2033
- Figure 16: Europe Retail Industry in Australia Revenue (billion), by Distribution Channel 2025 & 2033
- Figure 17: Europe Retail Industry in Australia Revenue Share (%), by Distribution Channel 2025 & 2033
- Figure 18: Europe Retail Industry in Australia Revenue (billion), by Country 2025 & 2033
- Figure 19: Europe Retail Industry in Australia Revenue Share (%), by Country 2025 & 2033
- Figure 20: Middle East & Africa Retail Industry in Australia Revenue (billion), by Product 2025 & 2033
- Figure 21: Middle East & Africa Retail Industry in Australia Revenue Share (%), by Product 2025 & 2033
- Figure 22: Middle East & Africa Retail Industry in Australia Revenue (billion), by Distribution Channel 2025 & 2033
- Figure 23: Middle East & Africa Retail Industry in Australia Revenue Share (%), by Distribution Channel 2025 & 2033
- Figure 24: Middle East & Africa Retail Industry in Australia Revenue (billion), by Country 2025 & 2033
- Figure 25: Middle East & Africa Retail Industry in Australia Revenue Share (%), by Country 2025 & 2033
- Figure 26: Asia Pacific Retail Industry in Australia Revenue (billion), by Product 2025 & 2033
- Figure 27: Asia Pacific Retail Industry in Australia Revenue Share (%), by Product 2025 & 2033
- Figure 28: Asia Pacific Retail Industry in Australia Revenue (billion), by Distribution Channel 2025 & 2033
- Figure 29: Asia Pacific Retail Industry in Australia Revenue Share (%), by Distribution Channel 2025 & 2033
- Figure 30: Asia Pacific Retail Industry in Australia Revenue (billion), by Country 2025 & 2033
- Figure 31: Asia Pacific Retail Industry in Australia Revenue Share (%), by Country 2025 & 2033
List of Tables
- Table 1: Global Retail Industry in Australia Revenue billion Forecast, by Product 2020 & 2033
- Table 2: Global Retail Industry in Australia Revenue billion Forecast, by Distribution Channel 2020 & 2033
- Table 3: Global Retail Industry in Australia Revenue billion Forecast, by Region 2020 & 2033
- Table 4: Global Retail Industry in Australia Revenue billion Forecast, by Product 2020 & 2033
- Table 5: Global Retail Industry in Australia Revenue billion Forecast, by Distribution Channel 2020 & 2033
- Table 6: Global Retail Industry in Australia Revenue billion Forecast, by Country 2020 & 2033
- Table 7: United States Retail Industry in Australia Revenue (billion) Forecast, by Application 2020 & 2033
- Table 8: Canada Retail Industry in Australia Revenue (billion) Forecast, by Application 2020 & 2033
- Table 9: Mexico Retail Industry in Australia Revenue (billion) Forecast, by Application 2020 & 2033
- Table 10: Global Retail Industry in Australia Revenue billion Forecast, by Product 2020 & 2033
- Table 11: Global Retail Industry in Australia Revenue billion Forecast, by Distribution Channel 2020 & 2033
- Table 12: Global Retail Industry in Australia Revenue billion Forecast, by Country 2020 & 2033
- Table 13: Brazil Retail Industry in Australia Revenue (billion) Forecast, by Application 2020 & 2033
- Table 14: Argentina Retail Industry in Australia Revenue (billion) Forecast, by Application 2020 & 2033
- Table 15: Rest of South America Retail Industry in Australia Revenue (billion) Forecast, by Application 2020 & 2033
- Table 16: Global Retail Industry in Australia Revenue billion Forecast, by Product 2020 & 2033
- Table 17: Global Retail Industry in Australia Revenue billion Forecast, by Distribution Channel 2020 & 2033
- Table 18: Global Retail Industry in Australia Revenue billion Forecast, by Country 2020 & 2033
- Table 19: United Kingdom Retail Industry in Australia Revenue (billion) Forecast, by Application 2020 & 2033
- Table 20: Germany Retail Industry in Australia Revenue (billion) Forecast, by Application 2020 & 2033
- Table 21: France Retail Industry in Australia Revenue (billion) Forecast, by Application 2020 & 2033
- Table 22: Italy Retail Industry in Australia Revenue (billion) Forecast, by Application 2020 & 2033
- Table 23: Spain Retail Industry in Australia Revenue (billion) Forecast, by Application 2020 & 2033
- Table 24: Russia Retail Industry in Australia Revenue (billion) Forecast, by Application 2020 & 2033
- Table 25: Benelux Retail Industry in Australia Revenue (billion) Forecast, by Application 2020 & 2033
- Table 26: Nordics Retail Industry in Australia Revenue (billion) Forecast, by Application 2020 & 2033
- Table 27: Rest of Europe Retail Industry in Australia Revenue (billion) Forecast, by Application 2020 & 2033
- Table 28: Global Retail Industry in Australia Revenue billion Forecast, by Product 2020 & 2033
- Table 29: Global Retail Industry in Australia Revenue billion Forecast, by Distribution Channel 2020 & 2033
- Table 30: Global Retail Industry in Australia Revenue billion Forecast, by Country 2020 & 2033
- Table 31: Turkey Retail Industry in Australia Revenue (billion) Forecast, by Application 2020 & 2033
- Table 32: Israel Retail Industry in Australia Revenue (billion) Forecast, by Application 2020 & 2033
- Table 33: GCC Retail Industry in Australia Revenue (billion) Forecast, by Application 2020 & 2033
- Table 34: North Africa Retail Industry in Australia Revenue (billion) Forecast, by Application 2020 & 2033
- Table 35: South Africa Retail Industry in Australia Revenue (billion) Forecast, by Application 2020 & 2033
- Table 36: Rest of Middle East & Africa Retail Industry in Australia Revenue (billion) Forecast, by Application 2020 & 2033
- Table 37: Global Retail Industry in Australia Revenue billion Forecast, by Product 2020 & 2033
- Table 38: Global Retail Industry in Australia Revenue billion Forecast, by Distribution Channel 2020 & 2033
- Table 39: Global Retail Industry in Australia Revenue billion Forecast, by Country 2020 & 2033
- Table 40: China Retail Industry in Australia Revenue (billion) Forecast, by Application 2020 & 2033
- Table 41: India Retail Industry in Australia Revenue (billion) Forecast, by Application 2020 & 2033
- Table 42: Japan Retail Industry in Australia Revenue (billion) Forecast, by Application 2020 & 2033
- Table 43: South Korea Retail Industry in Australia Revenue (billion) Forecast, by Application 2020 & 2033
- Table 44: ASEAN Retail Industry in Australia Revenue (billion) Forecast, by Application 2020 & 2033
- Table 45: Oceania Retail Industry in Australia Revenue (billion) Forecast, by Application 2020 & 2033
- Table 46: Rest of Asia Pacific Retail Industry in Australia Revenue (billion) Forecast, by Application 2020 & 2033
Frequently Asked Questions
1. What is the projected Compound Annual Growth Rate (CAGR) of the Retail Industry in Australia?
The projected CAGR is approximately 3.1%.
2. Which companies are prominent players in the Retail Industry in Australia?
Key companies in the market include ALDI Group, Metcash Ltd, Woolworths Group Ltd, Wesfarmers Ltd, JB Hi-Fi Ltd, Coles Group, Kmart Australia Ltd, Myer Group Pty Ltd, David Jones Properties Pty Ltd, Kogan com Ltd**List Not Exhaustive.
3. What are the main segments of the Retail Industry in Australia?
The market segments include Product, Distribution Channel.
4. Can you provide details about the market size?
The market size is estimated to be USD 551.11 billion as of 2022.
5. What are some drivers contributing to market growth?
N/A
6. What are the notable trends driving market growth?
Demand for Food and Beverages Continues to be Strong Despite the COVID-19 Challenges.
7. Are there any restraints impacting market growth?
N/A
8. Can you provide examples of recent developments in the market?
In November 2020, Wesfarmers retail businesses continued to expand their business. Kmart opened new stores in Camberwell and Casey in Victoria and Cockburn in Western Australia, all converted from Target stores, alongside its newest K Hub store in Bairnsdale in regional Victoria.
9. What pricing options are available for accessing the report?
Pricing options include single-user, multi-user, and enterprise licenses priced at USD 3800, USD 4500, and USD 5800 respectively.
10. Is the market size provided in terms of value or volume?
The market size is provided in terms of value, measured in billion.
11. Are there any specific market keywords associated with the report?
Yes, the market keyword associated with the report is "Retail Industry in Australia," which aids in identifying and referencing the specific market segment covered.
12. How do I determine which pricing option suits my needs best?
The pricing options vary based on user requirements and access needs. Individual users may opt for single-user licenses, while businesses requiring broader access may choose multi-user or enterprise licenses for cost-effective access to the report.
13. Are there any additional resources or data provided in the Retail Industry in Australia report?
While the report offers comprehensive insights, it's advisable to review the specific contents or supplementary materials provided to ascertain if additional resources or data are available.
14. How can I stay updated on further developments or reports in the Retail Industry in Australia?
To stay informed about further developments, trends, and reports in the Retail Industry in Australia, consider subscribing to industry newsletters, following relevant companies and organizations, or regularly checking reputable industry news sources and publications.
Methodology
Step 1 - Identification of Relevant Samples Size from Population Database


Step 2 - Approaches for Defining Global Market Size (Value, Volume* & Price*)

Note*: In applicable scenarios
Step 3 - Data Sources
Primary Research
- Web Analytics
- Survey Reports
- Research Institute
- Latest Research Reports
- Opinion Leaders
Secondary Research
- Annual Reports
- White Paper
- Latest Press Release
- Industry Association
- Paid Database
- Investor Presentations

Step 4 - Data Triangulation
Involves using different sources of information in order to increase the validity of a study
These sources are likely to be stakeholders in a program - participants, other researchers, program staff, other community members, and so on.
Then we put all data in single framework & apply various statistical tools to find out the dynamic on the market.
During the analysis stage, feedback from the stakeholder groups would be compared to determine areas of agreement as well as areas of divergence