

Key Insights
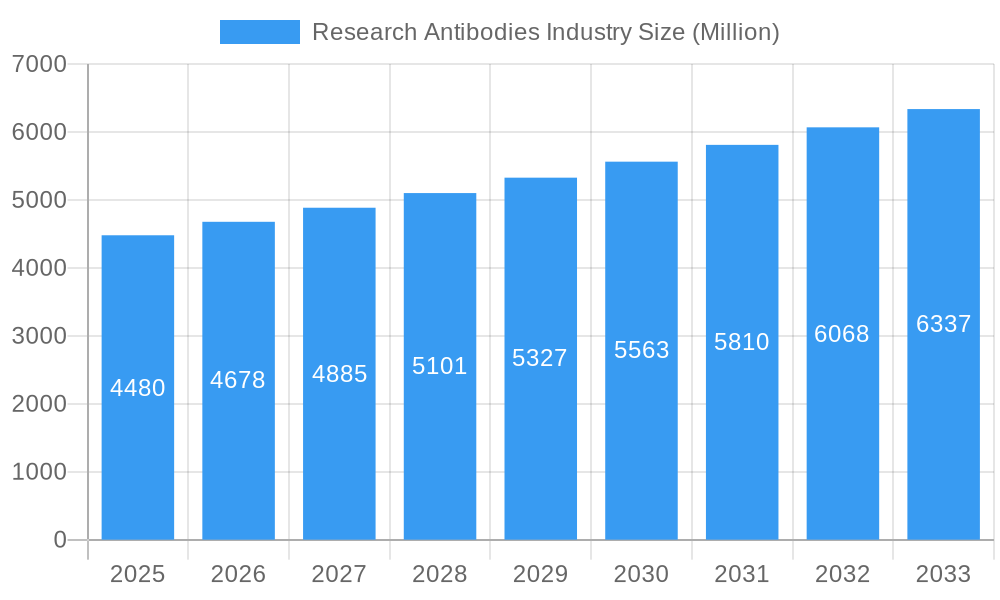
The global Research Antibodies market is poised for significant growth, estimated to reach USD 4.48 billion in 2025, and is projected to expand at a robust CAGR of 4.48% through 2033. This expansion is largely fueled by the increasing demand for advanced diagnostics, groundbreaking drug discovery initiatives, and a deeper understanding of complex biological pathways. The burgeoning fields of immunology, infectious diseases, stem cell research, and oncology are primary beneficiaries and drivers of this market. Innovations in antibody production technologies, such as the development of highly specific monoclonal antibodies and advanced recombinant antibody platforms, are contributing to improved research outcomes and are thus propelling market adoption. Furthermore, the growing emphasis on personalized medicine and the increasing prevalence of chronic diseases globally are creating sustained demand for reliable and high-quality research antibodies.
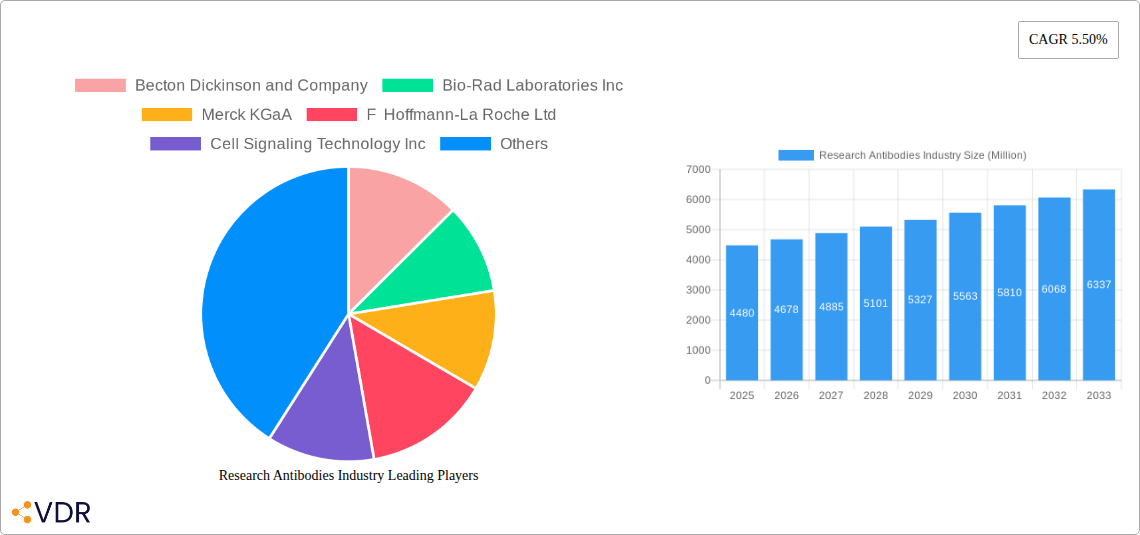
Research Antibodies Industry Market Size (In Billion)
The market landscape is characterized by intense competition, with key players like Thermo Fisher Scientific, Becton Dickinson and Company, and Merck KGaA investing heavily in research and development to expand their product portfolios and geographical reach. The market segmentation reveals a strong preference for Monoclonal Antibodies due to their specificity and reproducibility, although Polyclonal Antibodies continue to hold a significant share, particularly in applications requiring broader epitope recognition. Rabbit and Mouse remain the dominant animal sources for antibody production, offering a balance of immunogenicity and ease of handling. Geographically, North America, driven by substantial R&D investments and a strong presence of biopharmaceutical companies, is expected to lead the market. However, the Asia Pacific region, propelled by a growing research infrastructure and increasing government funding for life sciences, presents the fastest-growing market, indicating a shifting global R&D paradigm.
Research Antibodies Industry Company Market Share
This in-depth report provides a comprehensive analysis of the global Research Antibodies industry, exploring its market dynamics, growth trajectories, competitive landscape, and future potential. Spanning the period from 2019 to 2033, with a base year of 2025, this report offers critical insights for stakeholders including researchers, manufacturers, investors, and policymakers. Delve into the intricacies of monoclonal and polyclonal antibody markets, understand regional dominance, and identify key growth drivers and emerging opportunities.
Research Antibodies Industry Market Dynamics & Structure
The research antibodies market is characterized by a moderately concentrated landscape, with several large, established players alongside a growing number of specialized biotechnology firms. Technological innovation serves as a primary driver, with advancements in antibody engineering, recombinant technologies, and multiplex immunoassay development continuously pushing the boundaries of research capabilities. The regulatory framework, while essential for quality and safety, can present barriers to entry and innovation, particularly concerning novel antibody applications and manufacturing processes. Competitive product substitutes, such as aptamers and alternative detection methods, exist but have yet to fully displace the established utility of antibodies in many research workflows. End-user demographics are diverse, encompassing academic institutions, pharmaceutical and biotechnology companies, contract research organizations (CROs), and government research agencies. Mergers and acquisitions (M&A) trends are evident as companies seek to expand their product portfolios, gain access to new technologies, and consolidate market share. For instance, recent M&A activities have seen larger entities acquire specialized antibody developers to bolster their offerings in niche research areas.
- Market Concentration: Dominated by key players, but with increasing fragmentation due to specialized niche providers.
- Technological Innovation Drivers: Advancements in recombinant antibody production, high-throughput screening, and in vivo targeting technologies.
- Regulatory Frameworks: Strict quality control and approval processes are crucial but can impact development timelines.
- Competitive Product Substitutes: Emerging alternatives are gaining traction but have not yet replaced the broad utility of antibodies.
- End-User Demographics: Broad adoption across academic, pharmaceutical, biotech, and CRO sectors.
- M&A Trends: Ongoing consolidation and strategic acquisitions to enhance product portfolios and market reach.
Research Antibodies Industry Growth Trends & Insights
The global Research Antibodies market is poised for robust expansion, driven by escalating investments in life sciences research and development. The market size is projected to witness significant growth from approximately $10.2 billion in 2025 to an estimated $17.5 billion by 2033, exhibiting a Compound Annual Growth Rate (CAGR) of approximately 6.9% during the forecast period. This upward trajectory is fueled by the increasing prevalence of chronic diseases, the burgeoning field of personalized medicine, and the continuous pursuit of novel therapeutic targets and diagnostic tools. Adoption rates for high-specificity and high-affinity antibodies are steadily rising as researchers demand more precise and reliable tools for complex biological investigations. Technological disruptions, such as advancements in single-cell analysis, CRISPR-based gene editing, and the development of multiplexed detection platforms, are further accelerating market penetration. Consumer behavior is shifting towards a preference for validated antibodies, custom antibody services, and integrated antibody-based solutions that simplify experimental workflows.
The historical period (2019-2024) saw a steady increase in demand, with the market size growing from an estimated $7.8 billion in 2019 to $9.6 billion in 2024. This growth was primarily attributed to increased government funding for basic research, the expanding pipeline of biopharmaceutical drugs, and the growing adoption of antibody-based diagnostics. The COVID-19 pandemic, while initially disruptive to some research activities, also spurred significant demand for antibodies used in infectious disease research, vaccine development, and diagnostic testing, providing a notable boost to specific segments of the market. Looking ahead, the integration of AI and machine learning in antibody design and discovery is expected to streamline development processes, reduce costs, and further enhance the performance of research antibodies, contributing to sustained market growth. The growing emphasis on translational research, bridging the gap between laboratory discoveries and clinical applications, also plays a pivotal role in driving the demand for reliable and versatile research antibodies across various therapeutic areas.
Dominant Regions, Countries, or Segments in Research Antibodies Industry
North America currently holds a dominant position in the global research antibodies market, driven by a confluence of factors including a robust academic research infrastructure, significant government funding for scientific initiatives, and a thriving biopharmaceutical industry. The United States, in particular, represents a major market share, fueled by extensive research in immunology, oncology, and infectious diseases, coupled with a high concentration of leading pharmaceutical and biotechnology companies. The Monoclonal Antibodies segment, within the Type category, is a key driver of this regional dominance, accounting for a substantial portion of the market revenue due to their high specificity and therapeutic potential.
Key drivers contributing to North America's leadership include:
- Strong R&D Investment: Significant public and private funding allocated to life sciences research.
- Advanced Technological Adoption: Early and widespread integration of cutting-edge research tools and techniques.
- Presence of Key Market Players: Headquarters and substantial operations of major antibody manufacturers and research institutions.
- Favorable Regulatory Environment: A relatively streamlined pathway for research and development, coupled with strong intellectual property protection.
Within the Source segment, antibodies derived from Rabbit and Mouse sources are particularly prevalent due to established production methods and broad availability. In terms of Product, Primary antibodies represent a larger market share, forming the crucial first step in many immunoassays and detection methods. The Application segment showcasing the strongest growth and dominance is Immunology and Oncology, reflecting the intense research efforts in understanding and treating these complex diseases. The increasing demand for personalized cancer therapies and the intricate study of immune responses are significantly boosting the market for specialized antibodies in these areas. The market share within North America is estimated to be over 35% of the global market value for research antibodies, with a projected growth rate that slightly outpaces the global average.
Research Antibodies Industry Product Landscape
The product landscape of the research antibodies industry is defined by a continuous stream of innovations aimed at enhancing specificity, sensitivity, and multiplexing capabilities. Monoclonal antibodies, known for their precise binding to a single epitope, continue to be a cornerstone, with ongoing advancements in recombinant production and engineering to improve affinity and reduce off-target binding. Polyclonal antibodies, while less specific, offer broader epitope recognition and are valuable for detecting subtle protein expression changes. The development of highly validated primary antibodies, crucial for reliable Western blotting, immunohistochemistry, and ELISA assays, remains a key focus. Furthermore, the increasing demand for secondary antibodies conjugated with a wide array of fluorophores and enzymes facilitates advanced imaging and high-throughput screening applications. Unique selling propositions often revolve around extensive validation data, custom antibody generation services, and the availability of antibodies targeting novel or challenging protein targets.
Key Drivers, Barriers & Challenges in Research Antibodies Industry
Key Drivers:
- Advancements in Omics Technologies: The exponential growth of genomics, proteomics, and transcriptomics necessitates advanced antibody tools for target validation and pathway analysis.
- Growing Demand for Biologics and Biosimilars: The expansion of the biopharmaceutical industry fuels the need for antibodies in drug discovery, development, and quality control.
- Increasing Prevalence of Chronic Diseases: Research into cancer, autoimmune disorders, and neurodegenerative diseases drives demand for specialized antibodies.
- Personalized Medicine Initiatives: The drive towards tailored treatments requires highly specific antibodies for biomarker identification and patient stratification.
Barriers & Challenges:
- High Cost of Production and Validation: Generating high-quality, well-validated antibodies can be expensive and time-consuming.
- Batch-to-Batch Variability: Ensuring consistent performance across different production lots remains a challenge for many antibody manufacturers.
- Complex Regulatory Landscape: Navigating diverse and evolving regulations for research reagents can be a hurdle for market entry and product development.
- Intellectual Property Protection: Securing and defending intellectual property for novel antibodies and production methods is critical.
- Supply Chain Disruptions: Global events can impact the availability of raw materials and reagents essential for antibody production.
- Competition from Alternative Technologies: While antibodies remain dominant, emerging technologies pose a competitive threat in specific research applications.
Emerging Opportunities in Research Antibodies Industry
Emerging opportunities in the research antibodies industry lie in the development of highly multiplexed antibody panels for advanced diagnostics and single-cell analysis, enabling a deeper understanding of cellular heterogeneity and complex biological interactions. The burgeoning field of drug discovery for rare diseases presents a significant untapped market, requiring the development of specialized antibodies targeting novel pathways and disease mechanisms. Furthermore, the growing adoption of in vivo imaging and therapeutic antibodies is opening new avenues for antibody development beyond traditional in vitro applications. The increasing demand for custom antibody services for personalized research projects and the development of antibodies for emerging therapeutic modalities, such as antibody-drug conjugates (ADCs) and bispecific antibodies, also represent significant growth areas.
Growth Accelerators in the Research Antibodies Industry Industry
Growth in the research antibodies industry is being significantly accelerated by technological breakthroughs in antibody engineering, including the use of AI and machine learning for antibody design, leading to faster development cycles and improved antibody performance. Strategic partnerships between antibody manufacturers and academic institutions, as well as collaborations with pharmaceutical and biotechnology companies, are crucial for co-development and market penetration of novel antibody solutions. The expanding market for in vitro diagnostics (IVD), particularly in areas like oncology and infectious diseases, is a major growth accelerator, as antibodies form the backbone of many diagnostic tests. Market expansion strategies focused on emerging economies with growing research investments and the increasing outsourcing of research activities by pharmaceutical companies to contract research organizations (CROs) are also contributing to sustained growth.
Key Players Shaping the Research Antibodies Industry Market
- Thermo Fisher Scientific
- Merck KGaA
- Becton Dickinson and Company
- Bio-Rad Laboratories Inc
- F Hoffmann-La Roche Ltd
- Cell Signaling Technology Inc
- Abcam plc
- Agilent Technologies
- PerkinElmer Inc
- Lonza
Notable Milestones in Research Antibodies Industry Sector
- 2019: Launch of advanced recombinant antibody platforms by multiple companies, improving consistency and reducing animal use.
- 2020: Increased demand for antibodies targeting SARS-CoV-2 for diagnostic and research purposes, leading to rapid development and deployment.
- 2021: Significant advancements in CRISPR-based antibody engineering, offering novel approaches to antibody generation.
- 2022: Growth in the market for highly multiplexed antibody panels for advanced single-cell analysis.
- 2023: Increased investment in AI-driven antibody design and discovery by major industry players.
- 2024: Expansion of custom antibody services to cater to the growing needs of personalized research and drug development.
In-Depth Research Antibodies Industry Market Outlook
The future outlook for the research antibodies industry is exceptionally bright, driven by an unyielding demand for innovative solutions in life sciences research and diagnostics. Continued investment in the development of highly specific and sensitive antibodies for complex biological systems, coupled with advancements in multiplexing and high-throughput screening technologies, will be key growth catalysts. The increasing focus on personalized medicine and the burgeoning biopharmaceutical sector will ensure sustained demand for antibodies across various stages of drug discovery and development. Strategic partnerships, the adoption of advanced manufacturing techniques like continuous bioprocessing, and a focus on emerging markets will further propel market expansion, solidifying the indispensable role of research antibodies in scientific advancement and human health.
Research Antibodies Industry Segmentation
-
1. Type
- 1.1. Monoclonal Antibodies
- 1.2. Polyclonal Antibodies
-
2. Source
- 2.1. Rabbit
- 2.2. Mouse
- 2.3. Goat
- 2.4. Others
-
3. Product
- 3.1. Primary
- 3.2. Secondary
-
4. Application
- 4.1. Immunology
- 4.2. Infectious Diseases
- 4.3. Stem Cells
- 4.4. Oncology
- 4.5. Others
Research Antibodies Industry Segmentation By Geography
-
1. North America
- 1.1. United States
- 1.2. Canada
- 1.3. Mexico
-
2. Europe
- 2.1. Germany
- 2.2. United Kingdom
- 2.3. France
- 2.4. Italy
- 2.5. Spain
- 2.6. Rest of Europe
-
3. Asia Pacific
- 3.1. China
- 3.2. Japan
- 3.3. India
- 3.4. Australia
- 3.5. South Korea
- 3.6. Rest of Asia Pacific
-
4. Middle East and Africa
- 4.1. GCC
- 4.2. South Africa
- 4.3. Rest of Middle East and Africa
-
5. South America
- 5.1. Brazil
- 5.2. Argentina
- 5.3. Rest of South America
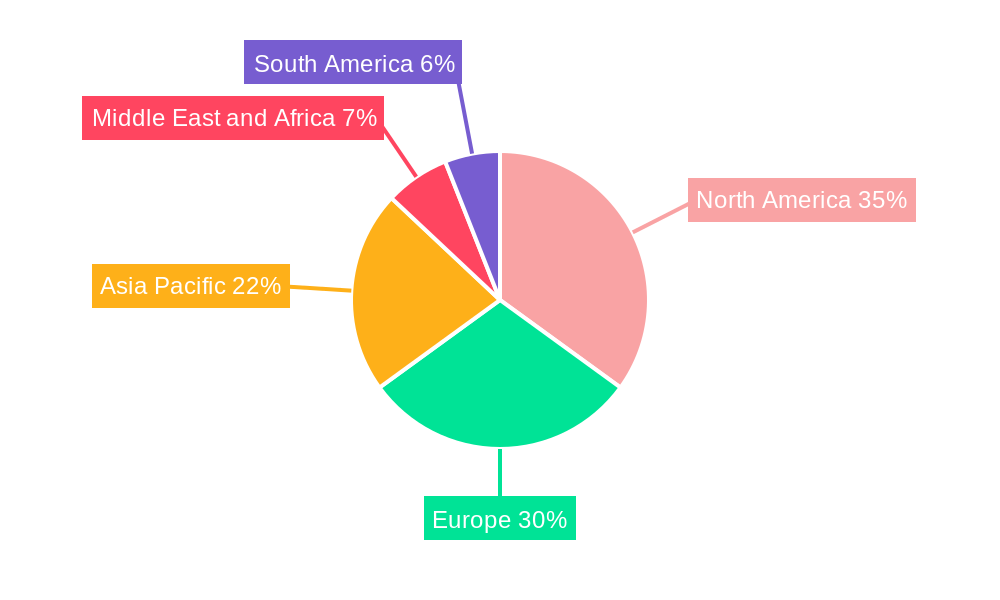
Research Antibodies Industry Regional Market Share
Geographic Coverage of Research Antibodies Industry
Research Antibodies Industry REPORT HIGHLIGHTS
| Aspects | Details |
|---|---|
| Study Period | 2020-2034 |
| Base Year | 2025 |
| Estimated Year | 2026 |
| Forecast Period | 2026-2034 |
| Historical Period | 2020-2025 |
| Growth Rate | CAGR of 5% from 2020-2034 |
| Segmentation |
|
Table of Contents
- 1. Introduction
- 1.1. Research Scope
- 1.2. Market Segmentation
- 1.3. Research Objective
- 1.4. Definitions and Assumptions
- 2. Executive Summary
- 2.1. Market Snapshot
- 3. Market Dynamics
- 3.1. Market Drivers
- 3.2. Market Restrains
- 3.3. Market Trends
- 3.4. Market Opportunities
- 4. Market Factor Analysis
- 4.1. Porters Five Forces
- 4.1.1. Bargaining Power of Suppliers
- 4.1.2. Bargaining Power of Buyers
- 4.1.3. Threat of New Entrants
- 4.1.4. Threat of Substitutes
- 4.1.5. Competitive Rivalry
- 4.2. PESTEL analysis
- 4.3. BCG Analysis
- 4.3.1. Stars (High Growth, High Market Share)
- 4.3.2. Cash Cows (Low Growth, High Market Share)
- 4.3.3. Question Mark (High Growth, Low Market Share)
- 4.3.4. Dogs (Low Growth, Low Market Share)
- 4.4. Ansoff Matrix Analysis
- 4.5. Supply Chain Analysis
- 4.6. Regulatory Landscape
- 4.7. Current Market Potential and Opportunity Assessment (TAM–SAM–SOM Framework)
- 4.8. VDR Analyst Note
- 4.1. Porters Five Forces
- 5. Market Analysis, Insights and Forecast 2021-2033
- 5.1. Market Analysis, Insights and Forecast - by Type
- 5.1.1. Monoclonal Antibodies
- 5.1.2. Polyclonal Antibodies
- 5.2. Market Analysis, Insights and Forecast - by Source
- 5.2.1. Rabbit
- 5.2.2. Mouse
- 5.2.3. Goat
- 5.2.4. Others
- 5.3. Market Analysis, Insights and Forecast - by Product
- 5.3.1. Primary
- 5.3.2. Secondary
- 5.4. Market Analysis, Insights and Forecast - by Application
- 5.4.1. Immunology
- 5.4.2. Infectious Diseases
- 5.4.3. Stem Cells
- 5.4.4. Oncology
- 5.4.5. Others
- 5.5. Market Analysis, Insights and Forecast - by Region
- 5.5.1. North America
- 5.5.2. Europe
- 5.5.3. Asia Pacific
- 5.5.4. Middle East and Africa
- 5.5.5. South America
- 5.1. Market Analysis, Insights and Forecast - by Type
- 6. Global Research Antibodies Industry Analysis, Insights and Forecast, 2021-2033
- 6.1. Market Analysis, Insights and Forecast - by Type
- 6.1.1. Monoclonal Antibodies
- 6.1.2. Polyclonal Antibodies
- 6.2. Market Analysis, Insights and Forecast - by Source
- 6.2.1. Rabbit
- 6.2.2. Mouse
- 6.2.3. Goat
- 6.2.4. Others
- 6.3. Market Analysis, Insights and Forecast - by Product
- 6.3.1. Primary
- 6.3.2. Secondary
- 6.4. Market Analysis, Insights and Forecast - by Application
- 6.4.1. Immunology
- 6.4.2. Infectious Diseases
- 6.4.3. Stem Cells
- 6.4.4. Oncology
- 6.4.5. Others
- 6.1. Market Analysis, Insights and Forecast - by Type
- 7. North America Research Antibodies Industry Analysis, Insights and Forecast, 2021-2033
- 7.1. Market Analysis, Insights and Forecast - by Type
- 7.1.1. Monoclonal Antibodies
- 7.1.2. Polyclonal Antibodies
- 7.2. Market Analysis, Insights and Forecast - by Source
- 7.2.1. Rabbit
- 7.2.2. Mouse
- 7.2.3. Goat
- 7.2.4. Others
- 7.3. Market Analysis, Insights and Forecast - by Product
- 7.3.1. Primary
- 7.3.2. Secondary
- 7.4. Market Analysis, Insights and Forecast - by Application
- 7.4.1. Immunology
- 7.4.2. Infectious Diseases
- 7.4.3. Stem Cells
- 7.4.4. Oncology
- 7.4.5. Others
- 7.1. Market Analysis, Insights and Forecast - by Type
- 8. Europe Research Antibodies Industry Analysis, Insights and Forecast, 2021-2033
- 8.1. Market Analysis, Insights and Forecast - by Type
- 8.1.1. Monoclonal Antibodies
- 8.1.2. Polyclonal Antibodies
- 8.2. Market Analysis, Insights and Forecast - by Source
- 8.2.1. Rabbit
- 8.2.2. Mouse
- 8.2.3. Goat
- 8.2.4. Others
- 8.3. Market Analysis, Insights and Forecast - by Product
- 8.3.1. Primary
- 8.3.2. Secondary
- 8.4. Market Analysis, Insights and Forecast - by Application
- 8.4.1. Immunology
- 8.4.2. Infectious Diseases
- 8.4.3. Stem Cells
- 8.4.4. Oncology
- 8.4.5. Others
- 8.1. Market Analysis, Insights and Forecast - by Type
- 9. Asia Pacific Research Antibodies Industry Analysis, Insights and Forecast, 2021-2033
- 9.1. Market Analysis, Insights and Forecast - by Type
- 9.1.1. Monoclonal Antibodies
- 9.1.2. Polyclonal Antibodies
- 9.2. Market Analysis, Insights and Forecast - by Source
- 9.2.1. Rabbit
- 9.2.2. Mouse
- 9.2.3. Goat
- 9.2.4. Others
- 9.3. Market Analysis, Insights and Forecast - by Product
- 9.3.1. Primary
- 9.3.2. Secondary
- 9.4. Market Analysis, Insights and Forecast - by Application
- 9.4.1. Immunology
- 9.4.2. Infectious Diseases
- 9.4.3. Stem Cells
- 9.4.4. Oncology
- 9.4.5. Others
- 9.1. Market Analysis, Insights and Forecast - by Type
- 10. Middle East and Africa Research Antibodies Industry Analysis, Insights and Forecast, 2021-2033
- 10.1. Market Analysis, Insights and Forecast - by Type
- 10.1.1. Monoclonal Antibodies
- 10.1.2. Polyclonal Antibodies
- 10.2. Market Analysis, Insights and Forecast - by Source
- 10.2.1. Rabbit
- 10.2.2. Mouse
- 10.2.3. Goat
- 10.2.4. Others
- 10.3. Market Analysis, Insights and Forecast - by Product
- 10.3.1. Primary
- 10.3.2. Secondary
- 10.4. Market Analysis, Insights and Forecast - by Application
- 10.4.1. Immunology
- 10.4.2. Infectious Diseases
- 10.4.3. Stem Cells
- 10.4.4. Oncology
- 10.4.5. Others
- 10.1. Market Analysis, Insights and Forecast - by Type
- 11. South America Research Antibodies Industry Analysis, Insights and Forecast, 2021-2033
- 11.1. Market Analysis, Insights and Forecast - by Type
- 11.1.1. Monoclonal Antibodies
- 11.1.2. Polyclonal Antibodies
- 11.2. Market Analysis, Insights and Forecast - by Source
- 11.2.1. Rabbit
- 11.2.2. Mouse
- 11.2.3. Goat
- 11.2.4. Others
- 11.3. Market Analysis, Insights and Forecast - by Product
- 11.3.1. Primary
- 11.3.2. Secondary
- 11.4. Market Analysis, Insights and Forecast - by Application
- 11.4.1. Immunology
- 11.4.2. Infectious Diseases
- 11.4.3. Stem Cells
- 11.4.4. Oncology
- 11.4.5. Others
- 11.1. Market Analysis, Insights and Forecast - by Type
- 12. Competitive Analysis
- 12.1. Company Profiles
- 12.1.1 Becton Dickinson and Company
- 12.1.1.1. Company Overview
- 12.1.1.2. Products
- 12.1.1.3. Company Financials
- 12.1.1.4. SWOT Analysis
- 12.1.2 Bio-Rad Laboratories Inc
- 12.1.2.1. Company Overview
- 12.1.2.2. Products
- 12.1.2.3. Company Financials
- 12.1.2.4. SWOT Analysis
- 12.1.3 Merck KGaA
- 12.1.3.1. Company Overview
- 12.1.3.2. Products
- 12.1.3.3. Company Financials
- 12.1.3.4. SWOT Analysis
- 12.1.4 F Hoffmann-La Roche Ltd
- 12.1.4.1. Company Overview
- 12.1.4.2. Products
- 12.1.4.3. Company Financials
- 12.1.4.4. SWOT Analysis
- 12.1.5 Cell Signaling Technology Inc
- 12.1.5.1. Company Overview
- 12.1.5.2. Products
- 12.1.5.3. Company Financials
- 12.1.5.4. SWOT Analysis
- 12.1.6 Abcam plc
- 12.1.6.1. Company Overview
- 12.1.6.2. Products
- 12.1.6.3. Company Financials
- 12.1.6.4. SWOT Analysis
- 12.1.7 Agilent Technologies*List Not Exhaustive
- 12.1.7.1. Company Overview
- 12.1.7.2. Products
- 12.1.7.3. Company Financials
- 12.1.7.4. SWOT Analysis
- 12.1.8 PerkinElmer Inc
- 12.1.8.1. Company Overview
- 12.1.8.2. Products
- 12.1.8.3. Company Financials
- 12.1.8.4. SWOT Analysis
- 12.1.9 Lonza
- 12.1.9.1. Company Overview
- 12.1.9.2. Products
- 12.1.9.3. Company Financials
- 12.1.9.4. SWOT Analysis
- 12.1.10 Thermo Fisher Scientific
- 12.1.10.1. Company Overview
- 12.1.10.2. Products
- 12.1.10.3. Company Financials
- 12.1.10.4. SWOT Analysis
- 12.1.1 Becton Dickinson and Company
- 12.2. Market Entropy
- 12.2.1 Company's Key Areas Served
- 12.2.2 Recent Developments
- 12.3. Company Market Share Analysis 2025
- 12.3.1 Top 5 Companies Market Share Analysis
- 12.3.2 Top 3 Companies Market Share Analysis
- 12.4. List of Potential Customers
- 13. Research Methodology
List of Figures
- Figure 1: Global Research Antibodies Industry Revenue Breakdown (billion, %) by Region 2025 & 2033
- Figure 2: North America Research Antibodies Industry Revenue (billion), by Type 2025 & 2033
- Figure 3: North America Research Antibodies Industry Revenue Share (%), by Type 2025 & 2033
- Figure 4: North America Research Antibodies Industry Revenue (billion), by Source 2025 & 2033
- Figure 5: North America Research Antibodies Industry Revenue Share (%), by Source 2025 & 2033
- Figure 6: North America Research Antibodies Industry Revenue (billion), by Product 2025 & 2033
- Figure 7: North America Research Antibodies Industry Revenue Share (%), by Product 2025 & 2033
- Figure 8: North America Research Antibodies Industry Revenue (billion), by Application 2025 & 2033
- Figure 9: North America Research Antibodies Industry Revenue Share (%), by Application 2025 & 2033
- Figure 10: North America Research Antibodies Industry Revenue (billion), by Country 2025 & 2033
- Figure 11: North America Research Antibodies Industry Revenue Share (%), by Country 2025 & 2033
- Figure 12: Europe Research Antibodies Industry Revenue (billion), by Type 2025 & 2033
- Figure 13: Europe Research Antibodies Industry Revenue Share (%), by Type 2025 & 2033
- Figure 14: Europe Research Antibodies Industry Revenue (billion), by Source 2025 & 2033
- Figure 15: Europe Research Antibodies Industry Revenue Share (%), by Source 2025 & 2033
- Figure 16: Europe Research Antibodies Industry Revenue (billion), by Product 2025 & 2033
- Figure 17: Europe Research Antibodies Industry Revenue Share (%), by Product 2025 & 2033
- Figure 18: Europe Research Antibodies Industry Revenue (billion), by Application 2025 & 2033
- Figure 19: Europe Research Antibodies Industry Revenue Share (%), by Application 2025 & 2033
- Figure 20: Europe Research Antibodies Industry Revenue (billion), by Country 2025 & 2033
- Figure 21: Europe Research Antibodies Industry Revenue Share (%), by Country 2025 & 2033
- Figure 22: Asia Pacific Research Antibodies Industry Revenue (billion), by Type 2025 & 2033
- Figure 23: Asia Pacific Research Antibodies Industry Revenue Share (%), by Type 2025 & 2033
- Figure 24: Asia Pacific Research Antibodies Industry Revenue (billion), by Source 2025 & 2033
- Figure 25: Asia Pacific Research Antibodies Industry Revenue Share (%), by Source 2025 & 2033
- Figure 26: Asia Pacific Research Antibodies Industry Revenue (billion), by Product 2025 & 2033
- Figure 27: Asia Pacific Research Antibodies Industry Revenue Share (%), by Product 2025 & 2033
- Figure 28: Asia Pacific Research Antibodies Industry Revenue (billion), by Application 2025 & 2033
- Figure 29: Asia Pacific Research Antibodies Industry Revenue Share (%), by Application 2025 & 2033
- Figure 30: Asia Pacific Research Antibodies Industry Revenue (billion), by Country 2025 & 2033
- Figure 31: Asia Pacific Research Antibodies Industry Revenue Share (%), by Country 2025 & 2033
- Figure 32: Middle East and Africa Research Antibodies Industry Revenue (billion), by Type 2025 & 2033
- Figure 33: Middle East and Africa Research Antibodies Industry Revenue Share (%), by Type 2025 & 2033
- Figure 34: Middle East and Africa Research Antibodies Industry Revenue (billion), by Source 2025 & 2033
- Figure 35: Middle East and Africa Research Antibodies Industry Revenue Share (%), by Source 2025 & 2033
- Figure 36: Middle East and Africa Research Antibodies Industry Revenue (billion), by Product 2025 & 2033
- Figure 37: Middle East and Africa Research Antibodies Industry Revenue Share (%), by Product 2025 & 2033
- Figure 38: Middle East and Africa Research Antibodies Industry Revenue (billion), by Application 2025 & 2033
- Figure 39: Middle East and Africa Research Antibodies Industry Revenue Share (%), by Application 2025 & 2033
- Figure 40: Middle East and Africa Research Antibodies Industry Revenue (billion), by Country 2025 & 2033
- Figure 41: Middle East and Africa Research Antibodies Industry Revenue Share (%), by Country 2025 & 2033
- Figure 42: South America Research Antibodies Industry Revenue (billion), by Type 2025 & 2033
- Figure 43: South America Research Antibodies Industry Revenue Share (%), by Type 2025 & 2033
- Figure 44: South America Research Antibodies Industry Revenue (billion), by Source 2025 & 2033
- Figure 45: South America Research Antibodies Industry Revenue Share (%), by Source 2025 & 2033
- Figure 46: South America Research Antibodies Industry Revenue (billion), by Product 2025 & 2033
- Figure 47: South America Research Antibodies Industry Revenue Share (%), by Product 2025 & 2033
- Figure 48: South America Research Antibodies Industry Revenue (billion), by Application 2025 & 2033
- Figure 49: South America Research Antibodies Industry Revenue Share (%), by Application 2025 & 2033
- Figure 50: South America Research Antibodies Industry Revenue (billion), by Country 2025 & 2033
- Figure 51: South America Research Antibodies Industry Revenue Share (%), by Country 2025 & 2033
List of Tables
- Table 1: Global Research Antibodies Industry Revenue billion Forecast, by Type 2020 & 2033
- Table 2: Global Research Antibodies Industry Revenue billion Forecast, by Source 2020 & 2033
- Table 3: Global Research Antibodies Industry Revenue billion Forecast, by Product 2020 & 2033
- Table 4: Global Research Antibodies Industry Revenue billion Forecast, by Application 2020 & 2033
- Table 5: Global Research Antibodies Industry Revenue billion Forecast, by Region 2020 & 2033
- Table 6: Global Research Antibodies Industry Revenue billion Forecast, by Type 2020 & 2033
- Table 7: Global Research Antibodies Industry Revenue billion Forecast, by Source 2020 & 2033
- Table 8: Global Research Antibodies Industry Revenue billion Forecast, by Product 2020 & 2033
- Table 9: Global Research Antibodies Industry Revenue billion Forecast, by Application 2020 & 2033
- Table 10: Global Research Antibodies Industry Revenue billion Forecast, by Country 2020 & 2033
- Table 11: United States Research Antibodies Industry Revenue (billion) Forecast, by Application 2020 & 2033
- Table 12: Canada Research Antibodies Industry Revenue (billion) Forecast, by Application 2020 & 2033
- Table 13: Mexico Research Antibodies Industry Revenue (billion) Forecast, by Application 2020 & 2033
- Table 14: Global Research Antibodies Industry Revenue billion Forecast, by Type 2020 & 2033
- Table 15: Global Research Antibodies Industry Revenue billion Forecast, by Source 2020 & 2033
- Table 16: Global Research Antibodies Industry Revenue billion Forecast, by Product 2020 & 2033
- Table 17: Global Research Antibodies Industry Revenue billion Forecast, by Application 2020 & 2033
- Table 18: Global Research Antibodies Industry Revenue billion Forecast, by Country 2020 & 2033
- Table 19: Germany Research Antibodies Industry Revenue (billion) Forecast, by Application 2020 & 2033
- Table 20: United Kingdom Research Antibodies Industry Revenue (billion) Forecast, by Application 2020 & 2033
- Table 21: France Research Antibodies Industry Revenue (billion) Forecast, by Application 2020 & 2033
- Table 22: Italy Research Antibodies Industry Revenue (billion) Forecast, by Application 2020 & 2033
- Table 23: Spain Research Antibodies Industry Revenue (billion) Forecast, by Application 2020 & 2033
- Table 24: Rest of Europe Research Antibodies Industry Revenue (billion) Forecast, by Application 2020 & 2033
- Table 25: Global Research Antibodies Industry Revenue billion Forecast, by Type 2020 & 2033
- Table 26: Global Research Antibodies Industry Revenue billion Forecast, by Source 2020 & 2033
- Table 27: Global Research Antibodies Industry Revenue billion Forecast, by Product 2020 & 2033
- Table 28: Global Research Antibodies Industry Revenue billion Forecast, by Application 2020 & 2033
- Table 29: Global Research Antibodies Industry Revenue billion Forecast, by Country 2020 & 2033
- Table 30: China Research Antibodies Industry Revenue (billion) Forecast, by Application 2020 & 2033
- Table 31: Japan Research Antibodies Industry Revenue (billion) Forecast, by Application 2020 & 2033
- Table 32: India Research Antibodies Industry Revenue (billion) Forecast, by Application 2020 & 2033
- Table 33: Australia Research Antibodies Industry Revenue (billion) Forecast, by Application 2020 & 2033
- Table 34: South Korea Research Antibodies Industry Revenue (billion) Forecast, by Application 2020 & 2033
- Table 35: Rest of Asia Pacific Research Antibodies Industry Revenue (billion) Forecast, by Application 2020 & 2033
- Table 36: Global Research Antibodies Industry Revenue billion Forecast, by Type 2020 & 2033
- Table 37: Global Research Antibodies Industry Revenue billion Forecast, by Source 2020 & 2033
- Table 38: Global Research Antibodies Industry Revenue billion Forecast, by Product 2020 & 2033
- Table 39: Global Research Antibodies Industry Revenue billion Forecast, by Application 2020 & 2033
- Table 40: Global Research Antibodies Industry Revenue billion Forecast, by Country 2020 & 2033
- Table 41: GCC Research Antibodies Industry Revenue (billion) Forecast, by Application 2020 & 2033
- Table 42: South Africa Research Antibodies Industry Revenue (billion) Forecast, by Application 2020 & 2033
- Table 43: Rest of Middle East and Africa Research Antibodies Industry Revenue (billion) Forecast, by Application 2020 & 2033
- Table 44: Global Research Antibodies Industry Revenue billion Forecast, by Type 2020 & 2033
- Table 45: Global Research Antibodies Industry Revenue billion Forecast, by Source 2020 & 2033
- Table 46: Global Research Antibodies Industry Revenue billion Forecast, by Product 2020 & 2033
- Table 47: Global Research Antibodies Industry Revenue billion Forecast, by Application 2020 & 2033
- Table 48: Global Research Antibodies Industry Revenue billion Forecast, by Country 2020 & 2033
- Table 49: Brazil Research Antibodies Industry Revenue (billion) Forecast, by Application 2020 & 2033
- Table 50: Argentina Research Antibodies Industry Revenue (billion) Forecast, by Application 2020 & 2033
- Table 51: Rest of South America Research Antibodies Industry Revenue (billion) Forecast, by Application 2020 & 2033
Frequently Asked Questions
1. What is the projected Compound Annual Growth Rate (CAGR) of the Research Antibodies Industry?
The projected CAGR is approximately 5%.
2. Which companies are prominent players in the Research Antibodies Industry?
Key companies in the market include Becton Dickinson and Company, Bio-Rad Laboratories Inc, Merck KGaA, F Hoffmann-La Roche Ltd, Cell Signaling Technology Inc, Abcam plc, Agilent Technologies*List Not Exhaustive, PerkinElmer Inc, Lonza, Thermo Fisher Scientific.
3. What are the main segments of the Research Antibodies Industry?
The market segments include Type, Source, Product, Application.
4. Can you provide details about the market size?
The market size is estimated to be USD 4.64 billion as of 2022.
5. What are some drivers contributing to market growth?
; Increasing Investment In R&D; Increase In Research Academies And Industry Collaborations; Rise In Proteomics And Genomics Research.
6. What are the notable trends driving market growth?
Primary Antibodies in Research Antibodies is Estimated to Witness a Healthy Growth in Future..
7. Are there any restraints impacting market growth?
; High Cost Of Research Antibodies.
8. Can you provide examples of recent developments in the market?
N/A
9. What pricing options are available for accessing the report?
Pricing options include single-user, multi-user, and enterprise licenses priced at USD 4750, USD 5250, and USD 8750 respectively.
10. Is the market size provided in terms of value or volume?
The market size is provided in terms of value, measured in billion.
11. Are there any specific market keywords associated with the report?
Yes, the market keyword associated with the report is "Research Antibodies Industry," which aids in identifying and referencing the specific market segment covered.
12. How do I determine which pricing option suits my needs best?
The pricing options vary based on user requirements and access needs. Individual users may opt for single-user licenses, while businesses requiring broader access may choose multi-user or enterprise licenses for cost-effective access to the report.
13. Are there any additional resources or data provided in the Research Antibodies Industry report?
While the report offers comprehensive insights, it's advisable to review the specific contents or supplementary materials provided to ascertain if additional resources or data are available.
14. How can I stay updated on further developments or reports in the Research Antibodies Industry?
To stay informed about further developments, trends, and reports in the Research Antibodies Industry, consider subscribing to industry newsletters, following relevant companies and organizations, or regularly checking reputable industry news sources and publications.
Methodology
Step 1 - Identification of Relevant Samples Size from Population Database


Step 2 - Approaches for Defining Global Market Size (Value, Volume* & Price*)

Note*: In applicable scenarios
Step 3 - Data Sources
Primary Research
- Web Analytics
- Survey Reports
- Research Institute
- Latest Research Reports
- Opinion Leaders
Secondary Research
- Annual Reports
- White Paper
- Latest Press Release
- Industry Association
- Paid Database
- Investor Presentations

Step 4 - Data Triangulation
Involves using different sources of information in order to increase the validity of a study
These sources are likely to be stakeholders in a program - participants, other researchers, program staff, other community members, and so on.
Then we put all data in single framework & apply various statistical tools to find out the dynamic on the market.
During the analysis stage, feedback from the stakeholder groups would be compared to determine areas of agreement as well as areas of divergence