
Key Insights
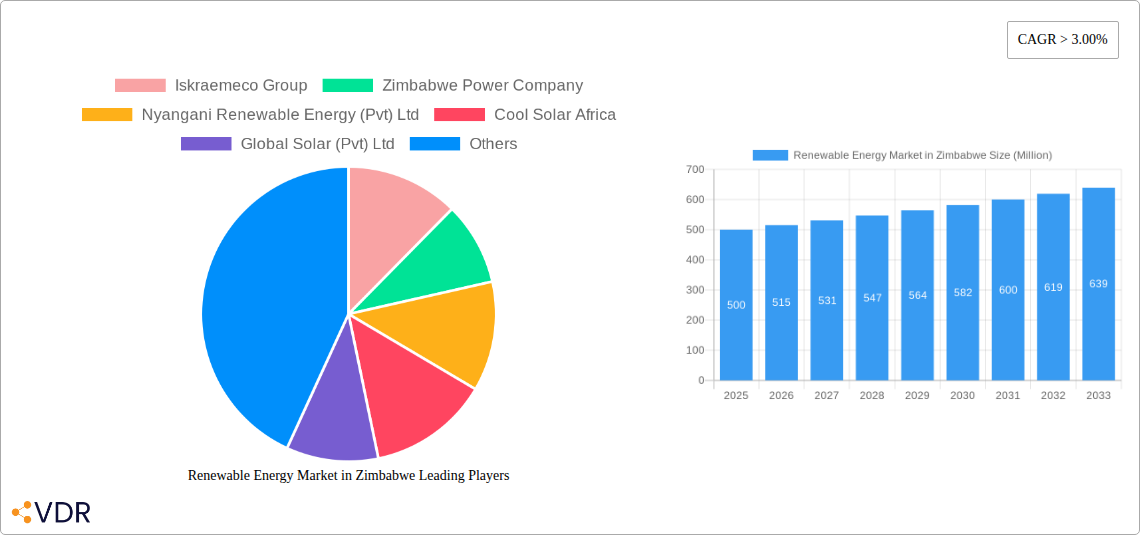
The Zimbabwean renewable energy market, currently valued at an estimated $500 million in 2025, is poised for substantial growth, projected to expand at a compound annual growth rate (CAGR) exceeding 3% from 2025 to 2033. This growth is driven by several factors. Firstly, Zimbabwe faces significant electricity shortages, creating a strong demand for reliable and sustainable energy sources. Secondly, the government actively promotes renewable energy adoption through supportive policies and incentives, aiming to diversify the energy mix and enhance energy security. Hydropower, currently a dominant player, will continue to be a significant contributor, alongside the rapidly expanding solar power sector fueled by decreasing solar technology costs and increasing private investment. Bioenergy also presents a promising segment, particularly in rural areas, leveraging abundant biomass resources. However, challenges remain, including the high upfront capital costs associated with renewable energy projects, limited access to financing for smaller-scale projects, and the need for grid infrastructure improvements to accommodate increased renewable energy generation. The growth trajectory is expected to be influenced by the success of government initiatives in attracting foreign investment, streamlining regulatory processes, and improving grid connectivity across the country. Key players like Iskraemeco Group, Zimbabwe Power Company, and various private solar companies are instrumental in shaping the market's future.
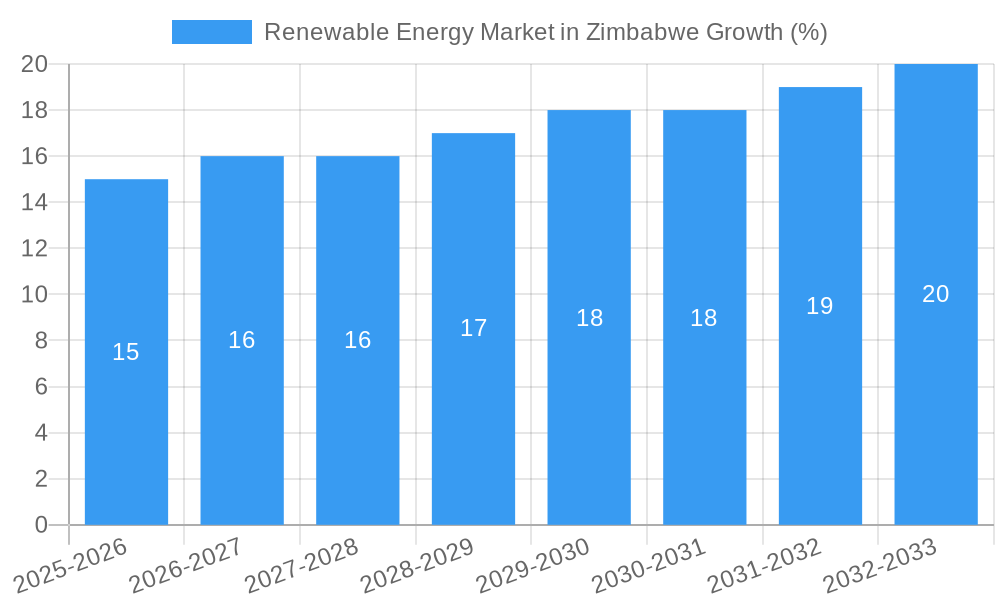
The forecast period (2025-2033) suggests a steadily increasing market size. The current growth rate, coupled with anticipated policy support and technological advancements, is likely to sustain this positive trajectory. While specific figures for future years are dependent on various factors, including macroeconomic conditions and technological breakthroughs, the current indicators suggest a robust and increasingly diverse renewable energy market in Zimbabwe. Further growth will depend on continued government support, improved access to finance for renewable energy ventures, and consistent efforts to address the challenges related to grid infrastructure. The market's resilience is underpinned by the pressing need for energy security and sustainable development, ensuring continued investment and innovation in the renewable energy sector in Zimbabwe.
Renewable Energy Market in Zimbabwe: A Comprehensive Report (2019-2033)
This comprehensive report provides a detailed analysis of the renewable energy market in Zimbabwe, covering market dynamics, growth trends, key players, and future outlook. The study period spans from 2019 to 2033, with 2025 as the base and estimated year. This report is invaluable for investors, industry professionals, and policymakers seeking to understand and capitalize on opportunities within this rapidly evolving sector.
Keywords: Zimbabwe renewable energy market, hydropower Zimbabwe, solar energy Zimbabwe, bioenergy Zimbabwe, renewable energy investment Zimbabwe, renewable energy policy Zimbabwe, Zimbabwe power sector, renewable energy companies Zimbabwe, renewable energy growth Zimbabwe, sustainable energy Zimbabwe.
Renewable Energy Market in Zimbabwe Market Dynamics & Structure
This section analyzes the Zimbabwean renewable energy market's structure, encompassing market concentration, technological innovation, regulatory frameworks, competitive dynamics, and M&A activity. The market is characterized by a mix of large established players and emerging smaller companies. Market concentration is moderate, with a few dominant players holding significant shares in specific segments. However, increasing participation from international investors and a supportive regulatory environment are fostering competition.
- Market Concentration: Moderate, with xx% market share held by the top 3 players.
- Technological Innovation: Primarily driven by advancements in solar PV technology and increased efficiency in hydropower generation. Barriers include limited access to advanced technologies and high initial investment costs.
- Regulatory Framework: Zimbabwe's government is actively promoting renewable energy development through supportive policies and incentives. However, bureaucratic processes and inconsistent implementation pose challenges.
- Competitive Product Substitutes: The main substitute is the continued reliance on fossil fuels, although cost competitiveness and environmental concerns are driving a shift towards renewables.
- End-User Demographics: The primary end-users are residential consumers, industrial facilities, and the national grid.
- M&A Trends: A moderate level of M&A activity has been observed, primarily involving smaller players seeking partnerships or acquisition by larger firms. The total deal value from 2019 to 2024 is estimated at xx Million USD.
Renewable Energy Market in Zimbabwe Growth Trends & Insights
The Zimbabwean renewable energy market is experiencing robust growth, driven by increasing energy demand, government support, and declining renewable energy technology costs. This section examines market size evolution, adoption rates, technological disruptions, and shifts in consumer behavior. The market size experienced a CAGR of xx% between 2019 and 2024, reaching xx Million USD in 2024. This is projected to reach xx Million USD by 2033, with a forecast CAGR of xx% during 2025-2033. Market penetration is steadily increasing, particularly in the solar PV sector. Technological advancements such as improved solar panel efficiency and battery storage solutions are accelerating adoption. Consumer behavior is shifting towards cost-effective and environmentally sustainable energy options.
Dominant Regions, Countries, or Segments in Renewable Energy Market in Zimbabwe
The solar segment dominates the renewable energy market in Zimbabwe, followed by hydropower and bioenergy. This dominance is attributed to several factors:
- Solar: Abundant sunshine, relatively lower upfront costs compared to hydropower, and a favorable policy environment for solar projects. This segment is expected to exhibit the highest growth rate over the forecast period.
- Hydropower: Existing established infrastructure and significant potential for further development, although constrained by water availability issues and environmental concerns.
- Bioenergy: Represents a smaller share of the market, but its growth is supported by the abundance of biomass resources and government incentives.
Other Generation Sources: xx Million USD in 2024, projected to grow to xx Million USD by 2033, driven by increased investment in wind and geothermal energy. The growth is limited by the high initial investment cost and technological challenges in these segments.
Renewable Energy Market in Zimbabwe Product Landscape
The renewable energy product landscape in Zimbabwe comprises a range of technologies, including solar photovoltaic (PV) systems, hydropower plants, biogas digesters, and small-scale wind turbines. Recent innovations focus on enhancing efficiency, reducing costs, and improving grid integration. The key selling propositions include environmental sustainability, cost-effectiveness (particularly in the long run), and energy independence. Technological advancements are primarily observed in the solar PV and battery storage sectors, with higher efficiency panels and longer-lasting batteries.
Key Drivers, Barriers & Challenges in Renewable Energy Market in Zimbabwe
Key Drivers:
- Government support: Policies promoting renewable energy investment, such as feed-in tariffs and tax incentives.
- Falling technology costs: Making renewable energy solutions increasingly cost-competitive with fossil fuels.
- Energy security concerns: Addressing the country's energy deficit through diversified energy sources.
Challenges:
- Funding limitations: Access to capital for large-scale renewable energy projects remains a significant hurdle.
- Grid infrastructure limitations: The existing electricity grid needs significant upgrades to accommodate increased renewable energy generation.
- Regulatory uncertainties: Inconsistent implementation of policies and regulatory frameworks can create uncertainty for investors.
Emerging Opportunities in Renewable Energy Market in Zimbabwe
Emerging opportunities include the expansion of mini-grids in rural areas, development of hybrid renewable energy systems, and increasing adoption of rooftop solar PV systems. The growth of the off-grid market presents significant opportunities, particularly for decentralized renewable energy solutions. Furthermore, exploring the potential of wind and geothermal energy resources presents longer-term growth opportunities.
Growth Accelerators in the Renewable Energy Market in Zimbabwe Industry
Technological breakthroughs in battery storage, improved solar panel efficiency, and advancements in hydropower technology are accelerating market growth. Strategic partnerships between international investors and local companies are crucial for attracting foreign capital and expertise. The ongoing expansion of the national grid and investment in transmission lines is critical for increasing the absorption of renewable energy.
Key Players Shaping the Renewable Energy Market in Zimbabwe Market
- Iskraemeco Group
- Zimbabwe Power Company
- Nyangani Renewable Energy (Pvt) Ltd
- Cool Solar Africa
- Global Solar (Pvt) Ltd
Notable Milestones in Renewable Energy Market in Zimbabwe Sector
- December 2022: Zimbabwe announced a government implementation agreement (GIA) to expedite the commissioning of 27 solar IPP installations totaling 1 GW, costing approximately USD 1 billion.
- January 2022: The UN SDG Fund approved a USD 45 million program to catalyze renewable energy investments in Zimbabwe, with USD 10 million from the UN and USD 35 million from the Zimbabwean government and local partners (IDBZ, OMIG, Zimnat Asset Management, and CABS).
In-Depth Renewable Energy Market in Zimbabwe Market Outlook
The Zimbabwean renewable energy market is poised for significant growth over the next decade. Continued government support, declining technology costs, and increasing energy demand will drive expansion. Strategic investments in grid infrastructure and partnerships with international investors will be critical for realizing the market's full potential. The focus on decentralized energy solutions and exploring untapped resources will unlock new opportunities and enhance energy access across the country.
Renewable Energy Market in Zimbabwe Segmentation
-
1. Generation Source
- 1.1. Hydropower
- 1.2. Solar
- 1.3. Bioenergy
- 1.4. Other Generation Sources
Renewable Energy Market in Zimbabwe Segmentation By Geography
-
1. North America
- 1.1. United States
- 1.2. Canada
- 1.3. Mexico
-
2. South America
- 2.1. Brazil
- 2.2. Argentina
- 2.3. Rest of South America
-
3. Europe
- 3.1. United Kingdom
- 3.2. Germany
- 3.3. France
- 3.4. Italy
- 3.5. Spain
- 3.6. Russia
- 3.7. Benelux
- 3.8. Nordics
- 3.9. Rest of Europe
-
4. Middle East & Africa
- 4.1. Turkey
- 4.2. Israel
- 4.3. GCC
- 4.4. North Africa
- 4.5. South Africa
- 4.6. Rest of Middle East & Africa
-
5. Asia Pacific
- 5.1. China
- 5.2. India
- 5.3. Japan
- 5.4. South Korea
- 5.5. ASEAN
- 5.6. Oceania
- 5.7. Rest of Asia Pacific
Renewable Energy Market in Zimbabwe REPORT HIGHLIGHTS
| Aspects | Details |
|---|---|
| Study Period | 2019-2033 |
| Base Year | 2024 |
| Estimated Year | 2025 |
| Forecast Period | 2025-2033 |
| Historical Period | 2019-2024 |
| Growth Rate | CAGR of > 3.00% from 2019-2033 |
| Segmentation |
|
Table of Contents
- 1. Introduction
- 1.1. Research Scope
- 1.2. Market Segmentation
- 1.3. Research Methodology
- 1.4. Definitions and Assumptions
- 2. Executive Summary
- 2.1. Introduction
- 3. Market Dynamics
- 3.1. Introduction
- 3.2. Market Drivers
- 3.2.1 4.; Increasing Demand for Coal Based Power Generation Sector4.; Ease of Availability of Coal for Various Sectors
- 3.2.2 Such as Transport
- 3.2.3 Residential
- 3.2.4 Commercial and Others
- 3.3. Market Restrains
- 3.3.1. 4.; Increasing Adoption of Renewable Energy
- 3.4. Market Trends
- 3.4.1. Hydropower Source to Witness Significant Growth
- 4. Market Factor Analysis
- 4.1. Porters Five Forces
- 4.2. Supply/Value Chain
- 4.3. PESTEL analysis
- 4.4. Market Entropy
- 4.5. Patent/Trademark Analysis
- 5. Global Renewable Energy Market in Zimbabwe Analysis, Insights and Forecast, 2019-2031
- 5.1. Market Analysis, Insights and Forecast - by Generation Source
- 5.1.1. Hydropower
- 5.1.2. Solar
- 5.1.3. Bioenergy
- 5.1.4. Other Generation Sources
- 5.2. Market Analysis, Insights and Forecast - by Region
- 5.2.1. North America
- 5.2.2. South America
- 5.2.3. Europe
- 5.2.4. Middle East & Africa
- 5.2.5. Asia Pacific
- 5.1. Market Analysis, Insights and Forecast - by Generation Source
- 6. North America Renewable Energy Market in Zimbabwe Analysis, Insights and Forecast, 2019-2031
- 6.1. Market Analysis, Insights and Forecast - by Generation Source
- 6.1.1. Hydropower
- 6.1.2. Solar
- 6.1.3. Bioenergy
- 6.1.4. Other Generation Sources
- 6.1. Market Analysis, Insights and Forecast - by Generation Source
- 7. South America Renewable Energy Market in Zimbabwe Analysis, Insights and Forecast, 2019-2031
- 7.1. Market Analysis, Insights and Forecast - by Generation Source
- 7.1.1. Hydropower
- 7.1.2. Solar
- 7.1.3. Bioenergy
- 7.1.4. Other Generation Sources
- 7.1. Market Analysis, Insights and Forecast - by Generation Source
- 8. Europe Renewable Energy Market in Zimbabwe Analysis, Insights and Forecast, 2019-2031
- 8.1. Market Analysis, Insights and Forecast - by Generation Source
- 8.1.1. Hydropower
- 8.1.2. Solar
- 8.1.3. Bioenergy
- 8.1.4. Other Generation Sources
- 8.1. Market Analysis, Insights and Forecast - by Generation Source
- 9. Middle East & Africa Renewable Energy Market in Zimbabwe Analysis, Insights and Forecast, 2019-2031
- 9.1. Market Analysis, Insights and Forecast - by Generation Source
- 9.1.1. Hydropower
- 9.1.2. Solar
- 9.1.3. Bioenergy
- 9.1.4. Other Generation Sources
- 9.1. Market Analysis, Insights and Forecast - by Generation Source
- 10. Asia Pacific Renewable Energy Market in Zimbabwe Analysis, Insights and Forecast, 2019-2031
- 10.1. Market Analysis, Insights and Forecast - by Generation Source
- 10.1.1. Hydropower
- 10.1.2. Solar
- 10.1.3. Bioenergy
- 10.1.4. Other Generation Sources
- 10.1. Market Analysis, Insights and Forecast - by Generation Source
- 11. Competitive Analysis
- 11.1. Global Market Share Analysis 2024
- 11.2. Company Profiles
- 11.2.1 Iskraemeco Group
- 11.2.1.1. Overview
- 11.2.1.2. Products
- 11.2.1.3. SWOT Analysis
- 11.2.1.4. Recent Developments
- 11.2.1.5. Financials (Based on Availability)
- 11.2.2 Zimbabwe Power Company
- 11.2.2.1. Overview
- 11.2.2.2. Products
- 11.2.2.3. SWOT Analysis
- 11.2.2.4. Recent Developments
- 11.2.2.5. Financials (Based on Availability)
- 11.2.3 Nyangani Renewable Energy (Pvt) Ltd
- 11.2.3.1. Overview
- 11.2.3.2. Products
- 11.2.3.3. SWOT Analysis
- 11.2.3.4. Recent Developments
- 11.2.3.5. Financials (Based on Availability)
- 11.2.4 Cool Solar Africa
- 11.2.4.1. Overview
- 11.2.4.2. Products
- 11.2.4.3. SWOT Analysis
- 11.2.4.4. Recent Developments
- 11.2.4.5. Financials (Based on Availability)
- 11.2.5 Global Solar (Pvt) Ltd
- 11.2.5.1. Overview
- 11.2.5.2. Products
- 11.2.5.3. SWOT Analysis
- 11.2.5.4. Recent Developments
- 11.2.5.5. Financials (Based on Availability)
- 11.2.1 Iskraemeco Group
List of Figures
- Figure 1: Global Renewable Energy Market in Zimbabwe Revenue Breakdown (Million, %) by Region 2024 & 2032
- Figure 2: Global Renewable Energy Market in Zimbabwe Volume Breakdown (Gigawatt, %) by Region 2024 & 2032
- Figure 3: Zimbabwe Renewable Energy Market in Zimbabwe Revenue (Million), by Country 2024 & 2032
- Figure 4: Zimbabwe Renewable Energy Market in Zimbabwe Volume (Gigawatt), by Country 2024 & 2032
- Figure 5: Zimbabwe Renewable Energy Market in Zimbabwe Revenue Share (%), by Country 2024 & 2032
- Figure 6: Zimbabwe Renewable Energy Market in Zimbabwe Volume Share (%), by Country 2024 & 2032
- Figure 7: North America Renewable Energy Market in Zimbabwe Revenue (Million), by Generation Source 2024 & 2032
- Figure 8: North America Renewable Energy Market in Zimbabwe Volume (Gigawatt), by Generation Source 2024 & 2032
- Figure 9: North America Renewable Energy Market in Zimbabwe Revenue Share (%), by Generation Source 2024 & 2032
- Figure 10: North America Renewable Energy Market in Zimbabwe Volume Share (%), by Generation Source 2024 & 2032
- Figure 11: North America Renewable Energy Market in Zimbabwe Revenue (Million), by Country 2024 & 2032
- Figure 12: North America Renewable Energy Market in Zimbabwe Volume (Gigawatt), by Country 2024 & 2032
- Figure 13: North America Renewable Energy Market in Zimbabwe Revenue Share (%), by Country 2024 & 2032
- Figure 14: North America Renewable Energy Market in Zimbabwe Volume Share (%), by Country 2024 & 2032
- Figure 15: South America Renewable Energy Market in Zimbabwe Revenue (Million), by Generation Source 2024 & 2032
- Figure 16: South America Renewable Energy Market in Zimbabwe Volume (Gigawatt), by Generation Source 2024 & 2032
- Figure 17: South America Renewable Energy Market in Zimbabwe Revenue Share (%), by Generation Source 2024 & 2032
- Figure 18: South America Renewable Energy Market in Zimbabwe Volume Share (%), by Generation Source 2024 & 2032
- Figure 19: South America Renewable Energy Market in Zimbabwe Revenue (Million), by Country 2024 & 2032
- Figure 20: South America Renewable Energy Market in Zimbabwe Volume (Gigawatt), by Country 2024 & 2032
- Figure 21: South America Renewable Energy Market in Zimbabwe Revenue Share (%), by Country 2024 & 2032
- Figure 22: South America Renewable Energy Market in Zimbabwe Volume Share (%), by Country 2024 & 2032
- Figure 23: Europe Renewable Energy Market in Zimbabwe Revenue (Million), by Generation Source 2024 & 2032
- Figure 24: Europe Renewable Energy Market in Zimbabwe Volume (Gigawatt), by Generation Source 2024 & 2032
- Figure 25: Europe Renewable Energy Market in Zimbabwe Revenue Share (%), by Generation Source 2024 & 2032
- Figure 26: Europe Renewable Energy Market in Zimbabwe Volume Share (%), by Generation Source 2024 & 2032
- Figure 27: Europe Renewable Energy Market in Zimbabwe Revenue (Million), by Country 2024 & 2032
- Figure 28: Europe Renewable Energy Market in Zimbabwe Volume (Gigawatt), by Country 2024 & 2032
- Figure 29: Europe Renewable Energy Market in Zimbabwe Revenue Share (%), by Country 2024 & 2032
- Figure 30: Europe Renewable Energy Market in Zimbabwe Volume Share (%), by Country 2024 & 2032
- Figure 31: Middle East & Africa Renewable Energy Market in Zimbabwe Revenue (Million), by Generation Source 2024 & 2032
- Figure 32: Middle East & Africa Renewable Energy Market in Zimbabwe Volume (Gigawatt), by Generation Source 2024 & 2032
- Figure 33: Middle East & Africa Renewable Energy Market in Zimbabwe Revenue Share (%), by Generation Source 2024 & 2032
- Figure 34: Middle East & Africa Renewable Energy Market in Zimbabwe Volume Share (%), by Generation Source 2024 & 2032
- Figure 35: Middle East & Africa Renewable Energy Market in Zimbabwe Revenue (Million), by Country 2024 & 2032
- Figure 36: Middle East & Africa Renewable Energy Market in Zimbabwe Volume (Gigawatt), by Country 2024 & 2032
- Figure 37: Middle East & Africa Renewable Energy Market in Zimbabwe Revenue Share (%), by Country 2024 & 2032
- Figure 38: Middle East & Africa Renewable Energy Market in Zimbabwe Volume Share (%), by Country 2024 & 2032
- Figure 39: Asia Pacific Renewable Energy Market in Zimbabwe Revenue (Million), by Generation Source 2024 & 2032
- Figure 40: Asia Pacific Renewable Energy Market in Zimbabwe Volume (Gigawatt), by Generation Source 2024 & 2032
- Figure 41: Asia Pacific Renewable Energy Market in Zimbabwe Revenue Share (%), by Generation Source 2024 & 2032
- Figure 42: Asia Pacific Renewable Energy Market in Zimbabwe Volume Share (%), by Generation Source 2024 & 2032
- Figure 43: Asia Pacific Renewable Energy Market in Zimbabwe Revenue (Million), by Country 2024 & 2032
- Figure 44: Asia Pacific Renewable Energy Market in Zimbabwe Volume (Gigawatt), by Country 2024 & 2032
- Figure 45: Asia Pacific Renewable Energy Market in Zimbabwe Revenue Share (%), by Country 2024 & 2032
- Figure 46: Asia Pacific Renewable Energy Market in Zimbabwe Volume Share (%), by Country 2024 & 2032
List of Tables
- Table 1: Global Renewable Energy Market in Zimbabwe Revenue Million Forecast, by Region 2019 & 2032
- Table 2: Global Renewable Energy Market in Zimbabwe Volume Gigawatt Forecast, by Region 2019 & 2032
- Table 3: Global Renewable Energy Market in Zimbabwe Revenue Million Forecast, by Generation Source 2019 & 2032
- Table 4: Global Renewable Energy Market in Zimbabwe Volume Gigawatt Forecast, by Generation Source 2019 & 2032
- Table 5: Global Renewable Energy Market in Zimbabwe Revenue Million Forecast, by Region 2019 & 2032
- Table 6: Global Renewable Energy Market in Zimbabwe Volume Gigawatt Forecast, by Region 2019 & 2032
- Table 7: Global Renewable Energy Market in Zimbabwe Revenue Million Forecast, by Country 2019 & 2032
- Table 8: Global Renewable Energy Market in Zimbabwe Volume Gigawatt Forecast, by Country 2019 & 2032
- Table 9: Global Renewable Energy Market in Zimbabwe Revenue Million Forecast, by Generation Source 2019 & 2032
- Table 10: Global Renewable Energy Market in Zimbabwe Volume Gigawatt Forecast, by Generation Source 2019 & 2032
- Table 11: Global Renewable Energy Market in Zimbabwe Revenue Million Forecast, by Country 2019 & 2032
- Table 12: Global Renewable Energy Market in Zimbabwe Volume Gigawatt Forecast, by Country 2019 & 2032
- Table 13: United States Renewable Energy Market in Zimbabwe Revenue (Million) Forecast, by Application 2019 & 2032
- Table 14: United States Renewable Energy Market in Zimbabwe Volume (Gigawatt) Forecast, by Application 2019 & 2032
- Table 15: Canada Renewable Energy Market in Zimbabwe Revenue (Million) Forecast, by Application 2019 & 2032
- Table 16: Canada Renewable Energy Market in Zimbabwe Volume (Gigawatt) Forecast, by Application 2019 & 2032
- Table 17: Mexico Renewable Energy Market in Zimbabwe Revenue (Million) Forecast, by Application 2019 & 2032
- Table 18: Mexico Renewable Energy Market in Zimbabwe Volume (Gigawatt) Forecast, by Application 2019 & 2032
- Table 19: Global Renewable Energy Market in Zimbabwe Revenue Million Forecast, by Generation Source 2019 & 2032
- Table 20: Global Renewable Energy Market in Zimbabwe Volume Gigawatt Forecast, by Generation Source 2019 & 2032
- Table 21: Global Renewable Energy Market in Zimbabwe Revenue Million Forecast, by Country 2019 & 2032
- Table 22: Global Renewable Energy Market in Zimbabwe Volume Gigawatt Forecast, by Country 2019 & 2032
- Table 23: Brazil Renewable Energy Market in Zimbabwe Revenue (Million) Forecast, by Application 2019 & 2032
- Table 24: Brazil Renewable Energy Market in Zimbabwe Volume (Gigawatt) Forecast, by Application 2019 & 2032
- Table 25: Argentina Renewable Energy Market in Zimbabwe Revenue (Million) Forecast, by Application 2019 & 2032
- Table 26: Argentina Renewable Energy Market in Zimbabwe Volume (Gigawatt) Forecast, by Application 2019 & 2032
- Table 27: Rest of South America Renewable Energy Market in Zimbabwe Revenue (Million) Forecast, by Application 2019 & 2032
- Table 28: Rest of South America Renewable Energy Market in Zimbabwe Volume (Gigawatt) Forecast, by Application 2019 & 2032
- Table 29: Global Renewable Energy Market in Zimbabwe Revenue Million Forecast, by Generation Source 2019 & 2032
- Table 30: Global Renewable Energy Market in Zimbabwe Volume Gigawatt Forecast, by Generation Source 2019 & 2032
- Table 31: Global Renewable Energy Market in Zimbabwe Revenue Million Forecast, by Country 2019 & 2032
- Table 32: Global Renewable Energy Market in Zimbabwe Volume Gigawatt Forecast, by Country 2019 & 2032
- Table 33: United Kingdom Renewable Energy Market in Zimbabwe Revenue (Million) Forecast, by Application 2019 & 2032
- Table 34: United Kingdom Renewable Energy Market in Zimbabwe Volume (Gigawatt) Forecast, by Application 2019 & 2032
- Table 35: Germany Renewable Energy Market in Zimbabwe Revenue (Million) Forecast, by Application 2019 & 2032
- Table 36: Germany Renewable Energy Market in Zimbabwe Volume (Gigawatt) Forecast, by Application 2019 & 2032
- Table 37: France Renewable Energy Market in Zimbabwe Revenue (Million) Forecast, by Application 2019 & 2032
- Table 38: France Renewable Energy Market in Zimbabwe Volume (Gigawatt) Forecast, by Application 2019 & 2032
- Table 39: Italy Renewable Energy Market in Zimbabwe Revenue (Million) Forecast, by Application 2019 & 2032
- Table 40: Italy Renewable Energy Market in Zimbabwe Volume (Gigawatt) Forecast, by Application 2019 & 2032
- Table 41: Spain Renewable Energy Market in Zimbabwe Revenue (Million) Forecast, by Application 2019 & 2032
- Table 42: Spain Renewable Energy Market in Zimbabwe Volume (Gigawatt) Forecast, by Application 2019 & 2032
- Table 43: Russia Renewable Energy Market in Zimbabwe Revenue (Million) Forecast, by Application 2019 & 2032
- Table 44: Russia Renewable Energy Market in Zimbabwe Volume (Gigawatt) Forecast, by Application 2019 & 2032
- Table 45: Benelux Renewable Energy Market in Zimbabwe Revenue (Million) Forecast, by Application 2019 & 2032
- Table 46: Benelux Renewable Energy Market in Zimbabwe Volume (Gigawatt) Forecast, by Application 2019 & 2032
- Table 47: Nordics Renewable Energy Market in Zimbabwe Revenue (Million) Forecast, by Application 2019 & 2032
- Table 48: Nordics Renewable Energy Market in Zimbabwe Volume (Gigawatt) Forecast, by Application 2019 & 2032
- Table 49: Rest of Europe Renewable Energy Market in Zimbabwe Revenue (Million) Forecast, by Application 2019 & 2032
- Table 50: Rest of Europe Renewable Energy Market in Zimbabwe Volume (Gigawatt) Forecast, by Application 2019 & 2032
- Table 51: Global Renewable Energy Market in Zimbabwe Revenue Million Forecast, by Generation Source 2019 & 2032
- Table 52: Global Renewable Energy Market in Zimbabwe Volume Gigawatt Forecast, by Generation Source 2019 & 2032
- Table 53: Global Renewable Energy Market in Zimbabwe Revenue Million Forecast, by Country 2019 & 2032
- Table 54: Global Renewable Energy Market in Zimbabwe Volume Gigawatt Forecast, by Country 2019 & 2032
- Table 55: Turkey Renewable Energy Market in Zimbabwe Revenue (Million) Forecast, by Application 2019 & 2032
- Table 56: Turkey Renewable Energy Market in Zimbabwe Volume (Gigawatt) Forecast, by Application 2019 & 2032
- Table 57: Israel Renewable Energy Market in Zimbabwe Revenue (Million) Forecast, by Application 2019 & 2032
- Table 58: Israel Renewable Energy Market in Zimbabwe Volume (Gigawatt) Forecast, by Application 2019 & 2032
- Table 59: GCC Renewable Energy Market in Zimbabwe Revenue (Million) Forecast, by Application 2019 & 2032
- Table 60: GCC Renewable Energy Market in Zimbabwe Volume (Gigawatt) Forecast, by Application 2019 & 2032
- Table 61: North Africa Renewable Energy Market in Zimbabwe Revenue (Million) Forecast, by Application 2019 & 2032
- Table 62: North Africa Renewable Energy Market in Zimbabwe Volume (Gigawatt) Forecast, by Application 2019 & 2032
- Table 63: South Africa Renewable Energy Market in Zimbabwe Revenue (Million) Forecast, by Application 2019 & 2032
- Table 64: South Africa Renewable Energy Market in Zimbabwe Volume (Gigawatt) Forecast, by Application 2019 & 2032
- Table 65: Rest of Middle East & Africa Renewable Energy Market in Zimbabwe Revenue (Million) Forecast, by Application 2019 & 2032
- Table 66: Rest of Middle East & Africa Renewable Energy Market in Zimbabwe Volume (Gigawatt) Forecast, by Application 2019 & 2032
- Table 67: Global Renewable Energy Market in Zimbabwe Revenue Million Forecast, by Generation Source 2019 & 2032
- Table 68: Global Renewable Energy Market in Zimbabwe Volume Gigawatt Forecast, by Generation Source 2019 & 2032
- Table 69: Global Renewable Energy Market in Zimbabwe Revenue Million Forecast, by Country 2019 & 2032
- Table 70: Global Renewable Energy Market in Zimbabwe Volume Gigawatt Forecast, by Country 2019 & 2032
- Table 71: China Renewable Energy Market in Zimbabwe Revenue (Million) Forecast, by Application 2019 & 2032
- Table 72: China Renewable Energy Market in Zimbabwe Volume (Gigawatt) Forecast, by Application 2019 & 2032
- Table 73: India Renewable Energy Market in Zimbabwe Revenue (Million) Forecast, by Application 2019 & 2032
- Table 74: India Renewable Energy Market in Zimbabwe Volume (Gigawatt) Forecast, by Application 2019 & 2032
- Table 75: Japan Renewable Energy Market in Zimbabwe Revenue (Million) Forecast, by Application 2019 & 2032
- Table 76: Japan Renewable Energy Market in Zimbabwe Volume (Gigawatt) Forecast, by Application 2019 & 2032
- Table 77: South Korea Renewable Energy Market in Zimbabwe Revenue (Million) Forecast, by Application 2019 & 2032
- Table 78: South Korea Renewable Energy Market in Zimbabwe Volume (Gigawatt) Forecast, by Application 2019 & 2032
- Table 79: ASEAN Renewable Energy Market in Zimbabwe Revenue (Million) Forecast, by Application 2019 & 2032
- Table 80: ASEAN Renewable Energy Market in Zimbabwe Volume (Gigawatt) Forecast, by Application 2019 & 2032
- Table 81: Oceania Renewable Energy Market in Zimbabwe Revenue (Million) Forecast, by Application 2019 & 2032
- Table 82: Oceania Renewable Energy Market in Zimbabwe Volume (Gigawatt) Forecast, by Application 2019 & 2032
- Table 83: Rest of Asia Pacific Renewable Energy Market in Zimbabwe Revenue (Million) Forecast, by Application 2019 & 2032
- Table 84: Rest of Asia Pacific Renewable Energy Market in Zimbabwe Volume (Gigawatt) Forecast, by Application 2019 & 2032
Frequently Asked Questions
1. What is the projected Compound Annual Growth Rate (CAGR) of the Renewable Energy Market in Zimbabwe?
The projected CAGR is approximately > 3.00%.
2. Which companies are prominent players in the Renewable Energy Market in Zimbabwe?
Key companies in the market include Iskraemeco Group, Zimbabwe Power Company, Nyangani Renewable Energy (Pvt) Ltd, Cool Solar Africa, Global Solar (Pvt) Ltd.
3. What are the main segments of the Renewable Energy Market in Zimbabwe?
The market segments include Generation Source.
4. Can you provide details about the market size?
The market size is estimated to be USD XX Million as of 2022.
5. What are some drivers contributing to market growth?
4.; Increasing Demand for Coal Based Power Generation Sector4.; Ease of Availability of Coal for Various Sectors. Such as Transport. Residential. Commercial and Others.
6. What are the notable trends driving market growth?
Hydropower Source to Witness Significant Growth.
7. Are there any restraints impacting market growth?
4.; Increasing Adoption of Renewable Energy.
8. Can you provide examples of recent developments in the market?
In December 2022, Zimbabwe announced a government implementation agreement (GIA) to expedite the commissioning of 27 solar IPP installations. The 1 GW of projects range from 5 MW arrays to 100 MW solar parks and will cost about USD 1 billion in total.
9. What pricing options are available for accessing the report?
Pricing options include single-user, multi-user, and enterprise licenses priced at USD 3800, USD 4500, and USD 5800 respectively.
10. Is the market size provided in terms of value or volume?
The market size is provided in terms of value, measured in Million and volume, measured in Gigawatt.
11. Are there any specific market keywords associated with the report?
Yes, the market keyword associated with the report is "Renewable Energy Market in Zimbabwe," which aids in identifying and referencing the specific market segment covered.
12. How do I determine which pricing option suits my needs best?
The pricing options vary based on user requirements and access needs. Individual users may opt for single-user licenses, while businesses requiring broader access may choose multi-user or enterprise licenses for cost-effective access to the report.
13. Are there any additional resources or data provided in the Renewable Energy Market in Zimbabwe report?
While the report offers comprehensive insights, it's advisable to review the specific contents or supplementary materials provided to ascertain if additional resources or data are available.
14. How can I stay updated on further developments or reports in the Renewable Energy Market in Zimbabwe?
To stay informed about further developments, trends, and reports in the Renewable Energy Market in Zimbabwe, consider subscribing to industry newsletters, following relevant companies and organizations, or regularly checking reputable industry news sources and publications.
Methodology
Step 1 - Identification of Relevant Samples Size from Population Database


Step 2 - Approaches for Defining Global Market Size (Value, Volume* & Price*)

Note*: In applicable scenarios
Step 3 - Data Sources
Primary Research
- Web Analytics
- Survey Reports
- Research Institute
- Latest Research Reports
- Opinion Leaders
Secondary Research
- Annual Reports
- White Paper
- Latest Press Release
- Industry Association
- Paid Database
- Investor Presentations

Step 4 - Data Triangulation
Involves using different sources of information in order to increase the validity of a study
These sources are likely to be stakeholders in a program - participants, other researchers, program staff, other community members, and so on.
Then we put all data in single framework & apply various statistical tools to find out the dynamic on the market.
During the analysis stage, feedback from the stakeholder groups would be compared to determine areas of agreement as well as areas of divergence


