

Key Insights
The South African renewable energy market is poised for substantial expansion, fueled by escalating electricity demand, supportive government policies promoting energy security, and a steadfast commitment to decarbonization. Projections indicate a Compound Annual Growth Rate (CAGR) of 8.5%, signaling robust growth between the base year of 2024 and the forecast period. The estimated market size for 2024 stands at 100,270.5 million. Key growth drivers include significant investments in solar and wind energy projects, advantageous regulatory environments, and the strategic imperative to diversify the energy portfolio beyond fossil fuels. Market expansion will be further propelled by technological innovations that reduce costs, coupled with increased private sector engagement. Nevertheless, challenges such as grid infrastructure constraints, the intermittency of renewable power sources, and the essential need for energy storage solutions require continued attention and investment.
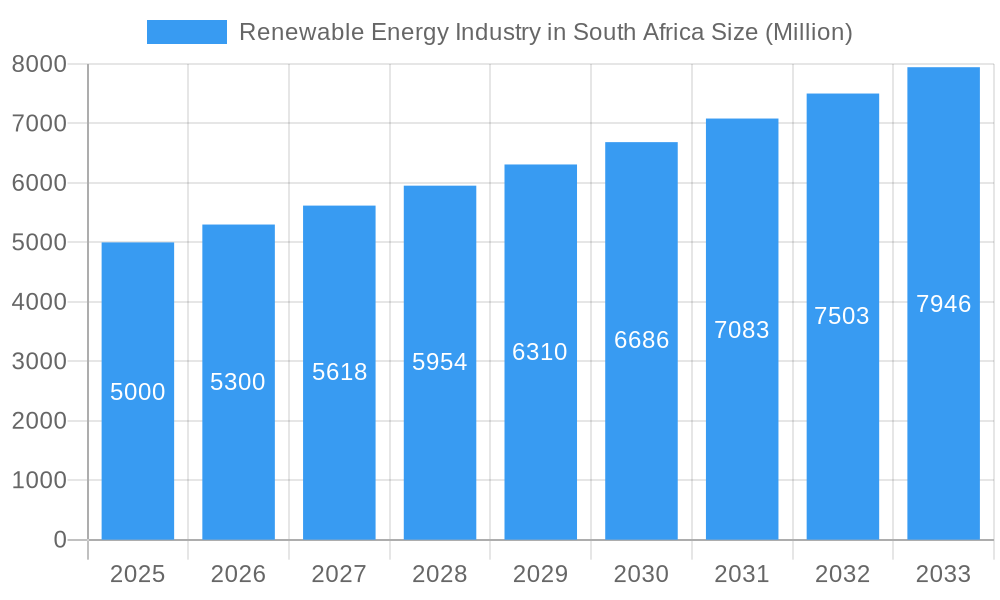
Renewable Energy Industry in South Africa Market Size (In Billion)
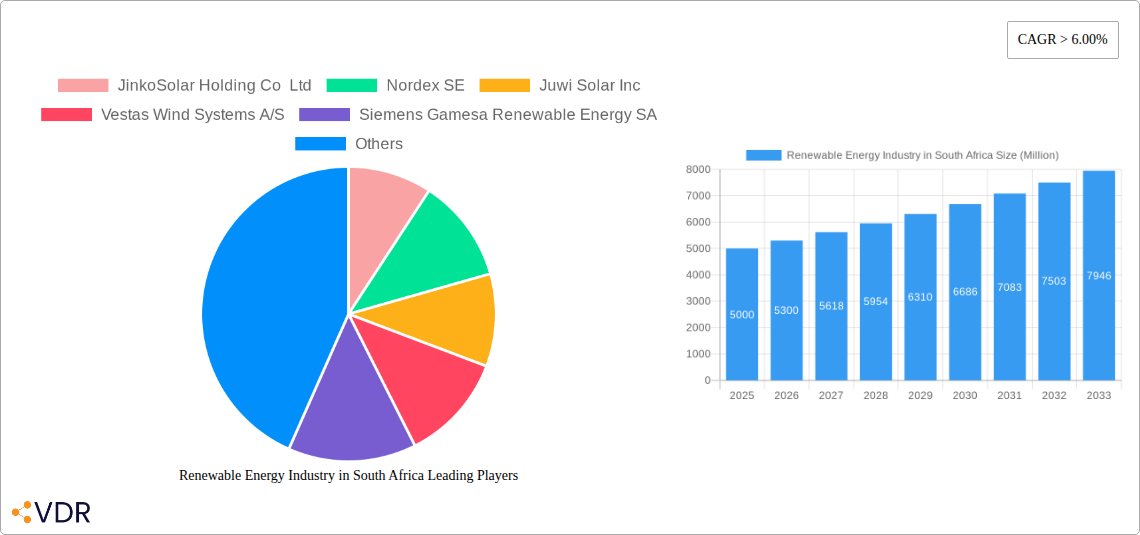
The market segmentation includes solar photovoltaic (PV), concentrated solar power (CSP), wind power, and nascent technologies such as geothermal. Prominent global and local players, including JinkoSolar, Nordex, Vestas, and Siemens Gamesa, are actively participating, highlighting considerable international interest. Regional disparities in renewable resource availability and policy frameworks will influence market dynamics within South Africa. Regions with superior solar irradiance are anticipated to lead in solar PV installations, while areas with high wind speeds will attract greater investment in wind power projects. Overcoming existing challenges and leveraging emerging opportunities will be paramount to sustaining the South African renewable energy market's impressive growth trajectory.
Renewable Energy Industry in South Africa Company Market Share
Renewable Energy Industry in South Africa: A Comprehensive Market Report (2019-2033)
This comprehensive report provides an in-depth analysis of the South African renewable energy market, covering market dynamics, growth trends, key players, and future outlook. The report utilizes data from the historical period (2019-2024), the base year (2025), and forecasts the market's trajectory until 2033. It's an essential resource for industry professionals, investors, and policymakers seeking to understand this rapidly evolving sector. The parent market is the broader energy sector in South Africa, while the child market is specifically renewable energy sources like solar and wind.
Renewable Energy Industry in South Africa Market Dynamics & Structure
This section analyzes the South African renewable energy market's structure, identifying key trends and influencing factors. The market is characterized by increasing competition, driven by technological advancements and supportive government policies. Market concentration is moderate, with several large players and a growing number of smaller, specialized companies.
- Market Concentration: xx% market share held by the top 5 players (2024). Increasing competition from smaller, specialized firms is observed.
- Technological Innovation: Significant investments in solar PV and wind technology are driving innovation. Barriers to innovation include high upfront capital costs and grid integration challenges.
- Regulatory Framework: The government's commitment to renewable energy targets is a major driver. However, regulatory uncertainty remains a challenge for some projects.
- Competitive Product Substitutes: Fossil fuels remain the dominant energy source, presenting competition. However, increasing electricity prices and environmental concerns favour renewable energy.
- End-User Demographics: The main end-users are utilities, commercial businesses, and increasingly, residential consumers.
- M&A Trends: The number of M&A deals in the sector has increased in recent years, with xx deals recorded between 2019 and 2024, totaling an estimated value of xx Million.
Renewable Energy Industry in South Africa Growth Trends & Insights
The South African renewable energy market is experiencing significant growth, driven by increasing energy demand, government support, and decreasing technology costs. The market size has shown a Compound Annual Growth Rate (CAGR) of xx% from 2019 to 2024, reaching xx Million in 2024. Market penetration of renewable energy in the overall energy mix is projected to reach xx% by 2033. This growth is primarily fueled by the increasing adoption of solar PV and wind energy, alongside government initiatives promoting renewable energy integration. Technological advancements, such as improved energy storage solutions and more efficient PV panels, further propel market expansion. Consumer behavior shifts, influenced by environmental consciousness and economic factors, also play a critical role.
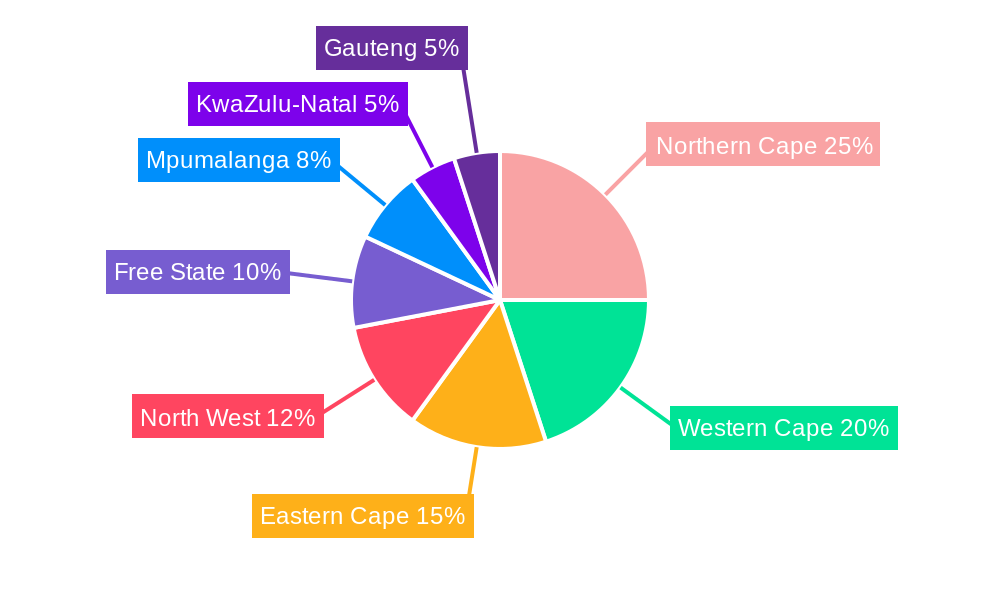
Dominant Regions, Countries, or Segments in Renewable Energy Industry in South Africa
The Northern Cape province leads in renewable energy capacity, particularly solar, due to high solar irradiance levels and favorable government incentives. This dominance is driven by:
- Economic Policies: Government incentives, feed-in tariffs, and renewable energy procurement programs favour specific regions.
- Infrastructure: Existing transmission infrastructure and proximity to potential energy consumers contribute to regional growth.
- Resource Availability: The Northern Cape's abundant solar resources are a primary driver of its dominance.
Other regions, like the Western Cape and Eastern Cape, are also witnessing significant growth, albeit at a slower rate compared to the Northern Cape. Market share varies across regions, with the Northern Cape holding the largest portion (xx%), followed by the Western Cape (xx%) and Eastern Cape (xx%).
Renewable Energy Industry in South Africa Product Landscape
The South African renewable energy market features a diverse product landscape, primarily driven by solar PV, wind, and hydro technologies. Recent product innovations include more efficient solar panels, advanced wind turbine designs, and improved energy storage systems. These advancements directly translate to enhanced performance metrics, including increased energy output, reduced costs, and extended lifespans. Unique selling propositions for specific products emphasize higher energy efficiency, lower maintenance requirements, and extended warranties.
Key Drivers, Barriers & Challenges in Renewable Energy Industry in South Africa
Key Drivers:
- Government Support and Policy Frameworks: Robust government policies, including competitive procurement programs like the Renewable Energy Independent Power Producer Procurement Programme (REIPPPP), continue to be a significant catalyst. These frameworks provide crucial certainty for investors and developers, driving both utility-scale and distributed generation projects. Initiatives aimed at fast-tracking approvals and addressing grid connection backlogs are also vital.
- Declining Technology Costs and Enhanced Efficiency: The global trend of falling costs for solar photovoltaic (PV) and wind technologies, coupled with advancements in manufacturing and installation techniques, makes renewables increasingly cost-competitive with traditional fossil fuels. Innovations in panel efficiency and turbine design further bolster this advantage.
- Climate Change Imperatives and Energy Security: South Africa's vulnerability to climate change impacts, alongside a pressing need to diversify its energy mix and enhance energy security, is a powerful driver. The desire to reduce reliance on volatile imported fossil fuels and mitigate the environmental consequences of coal power is accelerating the transition.
- Growing Demand for Sustainable and Reliable Power: An increasing awareness among businesses and households about the benefits of clean energy, coupled with the persistent challenges of load shedding, is fueling demand for renewable energy solutions. This includes both large-scale grid-connected projects and smaller, behind-the-meter installations.
Key Barriers & Challenges:
- Grid Integration and Infrastructure Constraints: The intermittent nature of solar and wind power presents significant challenges for grid integration. Insufficient transmission and distribution infrastructure, along with a lack of sophisticated grid management technologies, can limit the amount of renewable energy that can be reliably absorbed. Modernizing the grid and investing in flexible generation is paramount.
- Financing and Investment Mobilization: While investor interest is growing, securing adequate and affordable financing for large-scale renewable energy projects can still be a hurdle. This includes addressing perceived risks associated with policy uncertainty, currency fluctuations, and project development timelines. Innovative financing models and de-risking instruments are crucial.
- Supply Chain Volatility and Local Content Development: Global supply chain disruptions, as experienced in recent years, can significantly impact project timelines, cost overruns, and the availability of critical components. Furthermore, balancing the need for efficient global supply chains with the imperative to develop local manufacturing and job creation remains a complex challenge. For instance, supply chain bottlenecks and inflationary pressures in 2022 are estimated to have contributed to delays in project completions by several months, impacting capacity additions.
- Regulatory and Policy Uncertainty: While supportive policies exist, shifts in regulatory frameworks, tariff structures, and licensing processes can create uncertainty for investors and developers, potentially slowing down the pace of project deployment. Streamlining regulatory processes and ensuring policy consistency are vital.
- Skills Development and Workforce Preparedness: The rapid growth of the renewable energy sector necessitates a skilled workforce. Ensuring adequate training and development programs are in place to meet the demand for technicians, engineers, and project managers is an ongoing challenge.
Emerging Opportunities in Renewable Energy Industry in South Africa
South Africa's renewable energy landscape is ripe with evolving opportunities, driven by innovation and the nation's unique energy needs:
- Decentralized Energy Solutions (Off-grid & Mini-grids): The substantial need to electrify underserved rural communities and reduce reliance on an aging grid presents a significant opportunity for off-grid solar systems, solar home systems, and community-based mini-grids powered by renewable sources. These solutions enhance energy access, economic development, and resilience.
- Energy Storage Technologies for Grid Stability: The growing penetration of variable renewable energy necessitates robust energy storage solutions. This includes utility-scale battery storage, behind-the-meter storage for commercial and industrial (C&I) clients, and exploring emerging technologies like pumped hydro and flow batteries to enhance grid stability, manage peak demand, and facilitate higher renewable energy integration.
- Green Hydrogen Production and Export Potential: Leveraging South Africa's world-class solar and wind resources, the development of a green hydrogen economy holds immense promise. This includes producing green hydrogen for domestic industrial use (e.g., mining, fertilizers), decarbonizing transport, and potentially becoming a significant exporter of green hydrogen and its derivatives to global markets.
- Corporate Power Purchase Agreements (PPAs) and Embedded Generation: Growing numbers of South African businesses are seeking to secure their own clean energy supply through direct PPAs with renewable energy developers or by investing in embedded generation (rooftop solar). This trend is driven by cost savings, sustainability goals, and the desire to mitigate load shedding.
- Repurposing and Repowering of Old Assets: Opportunities exist to repower aging fossil fuel power plants with renewable energy technologies or to utilize their existing infrastructure (e.g., transmission lines) for new renewable energy projects, thereby maximizing existing investments and minimizing new infrastructure development.
Growth Accelerators in the Renewable Energy Industry in South Africa Industry
Several dynamic factors are propelling long-term growth within South Africa's renewable energy sector. Technological breakthroughs, particularly in advanced energy storage systems and significant improvements in solar PV efficiency and wind turbine performance, are continuously driving down levelized costs of energy (LCOE) and enhancing the reliability of renewable power generation. Strategic partnerships and collaborations between international technology providers, financiers, and local industry players are crucial for fostering innovation, enabling technology transfer, and mobilizing substantial investment. Furthermore, the ongoing expansion of the market into previously underserved areas, coupled with an increasing and vocal consumer demand for cleaner and more reliable energy solutions, are significant and sustained drivers of this accelerated growth trajectory.
Key Players Shaping the Renewable Energy Industry in South Africa Market
- JinkoSolar Holding Co Ltd
- Nordex SE
- Juwi AG
- Vestas Wind Systems A/S
- Siemens Gamesa Renewable Energy SA
- First Solar Inc
- Scatec Solar ASA
- Acciona SA
- Juwi Solar Inc (List Not Exhaustive)
Notable Milestones in Renewable Energy Industry in South Africa Sector
- December 2022: The sixth bid window of the Renewable Energy Independent Power Producer Procurement Programme (REIPPPP) concluded with remarkable success, featuring a record-low bid price of USD 0.02689/kWh for solar PV projects. A total of five solar projects, collectively representing 860 MW of new capacity, were awarded, signifying a strong appetite for renewable energy investment.
- October 2022: While not directly within South Africa, a significant regional development occurred when the African Development Bank (AfDB) provided a USD 2.5 million grant to support the integration of renewable energy in Mozambique. This investment has indirect positive implications for South Africa's regional energy landscape by fostering a more robust and interconnected renewable energy ecosystem across Southern Africa, potentially leading to greater cross-border collaboration and energy trading.
- Q1 2023: South Africa saw continued private sector investment in embedded generation, with numerous commercial and industrial entities announcing new rooftop solar installations and private PPA agreements, demonstrating a robust demand for self-generated clean energy and a growing willingness to bypass traditional utility procurement routes.
- Mid-2023: Progress was made on improving transmission infrastructure, with the Department of Public Enterprises and Eskom announcing plans and securing funding for crucial upgrades aimed at accommodating the increasing influx of renewable energy onto the national grid.
In-Depth Renewable Energy Industry in South Africa Market Outlook
The South African renewable energy market is robustly positioned for sustained and significant growth throughout the projected forecast period (2025-2033). Government policies, particularly the ongoing implementation and refinement of the REIPPPP and other supportive frameworks, are expected to remain a cornerstone of this expansion. Coupled with this, continuous technological advancements are further driving down the costs of solar PV, wind, and energy storage, making them increasingly economically attractive. Growing public and corporate awareness regarding the benefits of clean energy and the urgent need to address energy security and climate change are further bolstering demand. Strategic opportunities for domestic and international investors are particularly pronounced in the burgeoning fields of advanced energy storage solutions, the development of a nascent green hydrogen economy, and the provision of decentralized off-grid and mini-grid solutions to underserved populations. The market's future potential is substantial, underpinned by the country's abundant renewable resources and the imperative to transition towards a cleaner, more secure, and sustainable energy future.
Renewable Energy Industry in South Africa Segmentation
-
1. Source
- 1.1. Solar
- 1.2. Wind
- 1.3. Others
-
2. Geogrpahy
- 2.1. South Africa
- 2.2. Zambia
- 2.3. Mozambique
- 2.4. Angola
- 2.5. Rest of Southern Africa
Renewable Energy Industry in South Africa Segmentation By Geography
-
1. North America
- 1.1. United States
- 1.2. Canada
- 1.3. Mexico
-
2. South America
- 2.1. Brazil
- 2.2. Argentina
- 2.3. Rest of South America
-
3. Europe
- 3.1. United Kingdom
- 3.2. Germany
- 3.3. France
- 3.4. Italy
- 3.5. Spain
- 3.6. Russia
- 3.7. Benelux
- 3.8. Nordics
- 3.9. Rest of Europe
-
4. Middle East & Africa
- 4.1. Turkey
- 4.2. Israel
- 4.3. GCC
- 4.4. North Africa
- 4.5. South Africa
- 4.6. Rest of Middle East & Africa
-
5. Asia Pacific
- 5.1. China
- 5.2. India
- 5.3. Japan
- 5.4. South Korea
- 5.5. ASEAN
- 5.6. Oceania
- 5.7. Rest of Asia Pacific
Renewable Energy Industry in South Africa Regional Market Share
Geographic Coverage of Renewable Energy Industry in South Africa
Renewable Energy Industry in South Africa REPORT HIGHLIGHTS
| Aspects | Details |
|---|---|
| Study Period | 2020-2034 |
| Base Year | 2025 |
| Estimated Year | 2026 |
| Forecast Period | 2026-2034 |
| Historical Period | 2020-2025 |
| Growth Rate | CAGR of 8.5% from 2020-2034 |
| Segmentation |
|
Table of Contents
- 1. Introduction
- 1.1. Research Scope
- 1.2. Market Segmentation
- 1.3. Research Methodology
- 1.4. Definitions and Assumptions
- 2. Executive Summary
- 2.1. Introduction
- 3. Market Dynamics
- 3.1. Introduction
- 3.2. Market Drivers
- 3.3. Market Restrains
- 3.4. Market Trends
- 3.4.1. Solar Energy is Expected to Drive the Market
- 4. Market Factor Analysis
- 4.1. Porters Five Forces
- 4.2. Supply/Value Chain
- 4.3. PESTEL analysis
- 4.4. Market Entropy
- 4.5. Patent/Trademark Analysis
- 5. Global Renewable Energy Industry in South Africa Analysis, Insights and Forecast, 2020-2032
- 5.1. Market Analysis, Insights and Forecast - by Source
- 5.1.1. Solar
- 5.1.2. Wind
- 5.1.3. Others
- 5.2. Market Analysis, Insights and Forecast - by Geogrpahy
- 5.2.1. South Africa
- 5.2.2. Zambia
- 5.2.3. Mozambique
- 5.2.4. Angola
- 5.2.5. Rest of Southern Africa
- 5.3. Market Analysis, Insights and Forecast - by Region
- 5.3.1. North America
- 5.3.2. South America
- 5.3.3. Europe
- 5.3.4. Middle East & Africa
- 5.3.5. Asia Pacific
- 5.1. Market Analysis, Insights and Forecast - by Source
- 6. North America Renewable Energy Industry in South Africa Analysis, Insights and Forecast, 2020-2032
- 6.1. Market Analysis, Insights and Forecast - by Source
- 6.1.1. Solar
- 6.1.2. Wind
- 6.1.3. Others
- 6.2. Market Analysis, Insights and Forecast - by Geogrpahy
- 6.2.1. South Africa
- 6.2.2. Zambia
- 6.2.3. Mozambique
- 6.2.4. Angola
- 6.2.5. Rest of Southern Africa
- 6.1. Market Analysis, Insights and Forecast - by Source
- 7. South America Renewable Energy Industry in South Africa Analysis, Insights and Forecast, 2020-2032
- 7.1. Market Analysis, Insights and Forecast - by Source
- 7.1.1. Solar
- 7.1.2. Wind
- 7.1.3. Others
- 7.2. Market Analysis, Insights and Forecast - by Geogrpahy
- 7.2.1. South Africa
- 7.2.2. Zambia
- 7.2.3. Mozambique
- 7.2.4. Angola
- 7.2.5. Rest of Southern Africa
- 7.1. Market Analysis, Insights and Forecast - by Source
- 8. Europe Renewable Energy Industry in South Africa Analysis, Insights and Forecast, 2020-2032
- 8.1. Market Analysis, Insights and Forecast - by Source
- 8.1.1. Solar
- 8.1.2. Wind
- 8.1.3. Others
- 8.2. Market Analysis, Insights and Forecast - by Geogrpahy
- 8.2.1. South Africa
- 8.2.2. Zambia
- 8.2.3. Mozambique
- 8.2.4. Angola
- 8.2.5. Rest of Southern Africa
- 8.1. Market Analysis, Insights and Forecast - by Source
- 9. Middle East & Africa Renewable Energy Industry in South Africa Analysis, Insights and Forecast, 2020-2032
- 9.1. Market Analysis, Insights and Forecast - by Source
- 9.1.1. Solar
- 9.1.2. Wind
- 9.1.3. Others
- 9.2. Market Analysis, Insights and Forecast - by Geogrpahy
- 9.2.1. South Africa
- 9.2.2. Zambia
- 9.2.3. Mozambique
- 9.2.4. Angola
- 9.2.5. Rest of Southern Africa
- 9.1. Market Analysis, Insights and Forecast - by Source
- 10. Asia Pacific Renewable Energy Industry in South Africa Analysis, Insights and Forecast, 2020-2032
- 10.1. Market Analysis, Insights and Forecast - by Source
- 10.1.1. Solar
- 10.1.2. Wind
- 10.1.3. Others
- 10.2. Market Analysis, Insights and Forecast - by Geogrpahy
- 10.2.1. South Africa
- 10.2.2. Zambia
- 10.2.3. Mozambique
- 10.2.4. Angola
- 10.2.5. Rest of Southern Africa
- 10.1. Market Analysis, Insights and Forecast - by Source
- 11. Competitive Analysis
- 11.1. Global Market Share Analysis 2025
- 11.2. Company Profiles
- 11.2.1 JinkoSolar Holding Co Ltd
- 11.2.1.1. Overview
- 11.2.1.2. Products
- 11.2.1.3. SWOT Analysis
- 11.2.1.4. Recent Developments
- 11.2.1.5. Financials (Based on Availability)
- 11.2.2 Nordex SE
- 11.2.2.1. Overview
- 11.2.2.2. Products
- 11.2.2.3. SWOT Analysis
- 11.2.2.4. Recent Developments
- 11.2.2.5. Financials (Based on Availability)
- 11.2.3 Juwi Solar Inc
- 11.2.3.1. Overview
- 11.2.3.2. Products
- 11.2.3.3. SWOT Analysis
- 11.2.3.4. Recent Developments
- 11.2.3.5. Financials (Based on Availability)
- 11.2.4 Vestas Wind Systems A/S
- 11.2.4.1. Overview
- 11.2.4.2. Products
- 11.2.4.3. SWOT Analysis
- 11.2.4.4. Recent Developments
- 11.2.4.5. Financials (Based on Availability)
- 11.2.5 Siemens Gamesa Renewable Energy SA
- 11.2.5.1. Overview
- 11.2.5.2. Products
- 11.2.5.3. SWOT Analysis
- 11.2.5.4. Recent Developments
- 11.2.5.5. Financials (Based on Availability)
- 11.2.6 First Solar Inc
- 11.2.6.1. Overview
- 11.2.6.2. Products
- 11.2.6.3. SWOT Analysis
- 11.2.6.4. Recent Developments
- 11.2.6.5. Financials (Based on Availability)
- 11.2.7 Scatec Solar ASA
- 11.2.7.1. Overview
- 11.2.7.2. Products
- 11.2.7.3. SWOT Analysis
- 11.2.7.4. Recent Developments
- 11.2.7.5. Financials (Based on Availability)
- 11.2.8 Acciona SA
- 11.2.8.1. Overview
- 11.2.8.2. Products
- 11.2.8.3. SWOT Analysis
- 11.2.8.4. Recent Developments
- 11.2.8.5. Financials (Based on Availability)
- 11.2.9 Juwi AG*List Not Exhaustive
- 11.2.9.1. Overview
- 11.2.9.2. Products
- 11.2.9.3. SWOT Analysis
- 11.2.9.4. Recent Developments
- 11.2.9.5. Financials (Based on Availability)
- 11.2.1 JinkoSolar Holding Co Ltd
List of Figures
- Figure 1: Global Renewable Energy Industry in South Africa Revenue Breakdown (million, %) by Region 2025 & 2033
- Figure 2: North America Renewable Energy Industry in South Africa Revenue (million), by Source 2025 & 2033
- Figure 3: North America Renewable Energy Industry in South Africa Revenue Share (%), by Source 2025 & 2033
- Figure 4: North America Renewable Energy Industry in South Africa Revenue (million), by Geogrpahy 2025 & 2033
- Figure 5: North America Renewable Energy Industry in South Africa Revenue Share (%), by Geogrpahy 2025 & 2033
- Figure 6: North America Renewable Energy Industry in South Africa Revenue (million), by Country 2025 & 2033
- Figure 7: North America Renewable Energy Industry in South Africa Revenue Share (%), by Country 2025 & 2033
- Figure 8: South America Renewable Energy Industry in South Africa Revenue (million), by Source 2025 & 2033
- Figure 9: South America Renewable Energy Industry in South Africa Revenue Share (%), by Source 2025 & 2033
- Figure 10: South America Renewable Energy Industry in South Africa Revenue (million), by Geogrpahy 2025 & 2033
- Figure 11: South America Renewable Energy Industry in South Africa Revenue Share (%), by Geogrpahy 2025 & 2033
- Figure 12: South America Renewable Energy Industry in South Africa Revenue (million), by Country 2025 & 2033
- Figure 13: South America Renewable Energy Industry in South Africa Revenue Share (%), by Country 2025 & 2033
- Figure 14: Europe Renewable Energy Industry in South Africa Revenue (million), by Source 2025 & 2033
- Figure 15: Europe Renewable Energy Industry in South Africa Revenue Share (%), by Source 2025 & 2033
- Figure 16: Europe Renewable Energy Industry in South Africa Revenue (million), by Geogrpahy 2025 & 2033
- Figure 17: Europe Renewable Energy Industry in South Africa Revenue Share (%), by Geogrpahy 2025 & 2033
- Figure 18: Europe Renewable Energy Industry in South Africa Revenue (million), by Country 2025 & 2033
- Figure 19: Europe Renewable Energy Industry in South Africa Revenue Share (%), by Country 2025 & 2033
- Figure 20: Middle East & Africa Renewable Energy Industry in South Africa Revenue (million), by Source 2025 & 2033
- Figure 21: Middle East & Africa Renewable Energy Industry in South Africa Revenue Share (%), by Source 2025 & 2033
- Figure 22: Middle East & Africa Renewable Energy Industry in South Africa Revenue (million), by Geogrpahy 2025 & 2033
- Figure 23: Middle East & Africa Renewable Energy Industry in South Africa Revenue Share (%), by Geogrpahy 2025 & 2033
- Figure 24: Middle East & Africa Renewable Energy Industry in South Africa Revenue (million), by Country 2025 & 2033
- Figure 25: Middle East & Africa Renewable Energy Industry in South Africa Revenue Share (%), by Country 2025 & 2033
- Figure 26: Asia Pacific Renewable Energy Industry in South Africa Revenue (million), by Source 2025 & 2033
- Figure 27: Asia Pacific Renewable Energy Industry in South Africa Revenue Share (%), by Source 2025 & 2033
- Figure 28: Asia Pacific Renewable Energy Industry in South Africa Revenue (million), by Geogrpahy 2025 & 2033
- Figure 29: Asia Pacific Renewable Energy Industry in South Africa Revenue Share (%), by Geogrpahy 2025 & 2033
- Figure 30: Asia Pacific Renewable Energy Industry in South Africa Revenue (million), by Country 2025 & 2033
- Figure 31: Asia Pacific Renewable Energy Industry in South Africa Revenue Share (%), by Country 2025 & 2033
List of Tables
- Table 1: Global Renewable Energy Industry in South Africa Revenue million Forecast, by Source 2020 & 2033
- Table 2: Global Renewable Energy Industry in South Africa Revenue million Forecast, by Geogrpahy 2020 & 2033
- Table 3: Global Renewable Energy Industry in South Africa Revenue million Forecast, by Region 2020 & 2033
- Table 4: Global Renewable Energy Industry in South Africa Revenue million Forecast, by Source 2020 & 2033
- Table 5: Global Renewable Energy Industry in South Africa Revenue million Forecast, by Geogrpahy 2020 & 2033
- Table 6: Global Renewable Energy Industry in South Africa Revenue million Forecast, by Country 2020 & 2033
- Table 7: United States Renewable Energy Industry in South Africa Revenue (million) Forecast, by Application 2020 & 2033
- Table 8: Canada Renewable Energy Industry in South Africa Revenue (million) Forecast, by Application 2020 & 2033
- Table 9: Mexico Renewable Energy Industry in South Africa Revenue (million) Forecast, by Application 2020 & 2033
- Table 10: Global Renewable Energy Industry in South Africa Revenue million Forecast, by Source 2020 & 2033
- Table 11: Global Renewable Energy Industry in South Africa Revenue million Forecast, by Geogrpahy 2020 & 2033
- Table 12: Global Renewable Energy Industry in South Africa Revenue million Forecast, by Country 2020 & 2033
- Table 13: Brazil Renewable Energy Industry in South Africa Revenue (million) Forecast, by Application 2020 & 2033
- Table 14: Argentina Renewable Energy Industry in South Africa Revenue (million) Forecast, by Application 2020 & 2033
- Table 15: Rest of South America Renewable Energy Industry in South Africa Revenue (million) Forecast, by Application 2020 & 2033
- Table 16: Global Renewable Energy Industry in South Africa Revenue million Forecast, by Source 2020 & 2033
- Table 17: Global Renewable Energy Industry in South Africa Revenue million Forecast, by Geogrpahy 2020 & 2033
- Table 18: Global Renewable Energy Industry in South Africa Revenue million Forecast, by Country 2020 & 2033
- Table 19: United Kingdom Renewable Energy Industry in South Africa Revenue (million) Forecast, by Application 2020 & 2033
- Table 20: Germany Renewable Energy Industry in South Africa Revenue (million) Forecast, by Application 2020 & 2033
- Table 21: France Renewable Energy Industry in South Africa Revenue (million) Forecast, by Application 2020 & 2033
- Table 22: Italy Renewable Energy Industry in South Africa Revenue (million) Forecast, by Application 2020 & 2033
- Table 23: Spain Renewable Energy Industry in South Africa Revenue (million) Forecast, by Application 2020 & 2033
- Table 24: Russia Renewable Energy Industry in South Africa Revenue (million) Forecast, by Application 2020 & 2033
- Table 25: Benelux Renewable Energy Industry in South Africa Revenue (million) Forecast, by Application 2020 & 2033
- Table 26: Nordics Renewable Energy Industry in South Africa Revenue (million) Forecast, by Application 2020 & 2033
- Table 27: Rest of Europe Renewable Energy Industry in South Africa Revenue (million) Forecast, by Application 2020 & 2033
- Table 28: Global Renewable Energy Industry in South Africa Revenue million Forecast, by Source 2020 & 2033
- Table 29: Global Renewable Energy Industry in South Africa Revenue million Forecast, by Geogrpahy 2020 & 2033
- Table 30: Global Renewable Energy Industry in South Africa Revenue million Forecast, by Country 2020 & 2033
- Table 31: Turkey Renewable Energy Industry in South Africa Revenue (million) Forecast, by Application 2020 & 2033
- Table 32: Israel Renewable Energy Industry in South Africa Revenue (million) Forecast, by Application 2020 & 2033
- Table 33: GCC Renewable Energy Industry in South Africa Revenue (million) Forecast, by Application 2020 & 2033
- Table 34: North Africa Renewable Energy Industry in South Africa Revenue (million) Forecast, by Application 2020 & 2033
- Table 35: South Africa Renewable Energy Industry in South Africa Revenue (million) Forecast, by Application 2020 & 2033
- Table 36: Rest of Middle East & Africa Renewable Energy Industry in South Africa Revenue (million) Forecast, by Application 2020 & 2033
- Table 37: Global Renewable Energy Industry in South Africa Revenue million Forecast, by Source 2020 & 2033
- Table 38: Global Renewable Energy Industry in South Africa Revenue million Forecast, by Geogrpahy 2020 & 2033
- Table 39: Global Renewable Energy Industry in South Africa Revenue million Forecast, by Country 2020 & 2033
- Table 40: China Renewable Energy Industry in South Africa Revenue (million) Forecast, by Application 2020 & 2033
- Table 41: India Renewable Energy Industry in South Africa Revenue (million) Forecast, by Application 2020 & 2033
- Table 42: Japan Renewable Energy Industry in South Africa Revenue (million) Forecast, by Application 2020 & 2033
- Table 43: South Korea Renewable Energy Industry in South Africa Revenue (million) Forecast, by Application 2020 & 2033
- Table 44: ASEAN Renewable Energy Industry in South Africa Revenue (million) Forecast, by Application 2020 & 2033
- Table 45: Oceania Renewable Energy Industry in South Africa Revenue (million) Forecast, by Application 2020 & 2033
- Table 46: Rest of Asia Pacific Renewable Energy Industry in South Africa Revenue (million) Forecast, by Application 2020 & 2033
Frequently Asked Questions
1. What is the projected Compound Annual Growth Rate (CAGR) of the Renewable Energy Industry in South Africa?
The projected CAGR is approximately 8.5%.
2. Which companies are prominent players in the Renewable Energy Industry in South Africa?
Key companies in the market include JinkoSolar Holding Co Ltd, Nordex SE, Juwi Solar Inc, Vestas Wind Systems A/S, Siemens Gamesa Renewable Energy SA, First Solar Inc, Scatec Solar ASA, Acciona SA, Juwi AG*List Not Exhaustive.
3. What are the main segments of the Renewable Energy Industry in South Africa?
The market segments include Source, Geogrpahy.
4. Can you provide details about the market size?
The market size is estimated to be USD 100270.5 million as of 2022.
5. What are some drivers contributing to market growth?
N/A
6. What are the notable trends driving market growth?
Solar Energy is Expected to Drive the Market.
7. Are there any restraints impacting market growth?
N/A
8. Can you provide examples of recent developments in the market?
December 2022: the sixth renewable auction in South Africa concluded with the lowest bid of USD 0.02689/kWh. South Africa selected five solar projects with a combined capacity of 860 MW.
9. What pricing options are available for accessing the report?
Pricing options include single-user, multi-user, and enterprise licenses priced at USD 4750, USD 5250, and USD 8750 respectively.
10. Is the market size provided in terms of value or volume?
The market size is provided in terms of value, measured in million.
11. Are there any specific market keywords associated with the report?
Yes, the market keyword associated with the report is "Renewable Energy Industry in South Africa," which aids in identifying and referencing the specific market segment covered.
12. How do I determine which pricing option suits my needs best?
The pricing options vary based on user requirements and access needs. Individual users may opt for single-user licenses, while businesses requiring broader access may choose multi-user or enterprise licenses for cost-effective access to the report.
13. Are there any additional resources or data provided in the Renewable Energy Industry in South Africa report?
While the report offers comprehensive insights, it's advisable to review the specific contents or supplementary materials provided to ascertain if additional resources or data are available.
14. How can I stay updated on further developments or reports in the Renewable Energy Industry in South Africa?
To stay informed about further developments, trends, and reports in the Renewable Energy Industry in South Africa, consider subscribing to industry newsletters, following relevant companies and organizations, or regularly checking reputable industry news sources and publications.
Methodology
Step 1 - Identification of Relevant Samples Size from Population Database


Step 2 - Approaches for Defining Global Market Size (Value, Volume* & Price*)

Note*: In applicable scenarios
Step 3 - Data Sources
Primary Research
- Web Analytics
- Survey Reports
- Research Institute
- Latest Research Reports
- Opinion Leaders
Secondary Research
- Annual Reports
- White Paper
- Latest Press Release
- Industry Association
- Paid Database
- Investor Presentations

Step 4 - Data Triangulation
Involves using different sources of information in order to increase the validity of a study
These sources are likely to be stakeholders in a program - participants, other researchers, program staff, other community members, and so on.
Then we put all data in single framework & apply various statistical tools to find out the dynamic on the market.
During the analysis stage, feedback from the stakeholder groups would be compared to determine areas of agreement as well as areas of divergence