
Key Insights
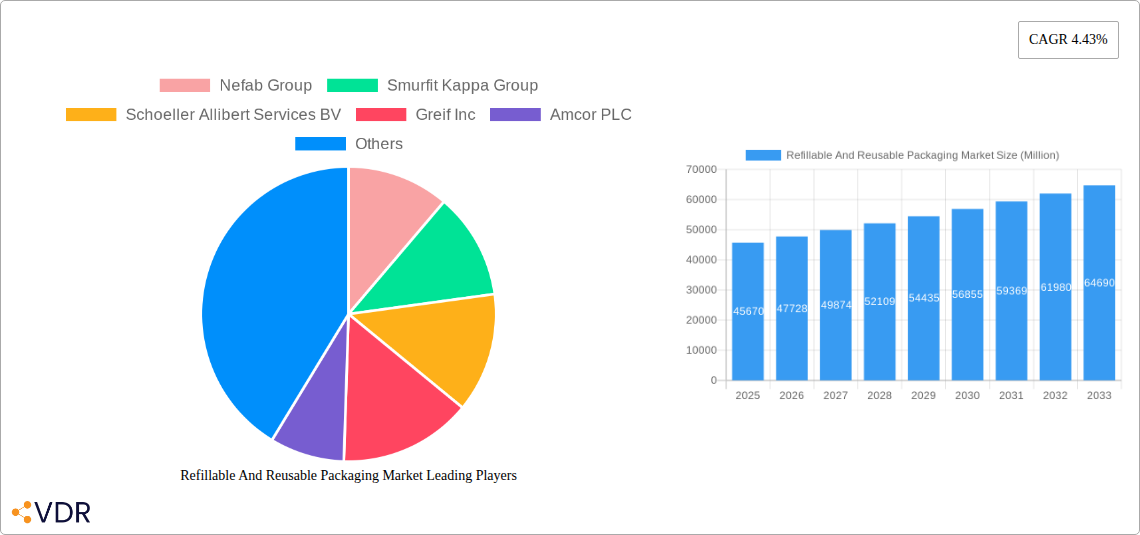
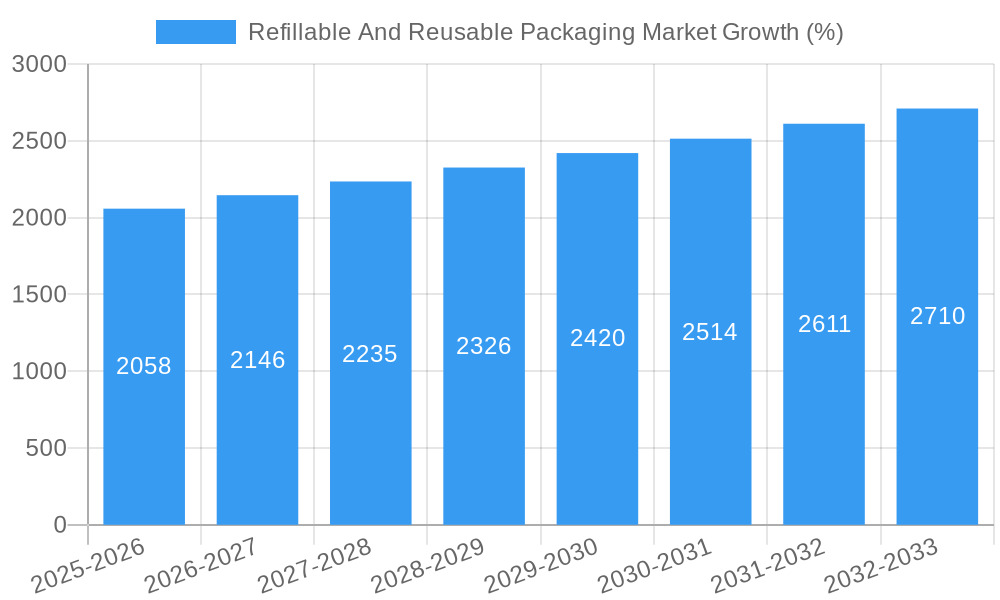
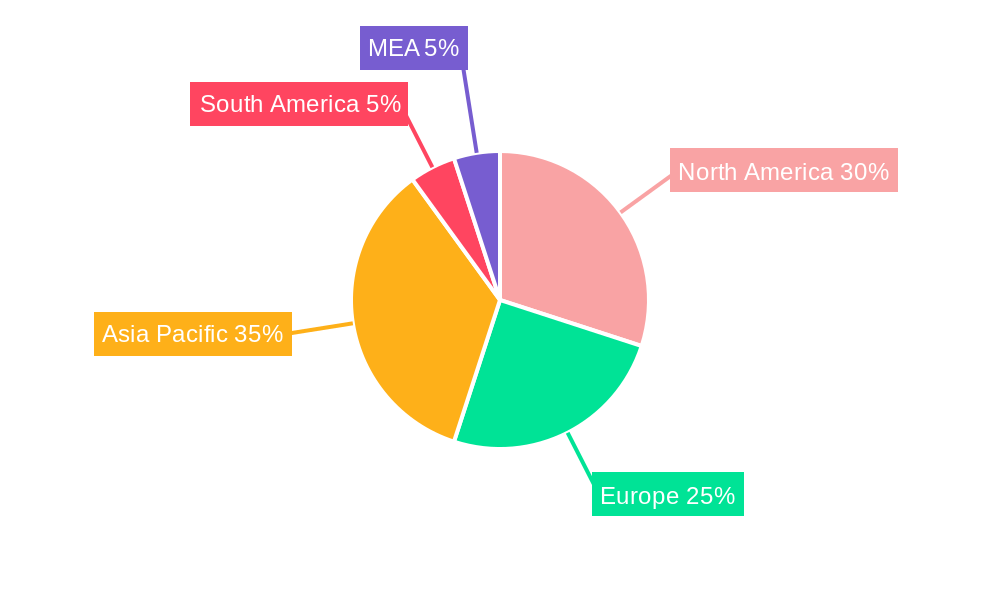
The refillable and reusable packaging market, currently valued at $45.67 billion in 2025, is experiencing robust growth, projected to expand at a compound annual growth rate (CAGR) of 4.43% from 2025 to 2033. This surge is driven by increasing consumer awareness of environmental sustainability, stricter government regulations on single-use plastics, and the rising adoption of circular economy principles across various industries. Key segments fueling this growth include food and beverage, cosmetics and personal care, and e-commerce, where reusable packaging offers logistical and brand image advantages. The preference for sustainable materials like recycled plastics and paperboard, alongside innovative product designs like IBCs and returnable pallets, further contributes to market expansion. While initial investment costs for reusable systems might pose a restraint for some businesses, the long-term cost savings and enhanced brand reputation are proving compelling incentives. Geographic growth is expected to be diverse, with North America and Europe maintaining strong positions due to established regulatory frameworks and consumer demand, while Asia-Pacific is poised for significant growth driven by increasing industrialization and rising disposable incomes.
The competitive landscape is characterized by a mix of large multinational corporations like Amcor PLC and Smurfit Kappa Group, alongside specialized players focusing on specific packaging types or industries. Ongoing innovation in materials science, logistics optimization, and digital tracking technologies are transforming the industry. The development of lightweight, durable, and easily sanitized reusable packaging solutions will be crucial for future growth. Furthermore, collaborations between packaging producers, retailers, and consumers are becoming essential to establish efficient collection and return systems, ensuring the success of the circular economy model within the refillable and reusable packaging sector. The market's future trajectory will depend significantly on the continued adoption of sustainable practices across various industries and governments' effective implementation of policies that encourage the use of reusable packaging.
This comprehensive report provides a detailed analysis of the refillable and reusable packaging market, encompassing market dynamics, growth trends, regional dominance, product landscapes, key challenges, emerging opportunities, and key players. The study period covers 2019-2033, with 2025 as the base year and a forecast period of 2025-2033. The market is segmented by end-user industry, material, and product type, offering granular insights into this rapidly evolving sector. The report's value is in the Million units.
Market Size: The global refillable and reusable packaging market is projected to reach xx Million units by 2033, exhibiting a CAGR of xx% during the forecast period.
Refillable And Reusable Packaging Market Market Dynamics & Structure
The refillable and reusable packaging market is characterized by moderate concentration, with key players such as Nefab Group, Smurfit Kappa Group, and Amcor PLC holding significant market share. However, the market exhibits a fragmented landscape due to the presence of several regional and niche players. Technological innovation is a crucial driver, with advancements in materials science and packaging design leading to lighter, stronger, and more sustainable solutions. Stringent environmental regulations globally are pushing the adoption of reusable alternatives to single-use packaging. The market also faces competition from substitute products like flexible packaging and innovative dispensing systems. The end-user demographics are diverse, spanning various sectors, and M&A activity is frequent, as evidenced by Nefab Group's acquisition of PolyFlex Products Inc. in June 2023, demonstrating consolidation trends in the industry.
- Market Concentration: Moderately concentrated, with top players holding xx% market share.
- Technological Innovation: Focus on lightweighting, improved durability, and sustainable materials (e.g., recycled plastics, bioplastics).
- Regulatory Frameworks: Increasingly stringent regulations on single-use plastics driving market growth.
- Competitive Product Substitutes: Flexible packaging and innovative dispensing systems pose challenges.
- End-User Demographics: Diverse, including food and beverage, cosmetics, household care, and industrial sectors.
- M&A Trends: Consolidation through acquisitions, as seen with Nefab Group’s acquisition of PolyFlex Products Inc. (approximately xx deals in the last 5 years).
Refillable And Reusable Packaging Market Growth Trends & Insights
The refillable and reusable packaging market has witnessed significant growth over the historical period (2019-2024), driven by increasing consumer awareness of environmental sustainability and growing governmental support for eco-friendly packaging solutions. The market is experiencing a shift from single-use to reusable packaging across various end-use industries, spurred by technological advancements in materials and design. Adoption rates are rising steadily, particularly in developed economies with robust environmental regulations. Technological disruptions, such as the introduction of smart packaging solutions and improved logistics systems for efficient refill models, are accelerating market expansion. Consumer behavior is evolving towards environmentally conscious choices, further fueling the demand for reusable and refillable packaging options. The market shows strong growth potential in emerging economies, where rising disposable incomes and growing awareness of environmental issues are contributing to increased adoption.
Dominant Regions, Countries, or Segments in Refillable And Reusable Packaging Market
The North American and European regions currently dominate the refillable and reusable packaging market, driven by strong environmental regulations, high consumer awareness, and significant investment in sustainable packaging solutions. Within these regions, countries such as the US, Germany, and the UK demonstrate strong market shares, although growth is expected in other developed nations as well. The Food and Beverage segment leads across regions, owing to its significant volume of packaging needs and increasing demand for sustainable options from consumers. The Plastic segment holds a large share, due to its versatility and cost-effectiveness, though Paper and Paperboard is gaining momentum due to its renewability and recyclability. Bottles and Containers remain the dominant product type, due to widespread use in various industries, but other products such as pallets and crates are also demonstrating significant growth in industrial applications.
- Key Drivers: Stringent environmental regulations in North America and Europe; increased consumer demand for sustainable products; government initiatives promoting circular economy models.
- Dominant Regions: North America and Europe (with the US, Germany, and the UK leading).
- Dominant Segments: Food and Beverage (By End-user Industry); Plastic (By Material); Bottles and Containers (By Product).
- Growth Potential: High growth potential in emerging economies (Asia-Pacific, Latin America) driven by increased consumer disposable income and environmental awareness.
Refillable And Reusable Packaging Market Product Landscape
The refillable and reusable packaging market offers a wide array of products, from simple bottles and containers to sophisticated pallets and IBCs. Innovation is focused on enhancing durability, lightweighting, and improving recyclability or compostability of materials. Advanced features, such as tamper-evident seals and RFID tracking capabilities, are increasingly incorporated for enhanced security and traceability. The unique selling propositions include reduced environmental impact, cost savings through reuse, and improved brand image for companies adopting sustainable packaging solutions. Technological advancements include using innovative materials like bioplastics and designing reusable packaging for efficient logistical processes.
Key Drivers, Barriers & Challenges in Refillable And Reusable Packaging Market
Key Drivers:
- Growing consumer demand for sustainable products.
- Increasing environmental regulations.
- Technological advancements leading to more efficient and durable reusable packaging.
- Government incentives and subsidies promoting circular economy models.
Key Challenges & Restraints:
- Higher initial investment costs compared to single-use packaging.
- The need for robust cleaning and sanitation infrastructure for reusable containers.
- Potential supply chain complexities related to logistics and return systems.
- Competition from existing single-use packaging solutions.
- xx% of businesses cited high implementation costs as a major obstacle to adoption.
Emerging Opportunities in Refillable And Reusable Packaging Market
- Growing demand for sustainable packaging in e-commerce and food delivery services.
- Development of innovative refill systems and subscription models.
- Expansion into emerging markets with rising consumer awareness of environmental issues.
- Opportunities in the development of biodegradable and compostable reusable packaging.
- Creation of closed-loop systems for efficient collection and reuse.
Growth Accelerators in the Refillable And Reusable Packaging Market Industry
The refillable and reusable packaging market is poised for sustained growth due to several significant factors. Continued technological breakthroughs in material science and packaging design will lead to more durable and sustainable solutions. Strategic partnerships between packaging manufacturers, retailers, and logistics providers will streamline supply chains and enhance the efficiency of refill systems. Expanding into new markets, particularly in developing economies, will open up significant growth opportunities as consumer awareness of sustainable packaging increases. Furthermore, government policies incentivizing the adoption of sustainable packaging and penalizing single-use plastics will create a favorable regulatory environment for market expansion.
Key Players Shaping the Refillable And Reusable Packaging Market Market
- Nefab Group
- Smurfit Kappa Group
- Schoeller Allibert Services BV
- Greif Inc
- Amcor PLC
- Mondi PLC
- IPL Inc
- IFCO Systems
- Petainer Ltd
- Bormioli Luigi Corporation
- Vetropack Holding Ltd
- Jiangmen UA Packaging Co Lt
- GWP Group
- Refillism
- Berry Global Inc
- Orbis Corporation
- International Paper
Notable Milestones in Refillable And Reusable Packaging Market Sector
- June 2023: Nefab Group AB acquired PolyFlex Products Inc., strengthening its position in reusable packaging for industrial applications.
- October 2023: Berry Global Inc. launched a 14-liter HDPE reusable container for a refill packaging solution piloted by Aldi UK.
In-Depth Refillable And Reusable Packaging Market Market Outlook
The future of the refillable and reusable packaging market looks extremely promising. Continued growth is expected, driven by strong consumer demand for sustainable alternatives, supportive government policies, and innovative product developments. Strategic partnerships and investments in infrastructure will be crucial to further enhancing efficiency and reducing implementation barriers. The market presents significant opportunities for companies that can effectively integrate sustainable packaging solutions into their operations, creating a competitive advantage and contributing to a more circular economy.
Refillable And Reusable Packaging Market Segmentation
-
1. Material
- 1.1. Plastic
- 1.2. Paper and Paperboard
- 1.3. Metal
- 1.4. Glass
-
2. Product
- 2.1. Bottles and Containers
- 2.2. Pallets and Crates
- 2.3. IBCs
- 2.4. Drums and Barrels
- 2.5. Boxes and Cartons
- 2.6. Cans and Pails
- 2.7. Others P
-
3. End-user Industry
- 3.1. Food and Beverage
- 3.2. Cosmetics and Personal Care
- 3.3. Household Care
- 3.4. Chemicals and Petrochemicals
- 3.5. Building and Construction
- 3.6. Shipping and Transportation
- 3.7. Other En
Refillable And Reusable Packaging Market Segmentation By Geography
- 1. North America
- 2. Europe
- 3. Asia Pacific
- 4. Latin America
- 5. Middle East and Africa
Refillable And Reusable Packaging Market REPORT HIGHLIGHTS
| Aspects | Details |
|---|---|
| Study Period | 2019-2033 |
| Base Year | 2024 |
| Estimated Year | 2025 |
| Forecast Period | 2025-2033 |
| Historical Period | 2019-2024 |
| Growth Rate | CAGR of 4.43% from 2019-2033 |
| Segmentation |
|
Table of Contents
- 1. Introduction
- 1.1. Research Scope
- 1.2. Market Segmentation
- 1.3. Research Methodology
- 1.4. Definitions and Assumptions
- 2. Executive Summary
- 2.1. Introduction
- 3. Market Dynamics
- 3.1. Introduction
- 3.2. Market Drivers
- 3.2.1. Rising Demand for Sustainable and Recyclable Refillable Packaging; Increasing Need for Smart and Trackable Reusable Packaging Solutions
- 3.3. Market Restrains
- 3.3.1. Supply Chain Disruptions and Regulatory Changes Might Limit the Market Growth
- 3.4. Market Trends
- 3.4.1. Pallets and Crates are Expected to Witness Growth
- 4. Market Factor Analysis
- 4.1. Porters Five Forces
- 4.2. Supply/Value Chain
- 4.3. PESTEL analysis
- 4.4. Market Entropy
- 4.5. Patent/Trademark Analysis
- 5. Global Refillable And Reusable Packaging Market Analysis, Insights and Forecast, 2019-2031
- 5.1. Market Analysis, Insights and Forecast - by Material
- 5.1.1. Plastic
- 5.1.2. Paper and Paperboard
- 5.1.3. Metal
- 5.1.4. Glass
- 5.2. Market Analysis, Insights and Forecast - by Product
- 5.2.1. Bottles and Containers
- 5.2.2. Pallets and Crates
- 5.2.3. IBCs
- 5.2.4. Drums and Barrels
- 5.2.5. Boxes and Cartons
- 5.2.6. Cans and Pails
- 5.2.7. Others P
- 5.3. Market Analysis, Insights and Forecast - by End-user Industry
- 5.3.1. Food and Beverage
- 5.3.2. Cosmetics and Personal Care
- 5.3.3. Household Care
- 5.3.4. Chemicals and Petrochemicals
- 5.3.5. Building and Construction
- 5.3.6. Shipping and Transportation
- 5.3.7. Other En
- 5.4. Market Analysis, Insights and Forecast - by Region
- 5.4.1. North America
- 5.4.2. Europe
- 5.4.3. Asia Pacific
- 5.4.4. Latin America
- 5.4.5. Middle East and Africa
- 5.1. Market Analysis, Insights and Forecast - by Material
- 6. North America Refillable And Reusable Packaging Market Analysis, Insights and Forecast, 2019-2031
- 6.1. Market Analysis, Insights and Forecast - by Material
- 6.1.1. Plastic
- 6.1.2. Paper and Paperboard
- 6.1.3. Metal
- 6.1.4. Glass
- 6.2. Market Analysis, Insights and Forecast - by Product
- 6.2.1. Bottles and Containers
- 6.2.2. Pallets and Crates
- 6.2.3. IBCs
- 6.2.4. Drums and Barrels
- 6.2.5. Boxes and Cartons
- 6.2.6. Cans and Pails
- 6.2.7. Others P
- 6.3. Market Analysis, Insights and Forecast - by End-user Industry
- 6.3.1. Food and Beverage
- 6.3.2. Cosmetics and Personal Care
- 6.3.3. Household Care
- 6.3.4. Chemicals and Petrochemicals
- 6.3.5. Building and Construction
- 6.3.6. Shipping and Transportation
- 6.3.7. Other En
- 6.1. Market Analysis, Insights and Forecast - by Material
- 7. Europe Refillable And Reusable Packaging Market Analysis, Insights and Forecast, 2019-2031
- 7.1. Market Analysis, Insights and Forecast - by Material
- 7.1.1. Plastic
- 7.1.2. Paper and Paperboard
- 7.1.3. Metal
- 7.1.4. Glass
- 7.2. Market Analysis, Insights and Forecast - by Product
- 7.2.1. Bottles and Containers
- 7.2.2. Pallets and Crates
- 7.2.3. IBCs
- 7.2.4. Drums and Barrels
- 7.2.5. Boxes and Cartons
- 7.2.6. Cans and Pails
- 7.2.7. Others P
- 7.3. Market Analysis, Insights and Forecast - by End-user Industry
- 7.3.1. Food and Beverage
- 7.3.2. Cosmetics and Personal Care
- 7.3.3. Household Care
- 7.3.4. Chemicals and Petrochemicals
- 7.3.5. Building and Construction
- 7.3.6. Shipping and Transportation
- 7.3.7. Other En
- 7.1. Market Analysis, Insights and Forecast - by Material
- 8. Asia Pacific Refillable And Reusable Packaging Market Analysis, Insights and Forecast, 2019-2031
- 8.1. Market Analysis, Insights and Forecast - by Material
- 8.1.1. Plastic
- 8.1.2. Paper and Paperboard
- 8.1.3. Metal
- 8.1.4. Glass
- 8.2. Market Analysis, Insights and Forecast - by Product
- 8.2.1. Bottles and Containers
- 8.2.2. Pallets and Crates
- 8.2.3. IBCs
- 8.2.4. Drums and Barrels
- 8.2.5. Boxes and Cartons
- 8.2.6. Cans and Pails
- 8.2.7. Others P
- 8.3. Market Analysis, Insights and Forecast - by End-user Industry
- 8.3.1. Food and Beverage
- 8.3.2. Cosmetics and Personal Care
- 8.3.3. Household Care
- 8.3.4. Chemicals and Petrochemicals
- 8.3.5. Building and Construction
- 8.3.6. Shipping and Transportation
- 8.3.7. Other En
- 8.1. Market Analysis, Insights and Forecast - by Material
- 9. Latin America Refillable And Reusable Packaging Market Analysis, Insights and Forecast, 2019-2031
- 9.1. Market Analysis, Insights and Forecast - by Material
- 9.1.1. Plastic
- 9.1.2. Paper and Paperboard
- 9.1.3. Metal
- 9.1.4. Glass
- 9.2. Market Analysis, Insights and Forecast - by Product
- 9.2.1. Bottles and Containers
- 9.2.2. Pallets and Crates
- 9.2.3. IBCs
- 9.2.4. Drums and Barrels
- 9.2.5. Boxes and Cartons
- 9.2.6. Cans and Pails
- 9.2.7. Others P
- 9.3. Market Analysis, Insights and Forecast - by End-user Industry
- 9.3.1. Food and Beverage
- 9.3.2. Cosmetics and Personal Care
- 9.3.3. Household Care
- 9.3.4. Chemicals and Petrochemicals
- 9.3.5. Building and Construction
- 9.3.6. Shipping and Transportation
- 9.3.7. Other En
- 9.1. Market Analysis, Insights and Forecast - by Material
- 10. Middle East and Africa Refillable And Reusable Packaging Market Analysis, Insights and Forecast, 2019-2031
- 10.1. Market Analysis, Insights and Forecast - by Material
- 10.1.1. Plastic
- 10.1.2. Paper and Paperboard
- 10.1.3. Metal
- 10.1.4. Glass
- 10.2. Market Analysis, Insights and Forecast - by Product
- 10.2.1. Bottles and Containers
- 10.2.2. Pallets and Crates
- 10.2.3. IBCs
- 10.2.4. Drums and Barrels
- 10.2.5. Boxes and Cartons
- 10.2.6. Cans and Pails
- 10.2.7. Others P
- 10.3. Market Analysis, Insights and Forecast - by End-user Industry
- 10.3.1. Food and Beverage
- 10.3.2. Cosmetics and Personal Care
- 10.3.3. Household Care
- 10.3.4. Chemicals and Petrochemicals
- 10.3.5. Building and Construction
- 10.3.6. Shipping and Transportation
- 10.3.7. Other En
- 10.1. Market Analysis, Insights and Forecast - by Material
- 11. North America Refillable And Reusable Packaging Market Analysis, Insights and Forecast, 2019-2031
- 11.1. Market Analysis, Insights and Forecast - By Country/Sub-region
- 11.1.1 United States
- 11.1.2 Canada
- 11.1.3 Mexico
- 12. Europe Refillable And Reusable Packaging Market Analysis, Insights and Forecast, 2019-2031
- 12.1. Market Analysis, Insights and Forecast - By Country/Sub-region
- 12.1.1 Germany
- 12.1.2 United Kingdom
- 12.1.3 France
- 12.1.4 Spain
- 12.1.5 Italy
- 12.1.6 Spain
- 12.1.7 Belgium
- 12.1.8 Netherland
- 12.1.9 Nordics
- 12.1.10 Rest of Europe
- 13. Asia Pacific Refillable And Reusable Packaging Market Analysis, Insights and Forecast, 2019-2031
- 13.1. Market Analysis, Insights and Forecast - By Country/Sub-region
- 13.1.1 China
- 13.1.2 Japan
- 13.1.3 India
- 13.1.4 South Korea
- 13.1.5 Southeast Asia
- 13.1.6 Australia
- 13.1.7 Indonesia
- 13.1.8 Phillipes
- 13.1.9 Singapore
- 13.1.10 Thailandc
- 13.1.11 Rest of Asia Pacific
- 14. South America Refillable And Reusable Packaging Market Analysis, Insights and Forecast, 2019-2031
- 14.1. Market Analysis, Insights and Forecast - By Country/Sub-region
- 14.1.1 Brazil
- 14.1.2 Argentina
- 14.1.3 Peru
- 14.1.4 Chile
- 14.1.5 Colombia
- 14.1.6 Ecuador
- 14.1.7 Venezuela
- 14.1.8 Rest of South America
- 15. North America Refillable And Reusable Packaging Market Analysis, Insights and Forecast, 2019-2031
- 15.1. Market Analysis, Insights and Forecast - By Country/Sub-region
- 15.1.1 United States
- 15.1.2 Canada
- 15.1.3 Mexico
- 16. MEA Refillable And Reusable Packaging Market Analysis, Insights and Forecast, 2019-2031
- 16.1. Market Analysis, Insights and Forecast - By Country/Sub-region
- 16.1.1 United Arab Emirates
- 16.1.2 Saudi Arabia
- 16.1.3 South Africa
- 16.1.4 Rest of Middle East and Africa
- 17. Competitive Analysis
- 17.1. Global Market Share Analysis 2024
- 17.2. Company Profiles
- 17.2.1 Nefab Group
- 17.2.1.1. Overview
- 17.2.1.2. Products
- 17.2.1.3. SWOT Analysis
- 17.2.1.4. Recent Developments
- 17.2.1.5. Financials (Based on Availability)
- 17.2.2 Smurfit Kappa Group
- 17.2.2.1. Overview
- 17.2.2.2. Products
- 17.2.2.3. SWOT Analysis
- 17.2.2.4. Recent Developments
- 17.2.2.5. Financials (Based on Availability)
- 17.2.3 Schoeller Allibert Services BV
- 17.2.3.1. Overview
- 17.2.3.2. Products
- 17.2.3.3. SWOT Analysis
- 17.2.3.4. Recent Developments
- 17.2.3.5. Financials (Based on Availability)
- 17.2.4 Greif Inc
- 17.2.4.1. Overview
- 17.2.4.2. Products
- 17.2.4.3. SWOT Analysis
- 17.2.4.4. Recent Developments
- 17.2.4.5. Financials (Based on Availability)
- 17.2.5 Amcor PLC
- 17.2.5.1. Overview
- 17.2.5.2. Products
- 17.2.5.3. SWOT Analysis
- 17.2.5.4. Recent Developments
- 17.2.5.5. Financials (Based on Availability)
- 17.2.6 Mondi PLC
- 17.2.6.1. Overview
- 17.2.6.2. Products
- 17.2.6.3. SWOT Analysis
- 17.2.6.4. Recent Developments
- 17.2.6.5. Financials (Based on Availability)
- 17.2.7 IPL Inc
- 17.2.7.1. Overview
- 17.2.7.2. Products
- 17.2.7.3. SWOT Analysis
- 17.2.7.4. Recent Developments
- 17.2.7.5. Financials (Based on Availability)
- 17.2.8 IFCO Systems
- 17.2.8.1. Overview
- 17.2.8.2. Products
- 17.2.8.3. SWOT Analysis
- 17.2.8.4. Recent Developments
- 17.2.8.5. Financials (Based on Availability)
- 17.2.9 Petainer Ltd
- 17.2.9.1. Overview
- 17.2.9.2. Products
- 17.2.9.3. SWOT Analysis
- 17.2.9.4. Recent Developments
- 17.2.9.5. Financials (Based on Availability)
- 17.2.10 Bormioli Luigi Corporation
- 17.2.10.1. Overview
- 17.2.10.2. Products
- 17.2.10.3. SWOT Analysis
- 17.2.10.4. Recent Developments
- 17.2.10.5. Financials (Based on Availability)
- 17.2.11 Vetropack Holding Ltd
- 17.2.11.1. Overview
- 17.2.11.2. Products
- 17.2.11.3. SWOT Analysis
- 17.2.11.4. Recent Developments
- 17.2.11.5. Financials (Based on Availability)
- 17.2.12 Jiangmen UA Packaging Co Lt
- 17.2.12.1. Overview
- 17.2.12.2. Products
- 17.2.12.3. SWOT Analysis
- 17.2.12.4. Recent Developments
- 17.2.12.5. Financials (Based on Availability)
- 17.2.13 GWP Group
- 17.2.13.1. Overview
- 17.2.13.2. Products
- 17.2.13.3. SWOT Analysis
- 17.2.13.4. Recent Developments
- 17.2.13.5. Financials (Based on Availability)
- 17.2.14 Refillism
- 17.2.14.1. Overview
- 17.2.14.2. Products
- 17.2.14.3. SWOT Analysis
- 17.2.14.4. Recent Developments
- 17.2.14.5. Financials (Based on Availability)
- 17.2.15 Berry Global Inc
- 17.2.15.1. Overview
- 17.2.15.2. Products
- 17.2.15.3. SWOT Analysis
- 17.2.15.4. Recent Developments
- 17.2.15.5. Financials (Based on Availability)
- 17.2.16 Orbis Corporation
- 17.2.16.1. Overview
- 17.2.16.2. Products
- 17.2.16.3. SWOT Analysis
- 17.2.16.4. Recent Developments
- 17.2.16.5. Financials (Based on Availability)
- 17.2.17 International Paper
- 17.2.17.1. Overview
- 17.2.17.2. Products
- 17.2.17.3. SWOT Analysis
- 17.2.17.4. Recent Developments
- 17.2.17.5. Financials (Based on Availability)
- 17.2.1 Nefab Group
List of Figures
- Figure 1: Global Refillable And Reusable Packaging Market Revenue Breakdown (Million, %) by Region 2024 & 2032
- Figure 2: North America Refillable And Reusable Packaging Market Revenue (Million), by Country 2024 & 2032
- Figure 3: North America Refillable And Reusable Packaging Market Revenue Share (%), by Country 2024 & 2032
- Figure 4: Europe Refillable And Reusable Packaging Market Revenue (Million), by Country 2024 & 2032
- Figure 5: Europe Refillable And Reusable Packaging Market Revenue Share (%), by Country 2024 & 2032
- Figure 6: Asia Pacific Refillable And Reusable Packaging Market Revenue (Million), by Country 2024 & 2032
- Figure 7: Asia Pacific Refillable And Reusable Packaging Market Revenue Share (%), by Country 2024 & 2032
- Figure 8: South America Refillable And Reusable Packaging Market Revenue (Million), by Country 2024 & 2032
- Figure 9: South America Refillable And Reusable Packaging Market Revenue Share (%), by Country 2024 & 2032
- Figure 10: North America Refillable And Reusable Packaging Market Revenue (Million), by Country 2024 & 2032
- Figure 11: North America Refillable And Reusable Packaging Market Revenue Share (%), by Country 2024 & 2032
- Figure 12: MEA Refillable And Reusable Packaging Market Revenue (Million), by Country 2024 & 2032
- Figure 13: MEA Refillable And Reusable Packaging Market Revenue Share (%), by Country 2024 & 2032
- Figure 14: North America Refillable And Reusable Packaging Market Revenue (Million), by Material 2024 & 2032
- Figure 15: North America Refillable And Reusable Packaging Market Revenue Share (%), by Material 2024 & 2032
- Figure 16: North America Refillable And Reusable Packaging Market Revenue (Million), by Product 2024 & 2032
- Figure 17: North America Refillable And Reusable Packaging Market Revenue Share (%), by Product 2024 & 2032
- Figure 18: North America Refillable And Reusable Packaging Market Revenue (Million), by End-user Industry 2024 & 2032
- Figure 19: North America Refillable And Reusable Packaging Market Revenue Share (%), by End-user Industry 2024 & 2032
- Figure 20: North America Refillable And Reusable Packaging Market Revenue (Million), by Country 2024 & 2032
- Figure 21: North America Refillable And Reusable Packaging Market Revenue Share (%), by Country 2024 & 2032
- Figure 22: Europe Refillable And Reusable Packaging Market Revenue (Million), by Material 2024 & 2032
- Figure 23: Europe Refillable And Reusable Packaging Market Revenue Share (%), by Material 2024 & 2032
- Figure 24: Europe Refillable And Reusable Packaging Market Revenue (Million), by Product 2024 & 2032
- Figure 25: Europe Refillable And Reusable Packaging Market Revenue Share (%), by Product 2024 & 2032
- Figure 26: Europe Refillable And Reusable Packaging Market Revenue (Million), by End-user Industry 2024 & 2032
- Figure 27: Europe Refillable And Reusable Packaging Market Revenue Share (%), by End-user Industry 2024 & 2032
- Figure 28: Europe Refillable And Reusable Packaging Market Revenue (Million), by Country 2024 & 2032
- Figure 29: Europe Refillable And Reusable Packaging Market Revenue Share (%), by Country 2024 & 2032
- Figure 30: Asia Pacific Refillable And Reusable Packaging Market Revenue (Million), by Material 2024 & 2032
- Figure 31: Asia Pacific Refillable And Reusable Packaging Market Revenue Share (%), by Material 2024 & 2032
- Figure 32: Asia Pacific Refillable And Reusable Packaging Market Revenue (Million), by Product 2024 & 2032
- Figure 33: Asia Pacific Refillable And Reusable Packaging Market Revenue Share (%), by Product 2024 & 2032
- Figure 34: Asia Pacific Refillable And Reusable Packaging Market Revenue (Million), by End-user Industry 2024 & 2032
- Figure 35: Asia Pacific Refillable And Reusable Packaging Market Revenue Share (%), by End-user Industry 2024 & 2032
- Figure 36: Asia Pacific Refillable And Reusable Packaging Market Revenue (Million), by Country 2024 & 2032
- Figure 37: Asia Pacific Refillable And Reusable Packaging Market Revenue Share (%), by Country 2024 & 2032
- Figure 38: Latin America Refillable And Reusable Packaging Market Revenue (Million), by Material 2024 & 2032
- Figure 39: Latin America Refillable And Reusable Packaging Market Revenue Share (%), by Material 2024 & 2032
- Figure 40: Latin America Refillable And Reusable Packaging Market Revenue (Million), by Product 2024 & 2032
- Figure 41: Latin America Refillable And Reusable Packaging Market Revenue Share (%), by Product 2024 & 2032
- Figure 42: Latin America Refillable And Reusable Packaging Market Revenue (Million), by End-user Industry 2024 & 2032
- Figure 43: Latin America Refillable And Reusable Packaging Market Revenue Share (%), by End-user Industry 2024 & 2032
- Figure 44: Latin America Refillable And Reusable Packaging Market Revenue (Million), by Country 2024 & 2032
- Figure 45: Latin America Refillable And Reusable Packaging Market Revenue Share (%), by Country 2024 & 2032
- Figure 46: Middle East and Africa Refillable And Reusable Packaging Market Revenue (Million), by Material 2024 & 2032
- Figure 47: Middle East and Africa Refillable And Reusable Packaging Market Revenue Share (%), by Material 2024 & 2032
- Figure 48: Middle East and Africa Refillable And Reusable Packaging Market Revenue (Million), by Product 2024 & 2032
- Figure 49: Middle East and Africa Refillable And Reusable Packaging Market Revenue Share (%), by Product 2024 & 2032
- Figure 50: Middle East and Africa Refillable And Reusable Packaging Market Revenue (Million), by End-user Industry 2024 & 2032
- Figure 51: Middle East and Africa Refillable And Reusable Packaging Market Revenue Share (%), by End-user Industry 2024 & 2032
- Figure 52: Middle East and Africa Refillable And Reusable Packaging Market Revenue (Million), by Country 2024 & 2032
- Figure 53: Middle East and Africa Refillable And Reusable Packaging Market Revenue Share (%), by Country 2024 & 2032
List of Tables
- Table 1: Global Refillable And Reusable Packaging Market Revenue Million Forecast, by Region 2019 & 2032
- Table 2: Global Refillable And Reusable Packaging Market Revenue Million Forecast, by Material 2019 & 2032
- Table 3: Global Refillable And Reusable Packaging Market Revenue Million Forecast, by Product 2019 & 2032
- Table 4: Global Refillable And Reusable Packaging Market Revenue Million Forecast, by End-user Industry 2019 & 2032
- Table 5: Global Refillable And Reusable Packaging Market Revenue Million Forecast, by Region 2019 & 2032
- Table 6: Global Refillable And Reusable Packaging Market Revenue Million Forecast, by Country 2019 & 2032
- Table 7: United States Refillable And Reusable Packaging Market Revenue (Million) Forecast, by Application 2019 & 2032
- Table 8: Canada Refillable And Reusable Packaging Market Revenue (Million) Forecast, by Application 2019 & 2032
- Table 9: Mexico Refillable And Reusable Packaging Market Revenue (Million) Forecast, by Application 2019 & 2032
- Table 10: Global Refillable And Reusable Packaging Market Revenue Million Forecast, by Country 2019 & 2032
- Table 11: Germany Refillable And Reusable Packaging Market Revenue (Million) Forecast, by Application 2019 & 2032
- Table 12: United Kingdom Refillable And Reusable Packaging Market Revenue (Million) Forecast, by Application 2019 & 2032
- Table 13: France Refillable And Reusable Packaging Market Revenue (Million) Forecast, by Application 2019 & 2032
- Table 14: Spain Refillable And Reusable Packaging Market Revenue (Million) Forecast, by Application 2019 & 2032
- Table 15: Italy Refillable And Reusable Packaging Market Revenue (Million) Forecast, by Application 2019 & 2032
- Table 16: Spain Refillable And Reusable Packaging Market Revenue (Million) Forecast, by Application 2019 & 2032
- Table 17: Belgium Refillable And Reusable Packaging Market Revenue (Million) Forecast, by Application 2019 & 2032
- Table 18: Netherland Refillable And Reusable Packaging Market Revenue (Million) Forecast, by Application 2019 & 2032
- Table 19: Nordics Refillable And Reusable Packaging Market Revenue (Million) Forecast, by Application 2019 & 2032
- Table 20: Rest of Europe Refillable And Reusable Packaging Market Revenue (Million) Forecast, by Application 2019 & 2032
- Table 21: Global Refillable And Reusable Packaging Market Revenue Million Forecast, by Country 2019 & 2032
- Table 22: China Refillable And Reusable Packaging Market Revenue (Million) Forecast, by Application 2019 & 2032
- Table 23: Japan Refillable And Reusable Packaging Market Revenue (Million) Forecast, by Application 2019 & 2032
- Table 24: India Refillable And Reusable Packaging Market Revenue (Million) Forecast, by Application 2019 & 2032
- Table 25: South Korea Refillable And Reusable Packaging Market Revenue (Million) Forecast, by Application 2019 & 2032
- Table 26: Southeast Asia Refillable And Reusable Packaging Market Revenue (Million) Forecast, by Application 2019 & 2032
- Table 27: Australia Refillable And Reusable Packaging Market Revenue (Million) Forecast, by Application 2019 & 2032
- Table 28: Indonesia Refillable And Reusable Packaging Market Revenue (Million) Forecast, by Application 2019 & 2032
- Table 29: Phillipes Refillable And Reusable Packaging Market Revenue (Million) Forecast, by Application 2019 & 2032
- Table 30: Singapore Refillable And Reusable Packaging Market Revenue (Million) Forecast, by Application 2019 & 2032
- Table 31: Thailandc Refillable And Reusable Packaging Market Revenue (Million) Forecast, by Application 2019 & 2032
- Table 32: Rest of Asia Pacific Refillable And Reusable Packaging Market Revenue (Million) Forecast, by Application 2019 & 2032
- Table 33: Global Refillable And Reusable Packaging Market Revenue Million Forecast, by Country 2019 & 2032
- Table 34: Brazil Refillable And Reusable Packaging Market Revenue (Million) Forecast, by Application 2019 & 2032
- Table 35: Argentina Refillable And Reusable Packaging Market Revenue (Million) Forecast, by Application 2019 & 2032
- Table 36: Peru Refillable And Reusable Packaging Market Revenue (Million) Forecast, by Application 2019 & 2032
- Table 37: Chile Refillable And Reusable Packaging Market Revenue (Million) Forecast, by Application 2019 & 2032
- Table 38: Colombia Refillable And Reusable Packaging Market Revenue (Million) Forecast, by Application 2019 & 2032
- Table 39: Ecuador Refillable And Reusable Packaging Market Revenue (Million) Forecast, by Application 2019 & 2032
- Table 40: Venezuela Refillable And Reusable Packaging Market Revenue (Million) Forecast, by Application 2019 & 2032
- Table 41: Rest of South America Refillable And Reusable Packaging Market Revenue (Million) Forecast, by Application 2019 & 2032
- Table 42: Global Refillable And Reusable Packaging Market Revenue Million Forecast, by Country 2019 & 2032
- Table 43: United States Refillable And Reusable Packaging Market Revenue (Million) Forecast, by Application 2019 & 2032
- Table 44: Canada Refillable And Reusable Packaging Market Revenue (Million) Forecast, by Application 2019 & 2032
- Table 45: Mexico Refillable And Reusable Packaging Market Revenue (Million) Forecast, by Application 2019 & 2032
- Table 46: Global Refillable And Reusable Packaging Market Revenue Million Forecast, by Country 2019 & 2032
- Table 47: United Arab Emirates Refillable And Reusable Packaging Market Revenue (Million) Forecast, by Application 2019 & 2032
- Table 48: Saudi Arabia Refillable And Reusable Packaging Market Revenue (Million) Forecast, by Application 2019 & 2032
- Table 49: South Africa Refillable And Reusable Packaging Market Revenue (Million) Forecast, by Application 2019 & 2032
- Table 50: Rest of Middle East and Africa Refillable And Reusable Packaging Market Revenue (Million) Forecast, by Application 2019 & 2032
- Table 51: Global Refillable And Reusable Packaging Market Revenue Million Forecast, by Material 2019 & 2032
- Table 52: Global Refillable And Reusable Packaging Market Revenue Million Forecast, by Product 2019 & 2032
- Table 53: Global Refillable And Reusable Packaging Market Revenue Million Forecast, by End-user Industry 2019 & 2032
- Table 54: Global Refillable And Reusable Packaging Market Revenue Million Forecast, by Country 2019 & 2032
- Table 55: Global Refillable And Reusable Packaging Market Revenue Million Forecast, by Material 2019 & 2032
- Table 56: Global Refillable And Reusable Packaging Market Revenue Million Forecast, by Product 2019 & 2032
- Table 57: Global Refillable And Reusable Packaging Market Revenue Million Forecast, by End-user Industry 2019 & 2032
- Table 58: Global Refillable And Reusable Packaging Market Revenue Million Forecast, by Country 2019 & 2032
- Table 59: Global Refillable And Reusable Packaging Market Revenue Million Forecast, by Material 2019 & 2032
- Table 60: Global Refillable And Reusable Packaging Market Revenue Million Forecast, by Product 2019 & 2032
- Table 61: Global Refillable And Reusable Packaging Market Revenue Million Forecast, by End-user Industry 2019 & 2032
- Table 62: Global Refillable And Reusable Packaging Market Revenue Million Forecast, by Country 2019 & 2032
- Table 63: Global Refillable And Reusable Packaging Market Revenue Million Forecast, by Material 2019 & 2032
- Table 64: Global Refillable And Reusable Packaging Market Revenue Million Forecast, by Product 2019 & 2032
- Table 65: Global Refillable And Reusable Packaging Market Revenue Million Forecast, by End-user Industry 2019 & 2032
- Table 66: Global Refillable And Reusable Packaging Market Revenue Million Forecast, by Country 2019 & 2032
- Table 67: Global Refillable And Reusable Packaging Market Revenue Million Forecast, by Material 2019 & 2032
- Table 68: Global Refillable And Reusable Packaging Market Revenue Million Forecast, by Product 2019 & 2032
- Table 69: Global Refillable And Reusable Packaging Market Revenue Million Forecast, by End-user Industry 2019 & 2032
- Table 70: Global Refillable And Reusable Packaging Market Revenue Million Forecast, by Country 2019 & 2032
Frequently Asked Questions
1. What is the projected Compound Annual Growth Rate (CAGR) of the Refillable And Reusable Packaging Market?
The projected CAGR is approximately 4.43%.
2. Which companies are prominent players in the Refillable And Reusable Packaging Market?
Key companies in the market include Nefab Group, Smurfit Kappa Group, Schoeller Allibert Services BV, Greif Inc, Amcor PLC, Mondi PLC, IPL Inc, IFCO Systems, Petainer Ltd, Bormioli Luigi Corporation, Vetropack Holding Ltd, Jiangmen UA Packaging Co Lt, GWP Group, Refillism, Berry Global Inc, Orbis Corporation, International Paper.
3. What are the main segments of the Refillable And Reusable Packaging Market?
The market segments include Material, Product, End-user Industry.
4. Can you provide details about the market size?
The market size is estimated to be USD 45.67 Million as of 2022.
5. What are some drivers contributing to market growth?
Rising Demand for Sustainable and Recyclable Refillable Packaging; Increasing Need for Smart and Trackable Reusable Packaging Solutions.
6. What are the notable trends driving market growth?
Pallets and Crates are Expected to Witness Growth.
7. Are there any restraints impacting market growth?
Supply Chain Disruptions and Regulatory Changes Might Limit the Market Growth.
8. Can you provide examples of recent developments in the market?
October 2023: Berry Global Inc. launched a 14-liter HDPE reusable container. The container plays a central role as the vessel for a new refill packaging solution from the Refill Coalition. The pilot for the solution was initiated at Aldi UK in its Solihull branch.
9. What pricing options are available for accessing the report?
Pricing options include single-user, multi-user, and enterprise licenses priced at USD 4750, USD 5250, and USD 8750 respectively.
10. Is the market size provided in terms of value or volume?
The market size is provided in terms of value, measured in Million.
11. Are there any specific market keywords associated with the report?
Yes, the market keyword associated with the report is "Refillable And Reusable Packaging Market," which aids in identifying and referencing the specific market segment covered.
12. How do I determine which pricing option suits my needs best?
The pricing options vary based on user requirements and access needs. Individual users may opt for single-user licenses, while businesses requiring broader access may choose multi-user or enterprise licenses for cost-effective access to the report.
13. Are there any additional resources or data provided in the Refillable And Reusable Packaging Market report?
While the report offers comprehensive insights, it's advisable to review the specific contents or supplementary materials provided to ascertain if additional resources or data are available.
14. How can I stay updated on further developments or reports in the Refillable And Reusable Packaging Market?
To stay informed about further developments, trends, and reports in the Refillable And Reusable Packaging Market, consider subscribing to industry newsletters, following relevant companies and organizations, or regularly checking reputable industry news sources and publications.
Methodology
Step 1 - Identification of Relevant Samples Size from Population Database


Step 2 - Approaches for Defining Global Market Size (Value, Volume* & Price*)

Note*: In applicable scenarios
Step 3 - Data Sources
Primary Research
- Web Analytics
- Survey Reports
- Research Institute
- Latest Research Reports
- Opinion Leaders
Secondary Research
- Annual Reports
- White Paper
- Latest Press Release
- Industry Association
- Paid Database
- Investor Presentations

Step 4 - Data Triangulation
Involves using different sources of information in order to increase the validity of a study
These sources are likely to be stakeholders in a program - participants, other researchers, program staff, other community members, and so on.
Then we put all data in single framework & apply various statistical tools to find out the dynamic on the market.
During the analysis stage, feedback from the stakeholder groups would be compared to determine areas of agreement as well as areas of divergence


