

Key Insights
The bioplastic packaging market is poised for substantial expansion, fueled by escalating consumer preference for sustainable alternatives to conventional petroleum-based plastics. Projections indicate a significant market trajectory, with an estimated Compound Annual Growth Rate (CAGR) of 17.2%. This growth is underpinned by stringent governmental mandates targeting plastic waste reduction, heightened ecological awareness among consumers, and the widespread integration of sustainable packaging across diverse industrial sectors. The market is segmented by material type (including PLA, PBAT, PHA, and bio-PET), product form (rigid and flexible packaging), and end-user industries such as food, beverages, and pharmaceuticals. Technological advancements and evolving consumer demands are expected to reshape the dominance of specific materials and packaging formats. Key opportunities lie in addressing current challenges, such as higher production costs and material property limitations, through continued research and development to enhance biodegradability, recyclability, and broaden application scope.
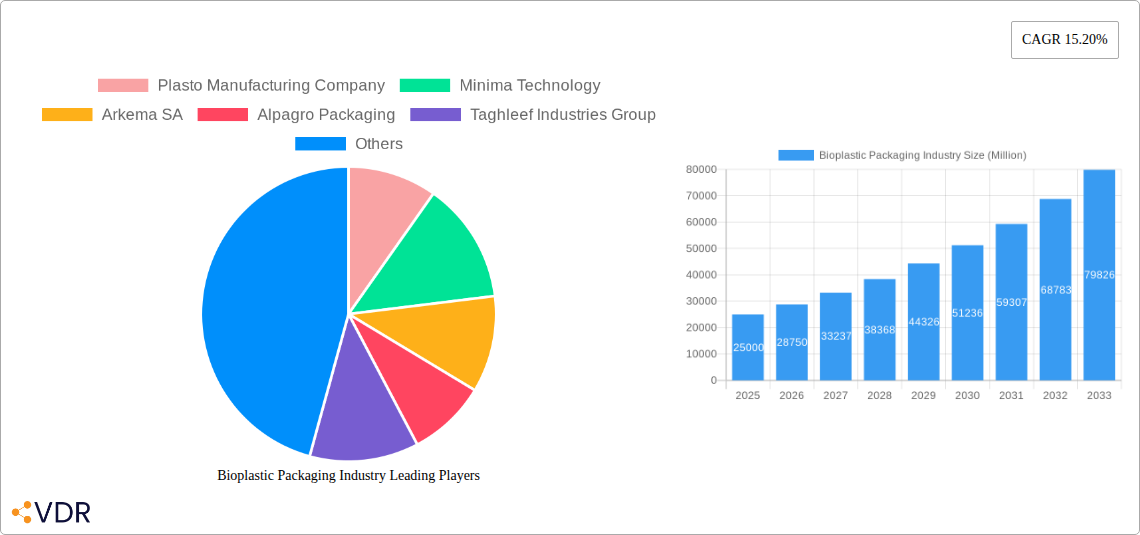
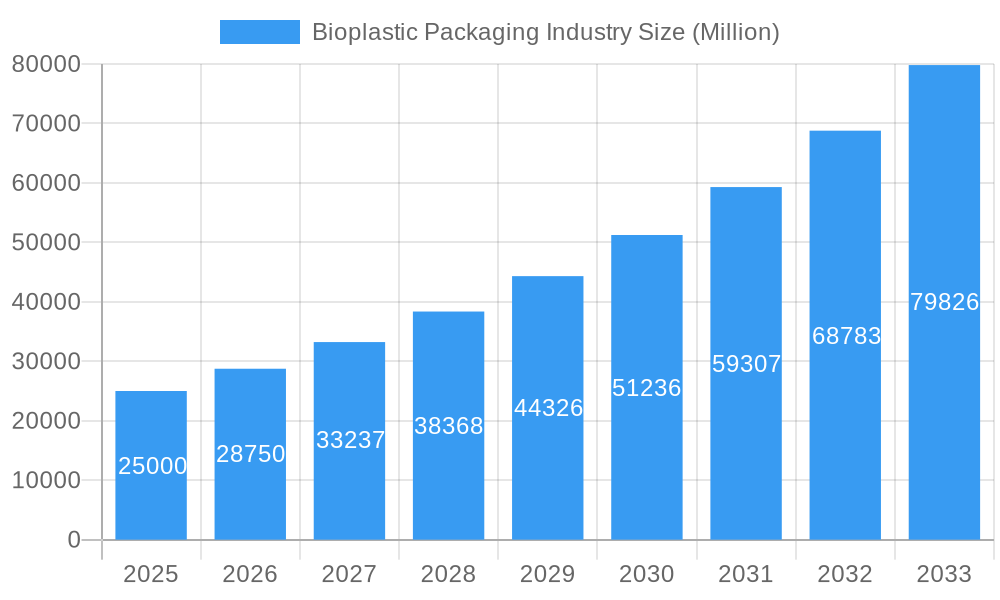
Bioplastic Packaging Industry Market Size (In Billion)
Leading market participants comprise a blend of established chemical corporations and specialized bioplastic producers, fostering a competitive environment characterized by both large-scale manufacturing capabilities and specialized niche players. North America and Europe currently demonstrate strong market presence, driven by robust environmental policies and consumer consciousness. However, the Asia-Pacific region is anticipated to experience accelerated growth, attributed to its expanding manufacturing infrastructure and increasing commitment to sustainable practices. Future market analysis forecasts continued expansion, with segment and regional growth rates contingent upon regulatory evolution, technological breakthroughs, and economic performance. Strategic success will hinge on the ability of market players to effectively harmonize innovation, sustainability, and cost-efficiency in their product portfolios.
Bioplastic Packaging Industry Company Market Share
Bioplastic Packaging Industry Market Report: 2019-2033
This comprehensive report provides a detailed analysis of the Bioplastic Packaging industry, encompassing market dynamics, growth trends, regional segmentation, product landscape, key players, and future outlook. The study period covers 2019-2033, with 2025 as the base and estimated year. The report leverages extensive primary and secondary research to deliver actionable insights for industry professionals, investors, and stakeholders. The market is segmented by material type (BIO-PET, BIO-PE, BIO-PA, PLA, PBAT, PHA, Starch Blends, and others), product type (rigid and flexible packaging), and end-user industry (food, beverage, pharmaceuticals, personal care, and others). The global bioplastic packaging market size is projected to reach xx Million by 2033.
Bioplastic Packaging Industry Market Dynamics & Structure
The bioplastic packaging market is characterized by moderate concentration, with several large multinational companies and numerous smaller specialized players. Technological innovation, driven by advancements in bio-based polymers and improved processing techniques, is a key driver. Stringent environmental regulations and growing consumer awareness of sustainability are also pushing market growth. Competitive substitutes include traditional petroleum-based plastics, posing a significant challenge. The market exhibits diverse end-user demographics, with the food and beverage sector leading demand. M&A activity is increasing, reflecting consolidation and expansion strategies among key players.
- Market Concentration: Moderately concentrated, with a few dominant players and many niche players.
- Technological Innovation: Focus on improving biodegradability, compostability, and performance characteristics of bioplastics.
- Regulatory Framework: Stringent regulations on plastic waste management are accelerating adoption.
- Competitive Substitutes: Traditional plastics remain a significant competitor due to lower costs.
- End-User Demographics: Food & beverage, pharmaceuticals, and personal care sectors are key drivers.
- M&A Trends: Increasing M&A activity reflecting consolidation and expansion strategies. xx deals recorded between 2019-2024. Market share of top 5 players: xx%.
Bioplastic Packaging Industry Growth Trends & Insights
The bioplastic packaging market has witnessed significant growth over the historical period (2019-2024), driven by increasing environmental concerns and regulatory pressures. The market is expected to continue its growth trajectory during the forecast period (2025-2033), exhibiting a Compound Annual Growth Rate (CAGR) of xx%. This growth is fueled by rising consumer demand for sustainable packaging solutions, technological advancements leading to improved bioplastic properties, and increasing government initiatives promoting the adoption of eco-friendly materials. Market penetration remains relatively low compared to traditional plastics, but it is rapidly increasing. Technological disruptions, such as the development of innovative bio-based polymers with enhanced performance characteristics, are further driving market expansion. Shifting consumer preferences towards sustainable and ethical products are also significant factors influencing market growth.
Dominant Regions, Countries, or Segments in Bioplastic Packaging Industry
North America and Europe currently dominate the bioplastic packaging market, driven by strong environmental regulations, high consumer awareness, and significant investments in research and development. However, Asia-Pacific is expected to experience the fastest growth during the forecast period due to rapid economic development, increasing disposable incomes, and expanding food and beverage sectors.
By Material Type: PLA and PBAT currently hold significant market shares, while PHA is emerging as a promising segment due to its superior biodegradability.
By Product Type: Flexible packaging currently holds a larger market share than rigid packaging due to its widespread use in various applications.
By End-user Industry: The food and beverage industry is the largest end-user segment, followed by pharmaceuticals and personal care.
- Key Drivers (North America & Europe): Stringent environmental regulations, high consumer awareness of sustainability, substantial R&D investment.
- Key Drivers (Asia-Pacific): Rapid economic growth, rising disposable incomes, expanding food and beverage sector.
- Market Share: North America (xx%), Europe (xx%), Asia-Pacific (xx%), Rest of the World (xx%). Growth potential is highest in Asia-Pacific.
Bioplastic Packaging Industry Product Landscape
The bioplastic packaging market offers a diverse range of products, including bottles, trays, films, pouches, and labels made from various bio-based polymers. Recent innovations focus on improving biodegradability, compostability, barrier properties, and overall performance to match or exceed traditional plastics. Unique selling propositions often center around environmental benefits, such as reduced carbon footprint and compostability. Technological advancements include the development of new bio-based polymers with enhanced properties and improved processing technologies to facilitate wider adoption.
Key Drivers, Barriers & Challenges in Bioplastic Packaging Industry
Key Drivers:
- Increasing environmental concerns and regulations globally.
- Growing consumer preference for sustainable and eco-friendly packaging.
- Technological advancements leading to improved bioplastic properties and cost reduction.
- Government incentives and support for the bioplastic industry.
Challenges & Restraints:
- Higher production costs compared to traditional plastics, limiting wider adoption.
- Limited availability of suitable composting infrastructure, hindering complete biodegradability.
- Performance limitations of some bioplastics compared to conventional plastics in certain applications.
- Complex supply chains and fluctuating raw material prices. xx% increase in raw material cost between 2022-2023 impacting profitability.
Emerging Opportunities in Bioplastic Packaging Industry
- Expanding into untapped markets in developing economies.
- Development of new bio-based polymers with superior performance characteristics.
- Innovation in packaging designs to enhance functionality and sustainability.
- Leveraging advancements in bio-based inks and coatings to improve print quality and shelf life.
Growth Accelerators in the Bioplastic Packaging Industry
Technological breakthroughs in biopolymer production are driving cost reductions and improving material properties, accelerating market adoption. Strategic partnerships between bioplastic producers and packaging companies are fostering innovation and expanding market reach. Expansion into new applications and markets, particularly in emerging economies, presents significant growth opportunities.
Key Players Shaping the Bioplastic Packaging Industry Market
- Plasto Manufacturing Company
- Minima Technology
- Arkema SA
- Alpagro Packaging
- Taghleef Industries Group
- BASF SE
- Plastic Suppliers Inc
- Mondi PLC
- Mitsubishi Chemicals Corporation
- Element Packaging Ltd
- Eastman Chemical Company
- Treemera GmbH
- Tipa-corp Ltd
- FKuR Ploymers GmbH
- COMPOSTPACK SAS
- Biogreen Packaging Pvt Ltd
- Tetra Pak International SA
- Biome Bioplastics Limited
- Amcor Limited
- Raepak Ltd
- (List Not Exhaustive)
Notable Milestones in Bioplastic Packaging Industry Sector
- August 2022: LG Chem Ltd. and Archer Daniels Midland Co. (ADM) partnered to build two biodegradable plastic manufacturing plants in Illinois, US, focusing on food packaging applications.
- January 2022: Vikas Ecotech Limited announced plans to invest in PHA bioplastic technology through a potential joint venture with Aurapha Private Ltd.
In-Depth Bioplastic Packaging Industry Market Outlook
The bioplastic packaging market is poised for substantial growth over the next decade, driven by increasing environmental regulations, rising consumer demand for sustainable products, and continuous technological advancements. Strategic partnerships and investments in research and development will further accelerate market expansion. Opportunities exist in developing novel bio-based polymers, expanding into new applications, and penetrating untapped markets globally. The market's future success hinges on addressing challenges related to cost competitiveness and scalability while fostering a robust and efficient supply chain.
Bioplastic Packaging Industry Segmentation
-
1. Material Type
- 1.1. BIO - PET
- 1.2. BIO - PE
- 1.3. BIO - PA
- 1.4. Other Bio-Based/Non-Biodegradable Materials
- 1.5. Starch Blends
- 1.6. PLA
- 1.7. PBAT
- 1.8. PHA
- 1.9. Other Biodegradable Materials
-
2. Product Type
- 2.1. Rigid Pl
- 2.2. Flexible
-
3. End-user Industries
- 3.1. Food
- 3.2. Beverage
- 3.3. Pharmaceuticals
- 3.4. Personal Care & Household Care
- 3.5. Other End-user Applications
Bioplastic Packaging Industry Segmentation By Geography
- 1. North America
- 2. Europe
- 3. Asia Pacific
- 4. Latin America
- 5. Middle East and Africa
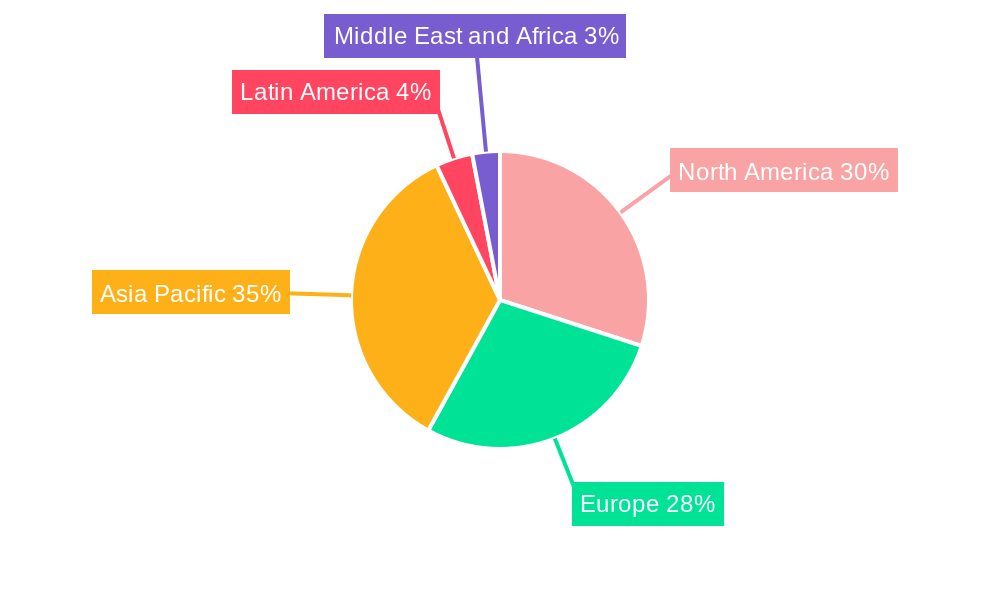
Bioplastic Packaging Industry Regional Market Share
Geographic Coverage of Bioplastic Packaging Industry
Bioplastic Packaging Industry REPORT HIGHLIGHTS
| Aspects | Details |
|---|---|
| Study Period | 2020-2034 |
| Base Year | 2025 |
| Estimated Year | 2026 |
| Forecast Period | 2026-2034 |
| Historical Period | 2020-2025 |
| Growth Rate | CAGR of 17.2% from 2020-2034 |
| Segmentation |
|
Table of Contents
- 1. Introduction
- 1.1. Research Scope
- 1.2. Market Segmentation
- 1.3. Research Objective
- 1.4. Definitions and Assumptions
- 2. Executive Summary
- 2.1. Market Snapshot
- 3. Market Dynamics
- 3.1. Market Drivers
- 3.2. Market Restrains
- 3.3. Market Trends
- 3.4. Market Opportunities
- 4. Market Factor Analysis
- 4.1. Porters Five Forces
- 4.1.1. Bargaining Power of Suppliers
- 4.1.2. Bargaining Power of Buyers
- 4.1.3. Threat of New Entrants
- 4.1.4. Threat of Substitutes
- 4.1.5. Competitive Rivalry
- 4.2. PESTEL analysis
- 4.3. BCG Analysis
- 4.3.1. Stars (High Growth, High Market Share)
- 4.3.2. Cash Cows (Low Growth, High Market Share)
- 4.3.3. Question Mark (High Growth, Low Market Share)
- 4.3.4. Dogs (Low Growth, Low Market Share)
- 4.4. Ansoff Matrix Analysis
- 4.5. Supply Chain Analysis
- 4.6. Regulatory Landscape
- 4.7. Current Market Potential and Opportunity Assessment (TAM–SAM–SOM Framework)
- 4.8. VDR Analyst Note
- 4.1. Porters Five Forces
- 5. Market Analysis, Insights and Forecast 2021-2033
- 5.1. Market Analysis, Insights and Forecast - by Material Type
- 5.1.1. BIO - PET
- 5.1.2. BIO - PE
- 5.1.3. BIO - PA
- 5.1.4. Other Bio-Based/Non-Biodegradable Materials
- 5.1.5. Starch Blends
- 5.1.6. PLA
- 5.1.7. PBAT
- 5.1.8. PHA
- 5.1.9. Other Biodegradable Materials
- 5.2. Market Analysis, Insights and Forecast - by Product Type
- 5.2.1. Rigid Pl
- 5.2.2. Flexible
- 5.3. Market Analysis, Insights and Forecast - by End-user Industries
- 5.3.1. Food
- 5.3.2. Beverage
- 5.3.3. Pharmaceuticals
- 5.3.4. Personal Care & Household Care
- 5.3.5. Other End-user Applications
- 5.4. Market Analysis, Insights and Forecast - by Region
- 5.4.1. North America
- 5.4.2. Europe
- 5.4.3. Asia Pacific
- 5.4.4. Latin America
- 5.4.5. Middle East and Africa
- 5.1. Market Analysis, Insights and Forecast - by Material Type
- 6. Global Bioplastic Packaging Industry Analysis, Insights and Forecast, 2021-2033
- 6.1. Market Analysis, Insights and Forecast - by Material Type
- 6.1.1. BIO - PET
- 6.1.2. BIO - PE
- 6.1.3. BIO - PA
- 6.1.4. Other Bio-Based/Non-Biodegradable Materials
- 6.1.5. Starch Blends
- 6.1.6. PLA
- 6.1.7. PBAT
- 6.1.8. PHA
- 6.1.9. Other Biodegradable Materials
- 6.2. Market Analysis, Insights and Forecast - by Product Type
- 6.2.1. Rigid Pl
- 6.2.2. Flexible
- 6.3. Market Analysis, Insights and Forecast - by End-user Industries
- 6.3.1. Food
- 6.3.2. Beverage
- 6.3.3. Pharmaceuticals
- 6.3.4. Personal Care & Household Care
- 6.3.5. Other End-user Applications
- 6.1. Market Analysis, Insights and Forecast - by Material Type
- 7. North America Bioplastic Packaging Industry Analysis, Insights and Forecast, 2021-2033
- 7.1. Market Analysis, Insights and Forecast - by Material Type
- 7.1.1. BIO - PET
- 7.1.2. BIO - PE
- 7.1.3. BIO - PA
- 7.1.4. Other Bio-Based/Non-Biodegradable Materials
- 7.1.5. Starch Blends
- 7.1.6. PLA
- 7.1.7. PBAT
- 7.1.8. PHA
- 7.1.9. Other Biodegradable Materials
- 7.2. Market Analysis, Insights and Forecast - by Product Type
- 7.2.1. Rigid Pl
- 7.2.2. Flexible
- 7.3. Market Analysis, Insights and Forecast - by End-user Industries
- 7.3.1. Food
- 7.3.2. Beverage
- 7.3.3. Pharmaceuticals
- 7.3.4. Personal Care & Household Care
- 7.3.5. Other End-user Applications
- 7.1. Market Analysis, Insights and Forecast - by Material Type
- 8. Europe Bioplastic Packaging Industry Analysis, Insights and Forecast, 2021-2033
- 8.1. Market Analysis, Insights and Forecast - by Material Type
- 8.1.1. BIO - PET
- 8.1.2. BIO - PE
- 8.1.3. BIO - PA
- 8.1.4. Other Bio-Based/Non-Biodegradable Materials
- 8.1.5. Starch Blends
- 8.1.6. PLA
- 8.1.7. PBAT
- 8.1.8. PHA
- 8.1.9. Other Biodegradable Materials
- 8.2. Market Analysis, Insights and Forecast - by Product Type
- 8.2.1. Rigid Pl
- 8.2.2. Flexible
- 8.3. Market Analysis, Insights and Forecast - by End-user Industries
- 8.3.1. Food
- 8.3.2. Beverage
- 8.3.3. Pharmaceuticals
- 8.3.4. Personal Care & Household Care
- 8.3.5. Other End-user Applications
- 8.1. Market Analysis, Insights and Forecast - by Material Type
- 9. Asia Pacific Bioplastic Packaging Industry Analysis, Insights and Forecast, 2021-2033
- 9.1. Market Analysis, Insights and Forecast - by Material Type
- 9.1.1. BIO - PET
- 9.1.2. BIO - PE
- 9.1.3. BIO - PA
- 9.1.4. Other Bio-Based/Non-Biodegradable Materials
- 9.1.5. Starch Blends
- 9.1.6. PLA
- 9.1.7. PBAT
- 9.1.8. PHA
- 9.1.9. Other Biodegradable Materials
- 9.2. Market Analysis, Insights and Forecast - by Product Type
- 9.2.1. Rigid Pl
- 9.2.2. Flexible
- 9.3. Market Analysis, Insights and Forecast - by End-user Industries
- 9.3.1. Food
- 9.3.2. Beverage
- 9.3.3. Pharmaceuticals
- 9.3.4. Personal Care & Household Care
- 9.3.5. Other End-user Applications
- 9.1. Market Analysis, Insights and Forecast - by Material Type
- 10. Latin America Bioplastic Packaging Industry Analysis, Insights and Forecast, 2021-2033
- 10.1. Market Analysis, Insights and Forecast - by Material Type
- 10.1.1. BIO - PET
- 10.1.2. BIO - PE
- 10.1.3. BIO - PA
- 10.1.4. Other Bio-Based/Non-Biodegradable Materials
- 10.1.5. Starch Blends
- 10.1.6. PLA
- 10.1.7. PBAT
- 10.1.8. PHA
- 10.1.9. Other Biodegradable Materials
- 10.2. Market Analysis, Insights and Forecast - by Product Type
- 10.2.1. Rigid Pl
- 10.2.2. Flexible
- 10.3. Market Analysis, Insights and Forecast - by End-user Industries
- 10.3.1. Food
- 10.3.2. Beverage
- 10.3.3. Pharmaceuticals
- 10.3.4. Personal Care & Household Care
- 10.3.5. Other End-user Applications
- 10.1. Market Analysis, Insights and Forecast - by Material Type
- 11. Middle East and Africa Bioplastic Packaging Industry Analysis, Insights and Forecast, 2021-2033
- 11.1. Market Analysis, Insights and Forecast - by Material Type
- 11.1.1. BIO - PET
- 11.1.2. BIO - PE
- 11.1.3. BIO - PA
- 11.1.4. Other Bio-Based/Non-Biodegradable Materials
- 11.1.5. Starch Blends
- 11.1.6. PLA
- 11.1.7. PBAT
- 11.1.8. PHA
- 11.1.9. Other Biodegradable Materials
- 11.2. Market Analysis, Insights and Forecast - by Product Type
- 11.2.1. Rigid Pl
- 11.2.2. Flexible
- 11.3. Market Analysis, Insights and Forecast - by End-user Industries
- 11.3.1. Food
- 11.3.2. Beverage
- 11.3.3. Pharmaceuticals
- 11.3.4. Personal Care & Household Care
- 11.3.5. Other End-user Applications
- 11.1. Market Analysis, Insights and Forecast - by Material Type
- 12. Competitive Analysis
- 12.1. Company Profiles
- 12.1.1 Plasto Manufacturing Company
- 12.1.1.1. Company Overview
- 12.1.1.2. Products
- 12.1.1.3. Company Financials
- 12.1.1.4. SWOT Analysis
- 12.1.2 Minima Technology
- 12.1.2.1. Company Overview
- 12.1.2.2. Products
- 12.1.2.3. Company Financials
- 12.1.2.4. SWOT Analysis
- 12.1.3 Arkema SA
- 12.1.3.1. Company Overview
- 12.1.3.2. Products
- 12.1.3.3. Company Financials
- 12.1.3.4. SWOT Analysis
- 12.1.4 Alpagro Packaging
- 12.1.4.1. Company Overview
- 12.1.4.2. Products
- 12.1.4.3. Company Financials
- 12.1.4.4. SWOT Analysis
- 12.1.5 Taghleef Industries Group
- 12.1.5.1. Company Overview
- 12.1.5.2. Products
- 12.1.5.3. Company Financials
- 12.1.5.4. SWOT Analysis
- 12.1.6 BASF SE
- 12.1.6.1. Company Overview
- 12.1.6.2. Products
- 12.1.6.3. Company Financials
- 12.1.6.4. SWOT Analysis
- 12.1.7 Plastic Suppliers Inc
- 12.1.7.1. Company Overview
- 12.1.7.2. Products
- 12.1.7.3. Company Financials
- 12.1.7.4. SWOT Analysis
- 12.1.8 Mondi PLC
- 12.1.8.1. Company Overview
- 12.1.8.2. Products
- 12.1.8.3. Company Financials
- 12.1.8.4. SWOT Analysis
- 12.1.9 Mitsubishi Chemicals Corporation
- 12.1.9.1. Company Overview
- 12.1.9.2. Products
- 12.1.9.3. Company Financials
- 12.1.9.4. SWOT Analysis
- 12.1.10 Element Packaging Ltd
- 12.1.10.1. Company Overview
- 12.1.10.2. Products
- 12.1.10.3. Company Financials
- 12.1.10.4. SWOT Analysis
- 12.1.11 Eastman Chemical Company
- 12.1.11.1. Company Overview
- 12.1.11.2. Products
- 12.1.11.3. Company Financials
- 12.1.11.4. SWOT Analysis
- 12.1.12 Treemera GmbH
- 12.1.12.1. Company Overview
- 12.1.12.2. Products
- 12.1.12.3. Company Financials
- 12.1.12.4. SWOT Analysis
- 12.1.13 Tipa-corp Ltd
- 12.1.13.1. Company Overview
- 12.1.13.2. Products
- 12.1.13.3. Company Financials
- 12.1.13.4. SWOT Analysis
- 12.1.14 FKuR Ploymers GmbH
- 12.1.14.1. Company Overview
- 12.1.14.2. Products
- 12.1.14.3. Company Financials
- 12.1.14.4. SWOT Analysis
- 12.1.15 COMPOSTPACK SAS
- 12.1.15.1. Company Overview
- 12.1.15.2. Products
- 12.1.15.3. Company Financials
- 12.1.15.4. SWOT Analysis
- 12.1.16 Biogreen Packaging Pvt Ltd
- 12.1.16.1. Company Overview
- 12.1.16.2. Products
- 12.1.16.3. Company Financials
- 12.1.16.4. SWOT Analysis
- 12.1.17 Tetra Pak International SA*List Not Exhaustive
- 12.1.17.1. Company Overview
- 12.1.17.2. Products
- 12.1.17.3. Company Financials
- 12.1.17.4. SWOT Analysis
- 12.1.18 Biome Bioplastics Limited
- 12.1.18.1. Company Overview
- 12.1.18.2. Products
- 12.1.18.3. Company Financials
- 12.1.18.4. SWOT Analysis
- 12.1.19 Amcor Limited
- 12.1.19.1. Company Overview
- 12.1.19.2. Products
- 12.1.19.3. Company Financials
- 12.1.19.4. SWOT Analysis
- 12.1.20 Raepak Ltd
- 12.1.20.1. Company Overview
- 12.1.20.2. Products
- 12.1.20.3. Company Financials
- 12.1.20.4. SWOT Analysis
- 12.1.1 Plasto Manufacturing Company
- 12.2. Market Entropy
- 12.2.1 Company's Key Areas Served
- 12.2.2 Recent Developments
- 12.3. Company Market Share Analysis 2025
- 12.3.1 Top 5 Companies Market Share Analysis
- 12.3.2 Top 3 Companies Market Share Analysis
- 12.4. List of Potential Customers
- 13. Research Methodology
List of Figures
- Figure 1: Global Bioplastic Packaging Industry Revenue Breakdown (billion, %) by Region 2025 & 2033
- Figure 2: North America Bioplastic Packaging Industry Revenue (billion), by Material Type 2025 & 2033
- Figure 3: North America Bioplastic Packaging Industry Revenue Share (%), by Material Type 2025 & 2033
- Figure 4: North America Bioplastic Packaging Industry Revenue (billion), by Product Type 2025 & 2033
- Figure 5: North America Bioplastic Packaging Industry Revenue Share (%), by Product Type 2025 & 2033
- Figure 6: North America Bioplastic Packaging Industry Revenue (billion), by End-user Industries 2025 & 2033
- Figure 7: North America Bioplastic Packaging Industry Revenue Share (%), by End-user Industries 2025 & 2033
- Figure 8: North America Bioplastic Packaging Industry Revenue (billion), by Country 2025 & 2033
- Figure 9: North America Bioplastic Packaging Industry Revenue Share (%), by Country 2025 & 2033
- Figure 10: Europe Bioplastic Packaging Industry Revenue (billion), by Material Type 2025 & 2033
- Figure 11: Europe Bioplastic Packaging Industry Revenue Share (%), by Material Type 2025 & 2033
- Figure 12: Europe Bioplastic Packaging Industry Revenue (billion), by Product Type 2025 & 2033
- Figure 13: Europe Bioplastic Packaging Industry Revenue Share (%), by Product Type 2025 & 2033
- Figure 14: Europe Bioplastic Packaging Industry Revenue (billion), by End-user Industries 2025 & 2033
- Figure 15: Europe Bioplastic Packaging Industry Revenue Share (%), by End-user Industries 2025 & 2033
- Figure 16: Europe Bioplastic Packaging Industry Revenue (billion), by Country 2025 & 2033
- Figure 17: Europe Bioplastic Packaging Industry Revenue Share (%), by Country 2025 & 2033
- Figure 18: Asia Pacific Bioplastic Packaging Industry Revenue (billion), by Material Type 2025 & 2033
- Figure 19: Asia Pacific Bioplastic Packaging Industry Revenue Share (%), by Material Type 2025 & 2033
- Figure 20: Asia Pacific Bioplastic Packaging Industry Revenue (billion), by Product Type 2025 & 2033
- Figure 21: Asia Pacific Bioplastic Packaging Industry Revenue Share (%), by Product Type 2025 & 2033
- Figure 22: Asia Pacific Bioplastic Packaging Industry Revenue (billion), by End-user Industries 2025 & 2033
- Figure 23: Asia Pacific Bioplastic Packaging Industry Revenue Share (%), by End-user Industries 2025 & 2033
- Figure 24: Asia Pacific Bioplastic Packaging Industry Revenue (billion), by Country 2025 & 2033
- Figure 25: Asia Pacific Bioplastic Packaging Industry Revenue Share (%), by Country 2025 & 2033
- Figure 26: Latin America Bioplastic Packaging Industry Revenue (billion), by Material Type 2025 & 2033
- Figure 27: Latin America Bioplastic Packaging Industry Revenue Share (%), by Material Type 2025 & 2033
- Figure 28: Latin America Bioplastic Packaging Industry Revenue (billion), by Product Type 2025 & 2033
- Figure 29: Latin America Bioplastic Packaging Industry Revenue Share (%), by Product Type 2025 & 2033
- Figure 30: Latin America Bioplastic Packaging Industry Revenue (billion), by End-user Industries 2025 & 2033
- Figure 31: Latin America Bioplastic Packaging Industry Revenue Share (%), by End-user Industries 2025 & 2033
- Figure 32: Latin America Bioplastic Packaging Industry Revenue (billion), by Country 2025 & 2033
- Figure 33: Latin America Bioplastic Packaging Industry Revenue Share (%), by Country 2025 & 2033
- Figure 34: Middle East and Africa Bioplastic Packaging Industry Revenue (billion), by Material Type 2025 & 2033
- Figure 35: Middle East and Africa Bioplastic Packaging Industry Revenue Share (%), by Material Type 2025 & 2033
- Figure 36: Middle East and Africa Bioplastic Packaging Industry Revenue (billion), by Product Type 2025 & 2033
- Figure 37: Middle East and Africa Bioplastic Packaging Industry Revenue Share (%), by Product Type 2025 & 2033
- Figure 38: Middle East and Africa Bioplastic Packaging Industry Revenue (billion), by End-user Industries 2025 & 2033
- Figure 39: Middle East and Africa Bioplastic Packaging Industry Revenue Share (%), by End-user Industries 2025 & 2033
- Figure 40: Middle East and Africa Bioplastic Packaging Industry Revenue (billion), by Country 2025 & 2033
- Figure 41: Middle East and Africa Bioplastic Packaging Industry Revenue Share (%), by Country 2025 & 2033
List of Tables
- Table 1: Global Bioplastic Packaging Industry Revenue billion Forecast, by Material Type 2020 & 2033
- Table 2: Global Bioplastic Packaging Industry Revenue billion Forecast, by Product Type 2020 & 2033
- Table 3: Global Bioplastic Packaging Industry Revenue billion Forecast, by End-user Industries 2020 & 2033
- Table 4: Global Bioplastic Packaging Industry Revenue billion Forecast, by Region 2020 & 2033
- Table 5: Global Bioplastic Packaging Industry Revenue billion Forecast, by Material Type 2020 & 2033
- Table 6: Global Bioplastic Packaging Industry Revenue billion Forecast, by Product Type 2020 & 2033
- Table 7: Global Bioplastic Packaging Industry Revenue billion Forecast, by End-user Industries 2020 & 2033
- Table 8: Global Bioplastic Packaging Industry Revenue billion Forecast, by Country 2020 & 2033
- Table 9: Global Bioplastic Packaging Industry Revenue billion Forecast, by Material Type 2020 & 2033
- Table 10: Global Bioplastic Packaging Industry Revenue billion Forecast, by Product Type 2020 & 2033
- Table 11: Global Bioplastic Packaging Industry Revenue billion Forecast, by End-user Industries 2020 & 2033
- Table 12: Global Bioplastic Packaging Industry Revenue billion Forecast, by Country 2020 & 2033
- Table 13: Global Bioplastic Packaging Industry Revenue billion Forecast, by Material Type 2020 & 2033
- Table 14: Global Bioplastic Packaging Industry Revenue billion Forecast, by Product Type 2020 & 2033
- Table 15: Global Bioplastic Packaging Industry Revenue billion Forecast, by End-user Industries 2020 & 2033
- Table 16: Global Bioplastic Packaging Industry Revenue billion Forecast, by Country 2020 & 2033
- Table 17: Global Bioplastic Packaging Industry Revenue billion Forecast, by Material Type 2020 & 2033
- Table 18: Global Bioplastic Packaging Industry Revenue billion Forecast, by Product Type 2020 & 2033
- Table 19: Global Bioplastic Packaging Industry Revenue billion Forecast, by End-user Industries 2020 & 2033
- Table 20: Global Bioplastic Packaging Industry Revenue billion Forecast, by Country 2020 & 2033
- Table 21: Global Bioplastic Packaging Industry Revenue billion Forecast, by Material Type 2020 & 2033
- Table 22: Global Bioplastic Packaging Industry Revenue billion Forecast, by Product Type 2020 & 2033
- Table 23: Global Bioplastic Packaging Industry Revenue billion Forecast, by End-user Industries 2020 & 2033
- Table 24: Global Bioplastic Packaging Industry Revenue billion Forecast, by Country 2020 & 2033
Frequently Asked Questions
1. What is the projected Compound Annual Growth Rate (CAGR) of the Bioplastic Packaging Industry?
The projected CAGR is approximately 17.2%.
2. Which companies are prominent players in the Bioplastic Packaging Industry?
Key companies in the market include Plasto Manufacturing Company, Minima Technology, Arkema SA, Alpagro Packaging, Taghleef Industries Group, BASF SE, Plastic Suppliers Inc, Mondi PLC, Mitsubishi Chemicals Corporation, Element Packaging Ltd, Eastman Chemical Company, Treemera GmbH, Tipa-corp Ltd, FKuR Ploymers GmbH, COMPOSTPACK SAS, Biogreen Packaging Pvt Ltd, Tetra Pak International SA*List Not Exhaustive, Biome Bioplastics Limited, Amcor Limited, Raepak Ltd.
3. What are the main segments of the Bioplastic Packaging Industry?
The market segments include Material Type, Product Type, End-user Industries.
4. Can you provide details about the market size?
The market size is estimated to be USD 24.71 billion as of 2022.
5. What are some drivers contributing to market growth?
Stringent Government Regulations against the Use of Conventional Plastics; Increased Usage of Green Products. Sustainability. and Inclination toward Environment Protection.
6. What are the notable trends driving market growth?
Rigid Packaging to Hold Dominant Position in the Market.
7. Are there any restraints impacting market growth?
Fluctuations in the Price of Raw Materials.
8. Can you provide examples of recent developments in the market?
August 2022: LG Chem Ltd., the largest Korean chemical firm, announced a partnership with the US-based food processing organization Archer Daniels Midland Co. (ADM) to build two manufacturing plants in Illinois, US. The production facilities will be manufacturing biodegradable plastics that are extensively used in food packaging applications.
9. What pricing options are available for accessing the report?
Pricing options include single-user, multi-user, and enterprise licenses priced at USD 4750, USD 5250, and USD 8750 respectively.
10. Is the market size provided in terms of value or volume?
The market size is provided in terms of value, measured in billion.
11. Are there any specific market keywords associated with the report?
Yes, the market keyword associated with the report is "Bioplastic Packaging Industry," which aids in identifying and referencing the specific market segment covered.
12. How do I determine which pricing option suits my needs best?
The pricing options vary based on user requirements and access needs. Individual users may opt for single-user licenses, while businesses requiring broader access may choose multi-user or enterprise licenses for cost-effective access to the report.
13. Are there any additional resources or data provided in the Bioplastic Packaging Industry report?
While the report offers comprehensive insights, it's advisable to review the specific contents or supplementary materials provided to ascertain if additional resources or data are available.
14. How can I stay updated on further developments or reports in the Bioplastic Packaging Industry?
To stay informed about further developments, trends, and reports in the Bioplastic Packaging Industry, consider subscribing to industry newsletters, following relevant companies and organizations, or regularly checking reputable industry news sources and publications.
Methodology
Step 1 - Identification of Relevant Samples Size from Population Database


Step 2 - Approaches for Defining Global Market Size (Value, Volume* & Price*)

Note*: In applicable scenarios
Step 3 - Data Sources
Primary Research
- Web Analytics
- Survey Reports
- Research Institute
- Latest Research Reports
- Opinion Leaders
Secondary Research
- Annual Reports
- White Paper
- Latest Press Release
- Industry Association
- Paid Database
- Investor Presentations

Step 4 - Data Triangulation
Involves using different sources of information in order to increase the validity of a study
These sources are likely to be stakeholders in a program - participants, other researchers, program staff, other community members, and so on.
Then we put all data in single framework & apply various statistical tools to find out the dynamic on the market.
During the analysis stage, feedback from the stakeholder groups would be compared to determine areas of agreement as well as areas of divergence