

Key Insights
The European soft drinks packaging market, valued at approximately €44.3 billion in 2025, is projected for substantial expansion. Driven by escalating soft drink consumption and shifting consumer preferences, the market is anticipated to achieve a compound annual growth rate (CAGR) of 12.6%. This robust growth trajectory suggests a significant market evolution, reaching an estimated value by 2033. Key expansion drivers include the increasing demand for convenient, portable packaging solutions, particularly in plastic bottles and cans. Furthermore, growing environmental consciousness is significantly shaping market trends, with a pronounced focus on lightweighting, the utilization of recyclable materials such as rPET, and the adoption of biodegradable alternatives. While plastics maintain their prevalence, a discernible shift towards sustainable packaging solutions is evident, presenting both avenues for innovation and strategic challenges for manufacturers.
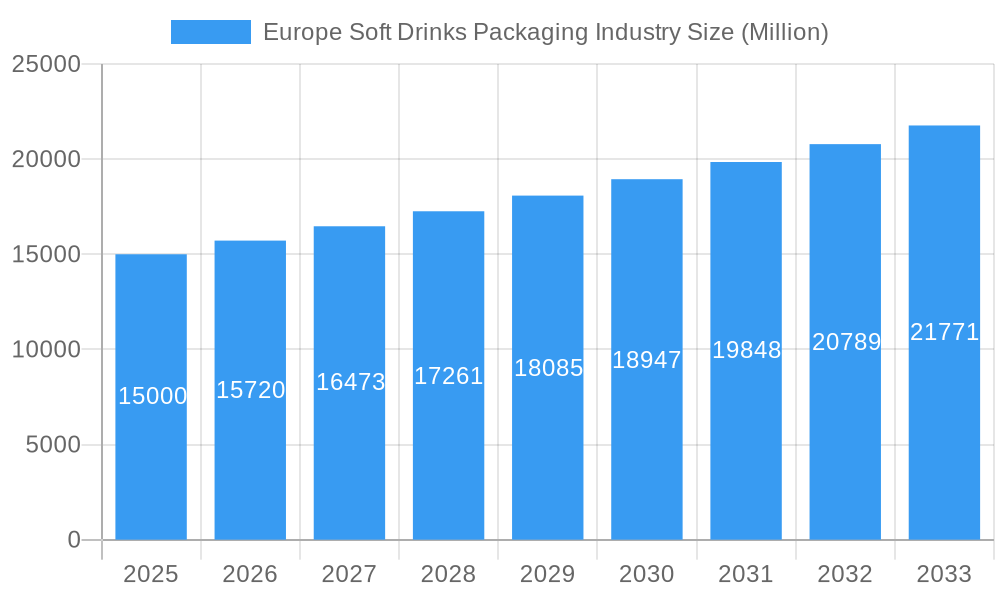
Europe Soft Drinks Packaging Industry Market Size (In Billion)
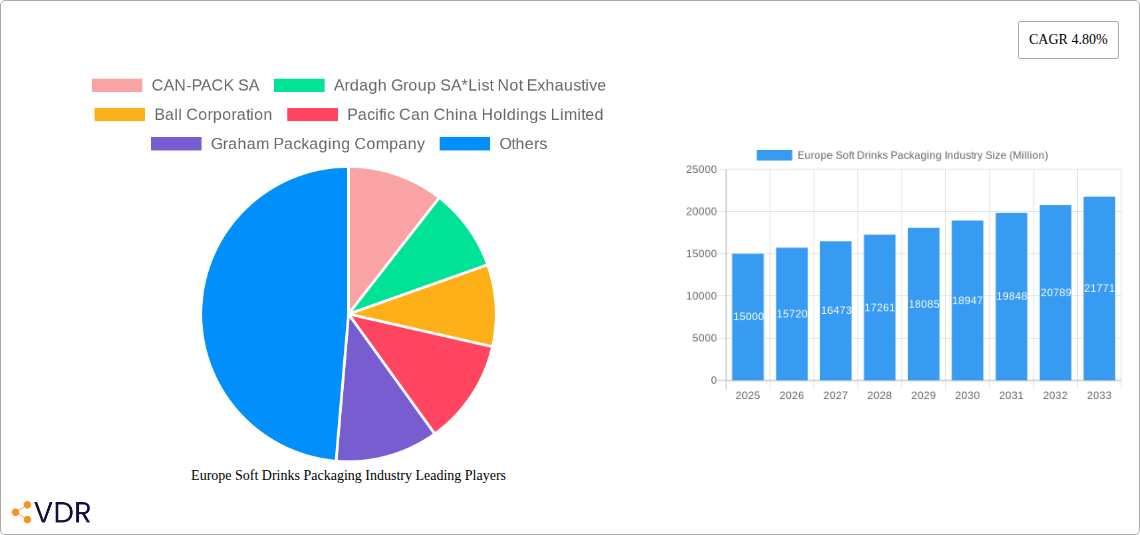
Market segmentation highlights a varied landscape, with plastic bottles leading in product type, closely followed by cans. Nevertheless, escalating regulatory demands and heightened consumer awareness are propelling the integration of glass and paper-based alternatives, notably cartons for aseptic packaging. Germany, France, and the United Kingdom represent prominent market segments within Europe, reflecting their established soft drink sectors and robust consumer expenditure. Competitive pressures remain intense, with leading global entities such as CAN-PACK SA, Ardagh Group, and Ball Corporation engaging with regional and niche packaging providers.
Europe Soft Drinks Packaging Industry Company Market Share
Continued market growth will be influenced by several critical factors. Innovations in packaging materials, including bio-based plastics and advanced recycling technologies, will be instrumental. Stringent environmental regulations across Europe are expected to further accelerate the adoption of sustainable packaging. The ongoing diversification of soft drink product portfolios, encompassing functional and health-conscious beverages, will also impact packaging selection. This intricate convergence of consumer demand, regulatory imperatives, and technological advancements ensures the European soft drinks packaging market remains a dynamic and evolving arena, offering continuous opportunities for strategic innovation and sustained growth. A comprehensive understanding of these trends is paramount for businesses operating within this sector to effectively position themselves for future success.
Europe Soft Drinks Packaging Industry: A Comprehensive Market Report (2019-2033)
This comprehensive report provides an in-depth analysis of the European soft drinks packaging industry, covering market dynamics, growth trends, key players, and future outlook. With a study period spanning 2019-2033, a base year of 2025, and a forecast period of 2025-2033, this report is an essential resource for industry professionals, investors, and strategic decision-makers. The report analyzes the parent market (European Packaging Market) and child market (Soft Drinks Packaging within Europe) to provide a complete picture of the market landscape. Market values are presented in million units.
Europe Soft Drinks Packaging Industry Market Dynamics & Structure
The European soft drinks packaging market is a dynamic landscape shaped by intense competition, technological advancements, and evolving consumer preferences. Market concentration is moderate, with several key players holding significant shares, but also allowing space for smaller niche players. Technological innovation, particularly in sustainable packaging materials and improved manufacturing processes, are major drivers of growth. Stringent regulatory frameworks concerning recyclability and material composition influence packaging choices and production methods. The market sees significant competition from alternative packaging solutions, and end-user demographics (age, lifestyle, environmental awareness) heavily influence packaging selection. Mergers and acquisitions (M&A) activity has been significant, with larger companies consolidating their market positions through strategic acquisitions.
- Market Concentration: Moderate, with top 5 players holding approximately XX% market share (2024).
- Technological Innovation: Focus on lightweighting, recyclability, and sustainable materials.
- Regulatory Framework: Strict regulations on material usage, labeling, and recyclability are driving innovation.
- Competitive Substitutes: Growing interest in alternative packaging solutions (e.g., compostable materials).
- End-User Demographics: Increasing consumer demand for sustainable and convenient packaging.
- M&A Trends: Consolidation amongst major players, with XX M&A deals recorded between 2019-2024.
Europe Soft Drinks Packaging Industry Growth Trends & Insights
The European soft drinks packaging market exhibited a CAGR of XX% during the historical period (2019-2024), driven by increasing soft drink consumption and innovations in packaging technology. The market is expected to maintain a steady growth trajectory during the forecast period (2025-2033), with a projected CAGR of XX%. This growth is fueled by several factors, including the rising popularity of ready-to-drink beverages, the increasing demand for convenient and on-the-go packaging, and the growing adoption of sustainable packaging solutions. Technological disruptions, such as the introduction of advanced materials and automation in manufacturing, are contributing to improved efficiency and reduced costs. Shifting consumer behavior towards healthier beverages and eco-friendly options is also shaping market trends. Market penetration of sustainable packaging is increasing steadily, with a projected XX% penetration by 2033.
Dominant Regions, Countries, or Segments in Europe Soft Drinks Packaging Industry
Western European countries, particularly Germany, France, and the UK, dominate the market due to high soft drink consumption, robust economies, and developed infrastructure. The plastic segment holds the largest market share by material, driven by its versatility and cost-effectiveness. However, the paper and paperboard segment is experiencing rapid growth due to increasing sustainability concerns. Within product types, bottles account for the largest share, while the demand for cans and cartons is also growing.
- Key Drivers (Western Europe): High disposable incomes, established distribution networks, and strong consumer preference for convenience.
- Key Drivers (Paper & Paperboard): Growing consumer preference for eco-friendly packaging options and supportive government policies.
- Market Share (Plastic): XX% in 2024.
- Growth Potential (Paper & Paperboard): XX% CAGR (2025-2033).
Europe Soft Drinks Packaging Industry Product Landscape
The European soft drinks packaging market features a diverse range of products tailored to different beverage types and consumer preferences. Innovations focus on lightweighting, improved barrier properties, enhanced aesthetics, and sustainable materials. Unique selling propositions (USPs) include improved recyclability, reduced environmental impact, and enhanced shelf life. Technological advancements such as advanced printing techniques, intelligent packaging, and improved manufacturing processes are driving product innovation.
Key Drivers, Barriers & Challenges in Europe Soft Drinks Packaging Industry
Key Drivers:
- Growing demand for convenient and on-the-go packaging.
- Increasing consumer preference for sustainable and eco-friendly packaging.
- Technological advancements leading to improved efficiency and cost reduction.
Key Challenges:
- Fluctuating raw material prices.
- Stringent environmental regulations and compliance costs.
- Intense competition from substitute materials and packaging solutions. This leads to a price pressure of approximately XX% annually.
Emerging Opportunities in Europe Soft Drinks Packaging Industry
- Growing demand for lightweight and recyclable packaging.
- Increasing adoption of innovative packaging materials such as bioplastics and compostable materials.
- Expansion into niche markets such as functional beverages and premium soft drinks.
Growth Accelerators in the Europe Soft Drinks Packaging Industry
Technological breakthroughs in material science and manufacturing processes are accelerating market growth, allowing for the development of lighter, more sustainable, and cost-effective packaging solutions. Strategic partnerships between packaging manufacturers and soft drink companies are driving innovation and collaboration. Market expansion into emerging economies within Europe and the increased focus on e-commerce are contributing to the growth of the industry.
Key Players Shaping the Europe Soft Drinks Packaging Market
- CAN-PACK SA
- Ardagh Group SA
- Ball Corporation
- Pacific Can China Holdings Limited
- Graham Packaging Company
- Amcor PLC
- Crown Holdings Incorporated
- CKS Packaging Inc
- Toyo Seikan Group Holdings Ltd
- Tetra Pak Inc
- Owens-Illinois Inc
- Refresco Group NV
Notable Milestones in Europe Soft Drinks Packaging Industry Sector
- February 2021: Tetra Pak introduced certified recycled polymers and received RSB Advanced Products certification.
- June 2021: Amcor launched AmPrima, a new line of ultra-clear, heat-resistant, recyclable films.
In-Depth Europe Soft Drinks Packaging Industry Market Outlook
The future of the European soft drinks packaging market is promising, driven by continued growth in soft drink consumption, increasing demand for sustainable packaging, and ongoing technological advancements. Strategic partnerships, investments in R&D, and expansion into new markets will further fuel market growth. The focus on sustainability and circular economy initiatives will shape the industry's future, leading to innovative solutions and a more environmentally responsible approach to packaging.
Europe Soft Drinks Packaging Industry Segmentation
-
1. Material
- 1.1. Plastic
- 1.2. Metal
- 1.3. Glass
- 1.4. Paper and Paperboard
-
2. Product Type
- 2.1. Bottle
- 2.2. Can
- 2.3. Boxes
- 2.4. Cartons
Europe Soft Drinks Packaging Industry Segmentation By Geography
-
1. Europe
- 1.1. United Kingdom
- 1.2. Sweden
- 1.3. Germany
- 1.4. France
- 1.5. Rest of Europe
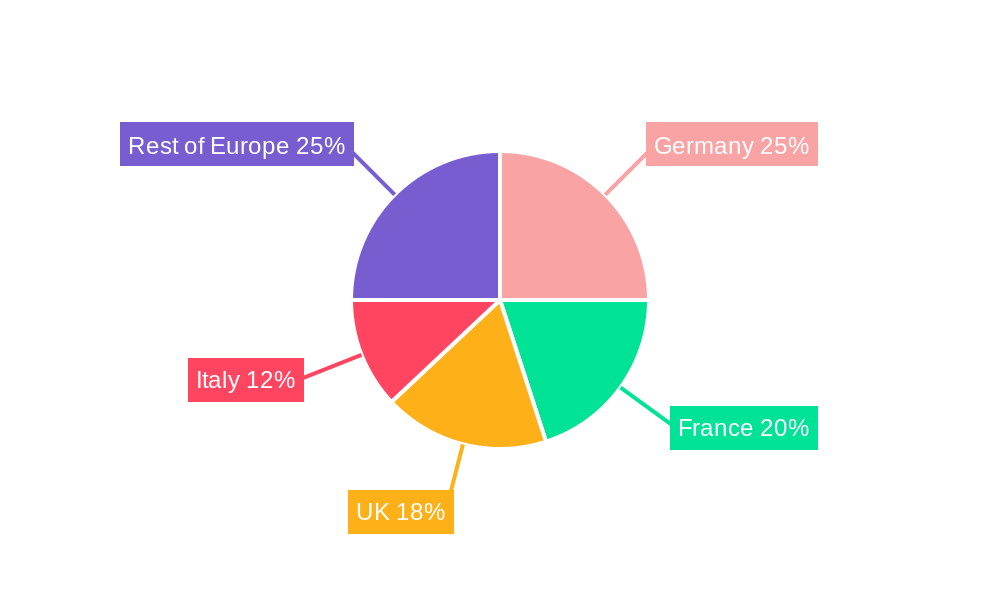
Europe Soft Drinks Packaging Industry Regional Market Share
Geographic Coverage of Europe Soft Drinks Packaging Industry
Europe Soft Drinks Packaging Industry REPORT HIGHLIGHTS
| Aspects | Details |
|---|---|
| Study Period | 2020-2034 |
| Base Year | 2025 |
| Estimated Year | 2026 |
| Forecast Period | 2026-2034 |
| Historical Period | 2020-2025 |
| Growth Rate | CAGR of 12.6% from 2020-2034 |
| Segmentation |
|
Table of Contents
- 1. Introduction
- 1.1. Research Scope
- 1.2. Market Segmentation
- 1.3. Research Objective
- 1.4. Definitions and Assumptions
- 2. Executive Summary
- 2.1. Market Snapshot
- 3. Market Dynamics
- 3.1. Market Drivers
- 3.2. Market Restrains
- 3.3. Market Trends
- 3.4. Market Opportunities
- 4. Market Factor Analysis
- 4.1. Porters Five Forces
- 4.1.1. Bargaining Power of Suppliers
- 4.1.2. Bargaining Power of Buyers
- 4.1.3. Threat of New Entrants
- 4.1.4. Threat of Substitutes
- 4.1.5. Competitive Rivalry
- 4.2. PESTEL analysis
- 4.3. BCG Analysis
- 4.3.1. Stars (High Growth, High Market Share)
- 4.3.2. Cash Cows (Low Growth, High Market Share)
- 4.3.3. Question Mark (High Growth, Low Market Share)
- 4.3.4. Dogs (Low Growth, Low Market Share)
- 4.4. Ansoff Matrix Analysis
- 4.5. Supply Chain Analysis
- 4.6. Regulatory Landscape
- 4.7. Current Market Potential and Opportunity Assessment (TAM–SAM–SOM Framework)
- 4.8. VDR Analyst Note
- 4.1. Porters Five Forces
- 5. Market Analysis, Insights and Forecast 2021-2033
- 5.1. Market Analysis, Insights and Forecast - by Material
- 5.1.1. Plastic
- 5.1.2. Metal
- 5.1.3. Glass
- 5.1.4. Paper and Paperboard
- 5.2. Market Analysis, Insights and Forecast - by Product Type
- 5.2.1. Bottle
- 5.2.2. Can
- 5.2.3. Boxes
- 5.2.4. Cartons
- 5.3. Market Analysis, Insights and Forecast - by Region
- 5.3.1. Europe
- 5.1. Market Analysis, Insights and Forecast - by Material
- 6. Europe Soft Drinks Packaging Industry Analysis, Insights and Forecast, 2021-2033
- 6.1. Market Analysis, Insights and Forecast - by Material
- 6.1.1. Plastic
- 6.1.2. Metal
- 6.1.3. Glass
- 6.1.4. Paper and Paperboard
- 6.2. Market Analysis, Insights and Forecast - by Product Type
- 6.2.1. Bottle
- 6.2.2. Can
- 6.2.3. Boxes
- 6.2.4. Cartons
- 6.1. Market Analysis, Insights and Forecast - by Material
- 7. Competitive Analysis
- 7.1. Company Profiles
- 7.1.1 CAN-PACK SA
- 7.1.1.1. Company Overview
- 7.1.1.2. Products
- 7.1.1.3. Company Financials
- 7.1.1.4. SWOT Analysis
- 7.1.2 Ardagh Group SA*List Not Exhaustive
- 7.1.2.1. Company Overview
- 7.1.2.2. Products
- 7.1.2.3. Company Financials
- 7.1.2.4. SWOT Analysis
- 7.1.3 Ball Corporation
- 7.1.3.1. Company Overview
- 7.1.3.2. Products
- 7.1.3.3. Company Financials
- 7.1.3.4. SWOT Analysis
- 7.1.4 Pacific Can China Holdings Limited
- 7.1.4.1. Company Overview
- 7.1.4.2. Products
- 7.1.4.3. Company Financials
- 7.1.4.4. SWOT Analysis
- 7.1.5 Graham Packaging Company
- 7.1.5.1. Company Overview
- 7.1.5.2. Products
- 7.1.5.3. Company Financials
- 7.1.5.4. SWOT Analysis
- 7.1.6 Amcor PLC
- 7.1.6.1. Company Overview
- 7.1.6.2. Products
- 7.1.6.3. Company Financials
- 7.1.6.4. SWOT Analysis
- 7.1.7 Crown Holdings Incorporated
- 7.1.7.1. Company Overview
- 7.1.7.2. Products
- 7.1.7.3. Company Financials
- 7.1.7.4. SWOT Analysis
- 7.1.8 CKS Packaging Inc
- 7.1.8.1. Company Overview
- 7.1.8.2. Products
- 7.1.8.3. Company Financials
- 7.1.8.4. SWOT Analysis
- 7.1.9 Toyo Seikan Group Holdings Ltd
- 7.1.9.1. Company Overview
- 7.1.9.2. Products
- 7.1.9.3. Company Financials
- 7.1.9.4. SWOT Analysis
- 7.1.10 Tetra Pak Inc
- 7.1.10.1. Company Overview
- 7.1.10.2. Products
- 7.1.10.3. Company Financials
- 7.1.10.4. SWOT Analysis
- 7.1.11 Owens-Illinois Inc
- 7.1.11.1. Company Overview
- 7.1.11.2. Products
- 7.1.11.3. Company Financials
- 7.1.11.4. SWOT Analysis
- 7.1.12 Refresco Group NV
- 7.1.12.1. Company Overview
- 7.1.12.2. Products
- 7.1.12.3. Company Financials
- 7.1.12.4. SWOT Analysis
- 7.1.1 CAN-PACK SA
- 7.2. Market Entropy
- 7.2.1 Company's Key Areas Served
- 7.2.2 Recent Developments
- 7.3. Company Market Share Analysis 2025
- 7.3.1 Top 5 Companies Market Share Analysis
- 7.3.2 Top 3 Companies Market Share Analysis
- 7.4. List of Potential Customers
- 8. Research Methodology
List of Figures
- Figure 1: Europe Soft Drinks Packaging Industry Revenue Breakdown (billion, %) by Product 2025 & 2033
- Figure 2: Europe Soft Drinks Packaging Industry Share (%) by Company 2025
List of Tables
- Table 1: Europe Soft Drinks Packaging Industry Revenue billion Forecast, by Material 2020 & 2033
- Table 2: Europe Soft Drinks Packaging Industry Revenue billion Forecast, by Product Type 2020 & 2033
- Table 3: Europe Soft Drinks Packaging Industry Revenue billion Forecast, by Region 2020 & 2033
- Table 4: Europe Soft Drinks Packaging Industry Revenue billion Forecast, by Material 2020 & 2033
- Table 5: Europe Soft Drinks Packaging Industry Revenue billion Forecast, by Product Type 2020 & 2033
- Table 6: Europe Soft Drinks Packaging Industry Revenue billion Forecast, by Country 2020 & 2033
- Table 7: United Kingdom Europe Soft Drinks Packaging Industry Revenue (billion) Forecast, by Application 2020 & 2033
- Table 8: Sweden Europe Soft Drinks Packaging Industry Revenue (billion) Forecast, by Application 2020 & 2033
- Table 9: Germany Europe Soft Drinks Packaging Industry Revenue (billion) Forecast, by Application 2020 & 2033
- Table 10: France Europe Soft Drinks Packaging Industry Revenue (billion) Forecast, by Application 2020 & 2033
- Table 11: Rest of Europe Europe Soft Drinks Packaging Industry Revenue (billion) Forecast, by Application 2020 & 2033
Frequently Asked Questions
1. What is the projected Compound Annual Growth Rate (CAGR) of the Europe Soft Drinks Packaging Industry?
The projected CAGR is approximately 12.6%.
2. Which companies are prominent players in the Europe Soft Drinks Packaging Industry?
Key companies in the market include CAN-PACK SA, Ardagh Group SA*List Not Exhaustive, Ball Corporation, Pacific Can China Holdings Limited, Graham Packaging Company, Amcor PLC, Crown Holdings Incorporated, CKS Packaging Inc, Toyo Seikan Group Holdings Ltd, Tetra Pak Inc, Owens-Illinois Inc, Refresco Group NV.
3. What are the main segments of the Europe Soft Drinks Packaging Industry?
The market segments include Material, Product Type.
4. Can you provide details about the market size?
The market size is estimated to be USD 44.3 billion as of 2022.
5. What are some drivers contributing to market growth?
Increasing Disposable Income and Growing Economies; Growing Demand for Ready-to-use Drinks.
6. What are the notable trends driving market growth?
Plastic is Expected to Hold the Largest Market Share.
7. Are there any restraints impacting market growth?
Stringent Government Regulations Against Non-biodegradable Products.
8. Can you provide examples of recent developments in the market?
February 2021 - Tetra Pak introduced certified recycled polymers and became the first company in the food and beverage packaging industry to be awarded the Roundtable on Sustainable Biomaterials (RSB) Advanced Products certification. Its carton packages integrating attributed recycled polymers are now available for food and beverage manufacturers.
9. What pricing options are available for accessing the report?
Pricing options include single-user, multi-user, and enterprise licenses priced at USD 4750, USD 4950, and USD 6800 respectively.
10. Is the market size provided in terms of value or volume?
The market size is provided in terms of value, measured in billion.
11. Are there any specific market keywords associated with the report?
Yes, the market keyword associated with the report is "Europe Soft Drinks Packaging Industry," which aids in identifying and referencing the specific market segment covered.
12. How do I determine which pricing option suits my needs best?
The pricing options vary based on user requirements and access needs. Individual users may opt for single-user licenses, while businesses requiring broader access may choose multi-user or enterprise licenses for cost-effective access to the report.
13. Are there any additional resources or data provided in the Europe Soft Drinks Packaging Industry report?
While the report offers comprehensive insights, it's advisable to review the specific contents or supplementary materials provided to ascertain if additional resources or data are available.
14. How can I stay updated on further developments or reports in the Europe Soft Drinks Packaging Industry?
To stay informed about further developments, trends, and reports in the Europe Soft Drinks Packaging Industry, consider subscribing to industry newsletters, following relevant companies and organizations, or regularly checking reputable industry news sources and publications.
Methodology
Step 1 - Identification of Relevant Samples Size from Population Database


Step 2 - Approaches for Defining Global Market Size (Value, Volume* & Price*)

Note*: In applicable scenarios
Step 3 - Data Sources
Primary Research
- Web Analytics
- Survey Reports
- Research Institute
- Latest Research Reports
- Opinion Leaders
Secondary Research
- Annual Reports
- White Paper
- Latest Press Release
- Industry Association
- Paid Database
- Investor Presentations

Step 4 - Data Triangulation
Involves using different sources of information in order to increase the validity of a study
These sources are likely to be stakeholders in a program - participants, other researchers, program staff, other community members, and so on.
Then we put all data in single framework & apply various statistical tools to find out the dynamic on the market.
During the analysis stage, feedback from the stakeholder groups would be compared to determine areas of agreement as well as areas of divergence