

Key Insights
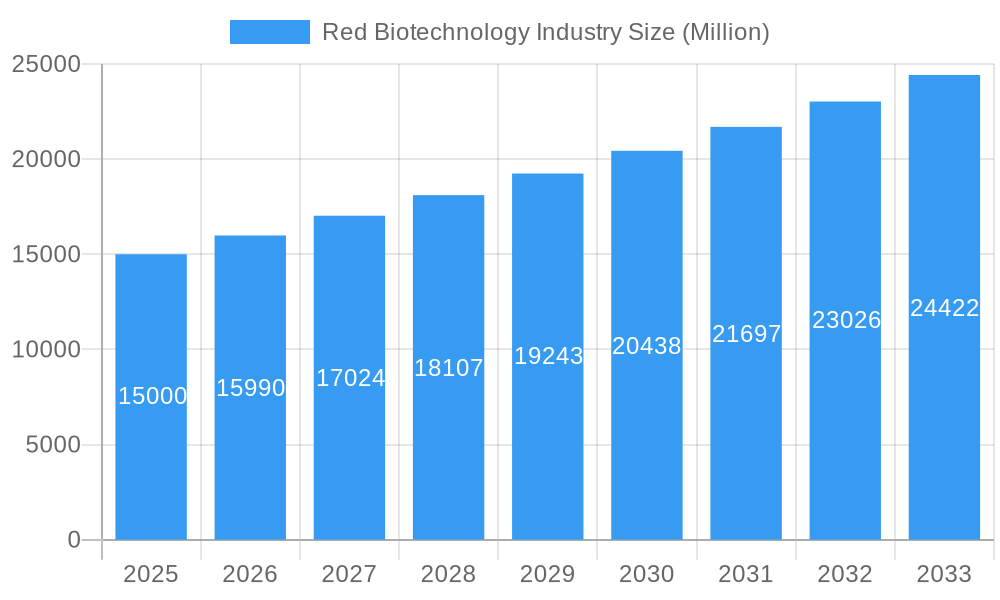
The Red Biotechnology market, encompassing vital biopharmaceutical products like vaccines and drugs, is poised for significant expansion within the biopharmaceutical, CMO, and CRO sectors. Projections indicate a Compound Annual Growth Rate (CAGR) of 6.10% from 2019 to 2033. This growth is underpinned by the rising incidence of chronic diseases, increased R&D investment in cutting-edge biotechnologies, and the widespread adoption of personalized medicine. North America, led by the United States, is expected to retain market leadership due to its advanced healthcare infrastructure and strong regulatory environment. The Asia-Pacific region, particularly China and India, presents a key growth avenue, driven by expanding healthcare expenditures and a growing middle class. Market segmentation highlights vaccines and drugs as leading segments, essential for disease treatment. Despite challenges such as stringent regulatory processes, high development costs, and biosimilar competition, the long-term outlook is optimistic, driven by ongoing biotechnological advancements and escalating global demand for effective healthcare solutions. Key industry players, including Amgen, Merck, Roche, and AstraZeneca, are anticipated to strengthen their positions through strategic collaborations and product innovation.
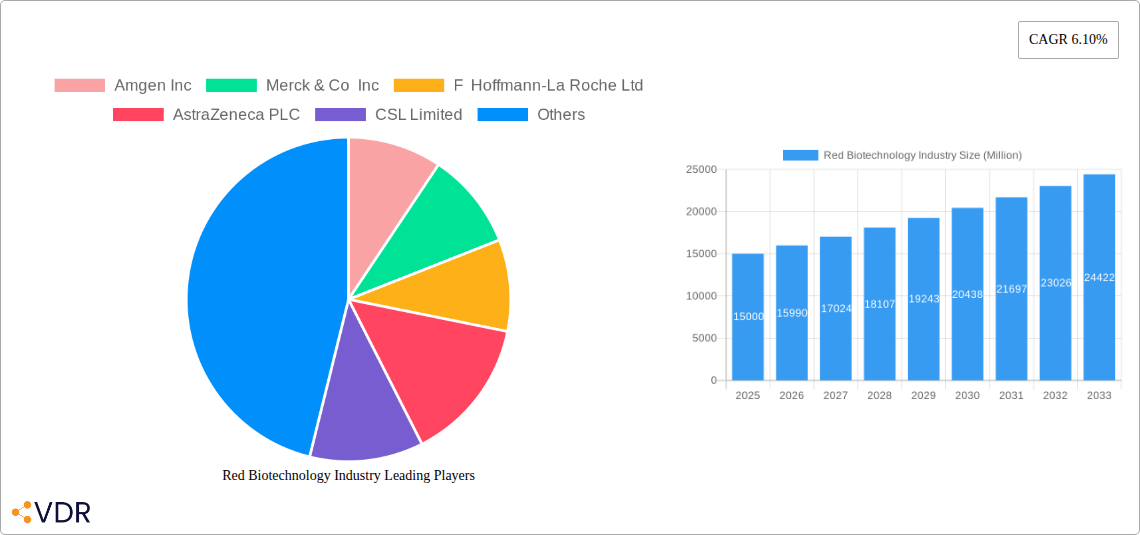
Red Biotechnology Industry Market Size (In Billion)
The competitive environment features established multinational pharmaceutical corporations and specialized biotechnology firms. Emerging therapeutic modalities and technological breakthroughs in gene editing and cell therapy contribute to the market's dynamism. Future expansion will be influenced by regulatory frameworks that foster innovation while prioritizing patient safety, alongside effective management of intellectual property and pricing. Addressing global health disparities and ensuring equitable access to red biotechnology products in emerging economies will be paramount for realizing the market's full potential and societal benefit. The forecast period from 2025 to 2033 is anticipated to see continued growth, reinforcing the red biotechnology sector's critical role in global healthcare.
Red Biotechnology Industry Company Market Share
Red Biotechnology Industry Market Report: 2019-2033
This comprehensive report provides an in-depth analysis of the Red Biotechnology industry, encompassing market dynamics, growth trends, competitive landscape, and future outlook. The study period covers 2019-2033, with 2025 as the base and estimated year. The report segments the market by product (vaccines, drugs, others) and end-user (biopharmaceutical companies, CMOs & CROs, others), offering granular insights into this rapidly evolving sector. Projected market value is expected to reach xx Million by 2033.
Red Biotechnology Industry Market Dynamics & Structure
This section analyzes the market's competitive intensity, technological advancements, regulatory landscape, and prevailing market trends. The report examines market concentration, identifying key players and their market share, and explores the impact of mergers and acquisitions (M&A) activities. The influence of technological innovation, including the development of CRISPR-Combo technology, is assessed. Regulatory frameworks impacting the industry are detailed, along with an analysis of competitive substitutes and their market penetration. The evolving demographics of end-users are also considered.
- Market Concentration: Highly concentrated with top 10 players holding approximately 75% market share in 2024.
- Technological Innovation: CRISPR-Combo technology, gene editing advancements are driving innovation, but high R&D costs present a barrier.
- Regulatory Frameworks: Stringent FDA approvals and global regulatory variations impact market entry and product lifecycles.
- M&A Activity: Significant M&A activity observed in the historical period (2019-2024), with an estimated xx deals valued at xx Million.
Red Biotechnology Industry Growth Trends & Insights
This section details the evolution of the Red Biotechnology market size, adoption rates across various segments, technological disruptions influencing growth, and shifts in consumer behavior. Quantitative insights such as compound annual growth rate (CAGR) and market penetration rates are provided, illuminating the industry's trajectory from 2019 to 2033. The analysis considers factors like increasing demand for personalized medicine, advancements in gene editing and cell therapy, and the rising prevalence of chronic diseases.
- Market Size Evolution: The market experienced a CAGR of xx% during 2019-2024 and is projected to grow at xx% CAGR from 2025-2033.
- Adoption Rates: High adoption rates are anticipated in biopharmaceutical companies due to increasing outsourcing of R&D and manufacturing.
- Technological Disruptions: Advancements in gene editing, personalized medicine and cell therapies are major disruptors.
- Consumer Behavior: Growing awareness of advanced therapies and personalized treatment options is driving demand.
Dominant Regions, Countries, or Segments in Red Biotechnology Industry
This analysis identifies the leading geographical regions and market segments driving market growth. The dominance of specific regions or countries is examined, considering factors such as economic policies supporting biotechnology, established infrastructure conducive to R&D, and the presence of key players. The report further investigates the dominance of various product and end-user segments.
- By Product: Drugs segment holds the largest market share (xx%), driven by high demand for novel therapies and increasing prevalence of chronic diseases. Vaccines segment is projected to experience significant growth due to ongoing research and development.
- By End-User: Biopharmaceutical companies constitute the largest segment (xx%), driven by the need for advanced technologies and outsourcing.
- Dominant Regions: North America and Europe are currently leading the market, with Asia-Pacific projected to experience significant growth owing to rising healthcare expenditure and supportive government initiatives.
Red Biotechnology Industry Product Landscape
This section provides a concise overview of product innovations, applications, and performance metrics within the Red Biotechnology industry. It highlights unique selling propositions and technological advancements, focusing on factors that differentiate products and drive adoption.
The landscape is characterized by innovative therapies, including targeted drug delivery systems and advanced cell therapies. Performance metrics focus on efficacy, safety, and cost-effectiveness, with ongoing emphasis on personalized and precision medicine solutions.
Key Drivers, Barriers & Challenges in Red Biotechnology Industry
This section outlines the key factors driving market growth and the challenges hindering its expansion.
Key Drivers:
- Technological advancements in gene editing and cell therapy.
- Rising prevalence of chronic diseases necessitating advanced treatment options.
- Increasing R&D investment by leading pharmaceutical companies.
- Favorable regulatory environments in certain regions.
Key Challenges:
- High R&D costs and lengthy regulatory approval processes.
- Intense competition among established and emerging players.
- Potential ethical concerns surrounding gene editing and other advanced technologies.
- Supply chain disruptions and manufacturing complexities.
Emerging Opportunities in Red Biotechnology Industry
This section highlights emerging opportunities within the Red Biotechnology industry.
- Untapped markets in developing economies.
- Innovative applications in areas such as regenerative medicine and personalized cancer therapies.
- Evolving consumer preferences toward preventative and personalized healthcare solutions.
- Potential for strategic partnerships and collaborations to accelerate innovation and market entry.
Growth Accelerators in the Red Biotechnology Industry Industry
Technological breakthroughs, strategic alliances, and expansions into new markets are driving long-term growth. The development of novel gene-editing techniques and cell therapies, along with strategic collaborations among industry players, will fuel further expansion. Growing investments in R&D and the increasing prevalence of chronic illnesses will further boost market growth.
Key Players Shaping the Red Biotechnology Industry Market
Notable Milestones in Red Biotechnology Industry Sector
- June 2022: Researchers at the University of Maryland developed CRISPR-Combo technology for enhanced crop breeding.
- September 2022: Bluebird bio received US-FDA approval for SKYSONA (elivaldogene autotemcel) to treat cerebral adrenoleukodystrophy.
In-Depth Red Biotechnology Industry Market Outlook
The Red Biotechnology industry is poised for significant growth, driven by continuous technological innovation, increasing healthcare expenditure, and the growing prevalence of chronic diseases. Strategic partnerships and collaborations will be crucial for navigating regulatory hurdles and accelerating the development and commercialization of innovative therapies. The focus on personalized medicine and the expansion into new markets will further unlock significant opportunities for growth and expansion in the coming years.
Red Biotechnology Industry Segmentation
-
1. Product
- 1.1. Vaccines
- 1.2. Drugs
- 1.3. Others
-
2. End User
- 2.1. Biopharmaceutical Companies
- 2.2. CMOs and CROs
- 2.3. Others
Red Biotechnology Industry Segmentation By Geography
-
1. North America
- 1.1. United States
- 1.2. Canada
- 1.3. Mexico
-
2. Europe
- 2.1. Germany
- 2.2. United Kingdom
- 2.3. France
- 2.4. Italy
- 2.5. Spain
- 2.6. Rest of Europe
-
3. Asia Pacific
- 3.1. China
- 3.2. Japan
- 3.3. India
- 3.4. Australia
- 3.5. South Korea
- 3.6. Rest of Asia Pacific
-
4. Middle East and Africa
- 4.1. GCC
- 4.2. South Africa
- 4.3. Rest of Middle East and Africa
-
5. South America
- 5.1. Brazil
- 5.2. Argentina
- 5.3. Rest of South America
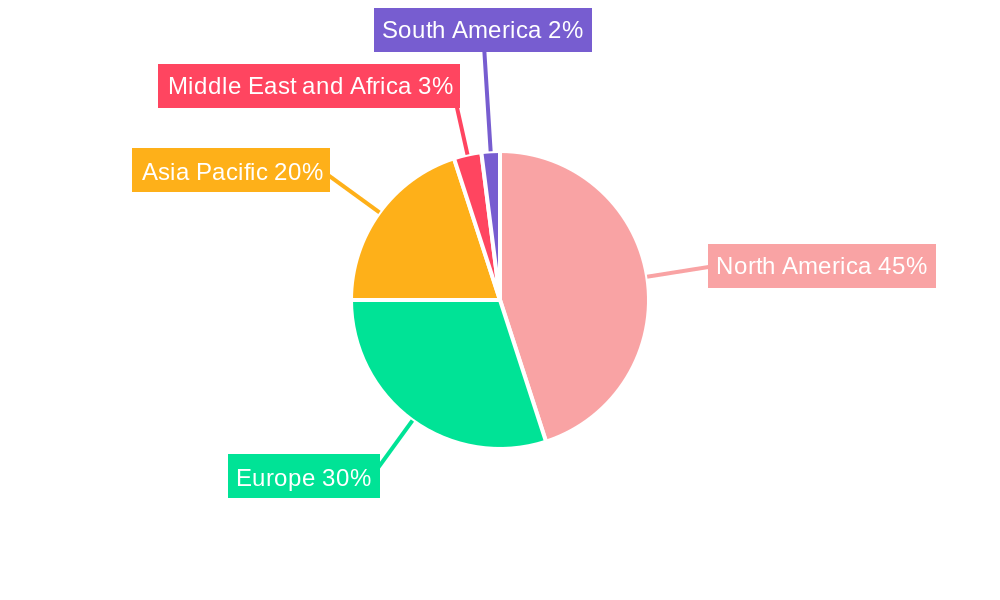
Red Biotechnology Industry Regional Market Share
Geographic Coverage of Red Biotechnology Industry
Red Biotechnology Industry REPORT HIGHLIGHTS
| Aspects | Details |
|---|---|
| Study Period | 2020-2034 |
| Base Year | 2025 |
| Estimated Year | 2026 |
| Forecast Period | 2026-2034 |
| Historical Period | 2020-2025 |
| Growth Rate | CAGR of 10.34% from 2020-2034 |
| Segmentation |
|
Table of Contents
- 1. Introduction
- 1.1. Research Scope
- 1.2. Market Segmentation
- 1.3. Research Objective
- 1.4. Definitions and Assumptions
- 2. Executive Summary
- 2.1. Market Snapshot
- 3. Market Dynamics
- 3.1. Market Drivers
- 3.2. Market Restrains
- 3.3. Market Trends
- 3.4. Market Opportunities
- 4. Market Factor Analysis
- 4.1. Porters Five Forces
- 4.1.1. Bargaining Power of Suppliers
- 4.1.2. Bargaining Power of Buyers
- 4.1.3. Threat of New Entrants
- 4.1.4. Threat of Substitutes
- 4.1.5. Competitive Rivalry
- 4.2. PESTEL analysis
- 4.3. BCG Analysis
- 4.3.1. Stars (High Growth, High Market Share)
- 4.3.2. Cash Cows (Low Growth, High Market Share)
- 4.3.3. Question Mark (High Growth, Low Market Share)
- 4.3.4. Dogs (Low Growth, Low Market Share)
- 4.4. Ansoff Matrix Analysis
- 4.5. Supply Chain Analysis
- 4.6. Regulatory Landscape
- 4.7. Current Market Potential and Opportunity Assessment (TAM–SAM–SOM Framework)
- 4.8. VDR Analyst Note
- 4.1. Porters Five Forces
- 5. Market Analysis, Insights and Forecast 2021-2033
- 5.1. Market Analysis, Insights and Forecast - by Product
- 5.1.1. Vaccines
- 5.1.2. Drugs
- 5.1.3. Others
- 5.2. Market Analysis, Insights and Forecast - by End User
- 5.2.1. Biopharmaceutical Companies
- 5.2.2. CMOs and CROs
- 5.2.3. Others
- 5.3. Market Analysis, Insights and Forecast - by Region
- 5.3.1. North America
- 5.3.2. Europe
- 5.3.3. Asia Pacific
- 5.3.4. Middle East and Africa
- 5.3.5. South America
- 5.1. Market Analysis, Insights and Forecast - by Product
- 6. Global Red Biotechnology Industry Analysis, Insights and Forecast, 2021-2033
- 6.1. Market Analysis, Insights and Forecast - by Product
- 6.1.1. Vaccines
- 6.1.2. Drugs
- 6.1.3. Others
- 6.2. Market Analysis, Insights and Forecast - by End User
- 6.2.1. Biopharmaceutical Companies
- 6.2.2. CMOs and CROs
- 6.2.3. Others
- 6.1. Market Analysis, Insights and Forecast - by Product
- 7. North America Red Biotechnology Industry Analysis, Insights and Forecast, 2021-2033
- 7.1. Market Analysis, Insights and Forecast - by Product
- 7.1.1. Vaccines
- 7.1.2. Drugs
- 7.1.3. Others
- 7.2. Market Analysis, Insights and Forecast - by End User
- 7.2.1. Biopharmaceutical Companies
- 7.2.2. CMOs and CROs
- 7.2.3. Others
- 7.1. Market Analysis, Insights and Forecast - by Product
- 8. Europe Red Biotechnology Industry Analysis, Insights and Forecast, 2021-2033
- 8.1. Market Analysis, Insights and Forecast - by Product
- 8.1.1. Vaccines
- 8.1.2. Drugs
- 8.1.3. Others
- 8.2. Market Analysis, Insights and Forecast - by End User
- 8.2.1. Biopharmaceutical Companies
- 8.2.2. CMOs and CROs
- 8.2.3. Others
- 8.1. Market Analysis, Insights and Forecast - by Product
- 9. Asia Pacific Red Biotechnology Industry Analysis, Insights and Forecast, 2021-2033
- 9.1. Market Analysis, Insights and Forecast - by Product
- 9.1.1. Vaccines
- 9.1.2. Drugs
- 9.1.3. Others
- 9.2. Market Analysis, Insights and Forecast - by End User
- 9.2.1. Biopharmaceutical Companies
- 9.2.2. CMOs and CROs
- 9.2.3. Others
- 9.1. Market Analysis, Insights and Forecast - by Product
- 10. Middle East and Africa Red Biotechnology Industry Analysis, Insights and Forecast, 2021-2033
- 10.1. Market Analysis, Insights and Forecast - by Product
- 10.1.1. Vaccines
- 10.1.2. Drugs
- 10.1.3. Others
- 10.2. Market Analysis, Insights and Forecast - by End User
- 10.2.1. Biopharmaceutical Companies
- 10.2.2. CMOs and CROs
- 10.2.3. Others
- 10.1. Market Analysis, Insights and Forecast - by Product
- 11. South America Red Biotechnology Industry Analysis, Insights and Forecast, 2021-2033
- 11.1. Market Analysis, Insights and Forecast - by Product
- 11.1.1. Vaccines
- 11.1.2. Drugs
- 11.1.3. Others
- 11.2. Market Analysis, Insights and Forecast - by End User
- 11.2.1. Biopharmaceutical Companies
- 11.2.2. CMOs and CROs
- 11.2.3. Others
- 11.1. Market Analysis, Insights and Forecast - by Product
- 12. Competitive Analysis
- 12.1. Company Profiles
- 12.1.1 Amgen Inc
- 12.1.1.1. Company Overview
- 12.1.1.2. Products
- 12.1.1.3. Company Financials
- 12.1.1.4. SWOT Analysis
- 12.1.2 Merck & Co Inc
- 12.1.2.1. Company Overview
- 12.1.2.2. Products
- 12.1.2.3. Company Financials
- 12.1.2.4. SWOT Analysis
- 12.1.3 F Hoffmann-La Roche Ltd
- 12.1.3.1. Company Overview
- 12.1.3.2. Products
- 12.1.3.3. Company Financials
- 12.1.3.4. SWOT Analysis
- 12.1.4 AstraZeneca PLC
- 12.1.4.1. Company Overview
- 12.1.4.2. Products
- 12.1.4.3. Company Financials
- 12.1.4.4. SWOT Analysis
- 12.1.5 CSL Limited
- 12.1.5.1. Company Overview
- 12.1.5.2. Products
- 12.1.5.3. Company Financials
- 12.1.5.4. SWOT Analysis
- 12.1.6 Takeda Pharmaceutical Company Limited
- 12.1.6.1. Company Overview
- 12.1.6.2. Products
- 12.1.6.3. Company Financials
- 12.1.6.4. SWOT Analysis
- 12.1.7 Bristol Myers Squibb (Celgene Corporation)
- 12.1.7.1. Company Overview
- 12.1.7.2. Products
- 12.1.7.3. Company Financials
- 12.1.7.4. SWOT Analysis
- 12.1.8 Biogen Inc
- 12.1.8.1. Company Overview
- 12.1.8.2. Products
- 12.1.8.3. Company Financials
- 12.1.8.4. SWOT Analysis
- 12.1.9 Gilead Sciences Inc
- 12.1.9.1. Company Overview
- 12.1.9.2. Products
- 12.1.9.3. Company Financials
- 12.1.9.4. SWOT Analysis
- 12.1.10 Pfizer Inc
- 12.1.10.1. Company Overview
- 12.1.10.2. Products
- 12.1.10.3. Company Financials
- 12.1.10.4. SWOT Analysis
- 12.1.1 Amgen Inc
- 12.2. Market Entropy
- 12.2.1 Company's Key Areas Served
- 12.2.2 Recent Developments
- 12.3. Company Market Share Analysis 2025
- 12.3.1 Top 5 Companies Market Share Analysis
- 12.3.2 Top 3 Companies Market Share Analysis
- 12.4. List of Potential Customers
- 13. Research Methodology
List of Figures
- Figure 1: Global Red Biotechnology Industry Revenue Breakdown (billion, %) by Region 2025 & 2033
- Figure 2: Global Red Biotechnology Industry Volume Breakdown (K Unit, %) by Region 2025 & 2033
- Figure 3: North America Red Biotechnology Industry Revenue (billion), by Product 2025 & 2033
- Figure 4: North America Red Biotechnology Industry Volume (K Unit), by Product 2025 & 2033
- Figure 5: North America Red Biotechnology Industry Revenue Share (%), by Product 2025 & 2033
- Figure 6: North America Red Biotechnology Industry Volume Share (%), by Product 2025 & 2033
- Figure 7: North America Red Biotechnology Industry Revenue (billion), by End User 2025 & 2033
- Figure 8: North America Red Biotechnology Industry Volume (K Unit), by End User 2025 & 2033
- Figure 9: North America Red Biotechnology Industry Revenue Share (%), by End User 2025 & 2033
- Figure 10: North America Red Biotechnology Industry Volume Share (%), by End User 2025 & 2033
- Figure 11: North America Red Biotechnology Industry Revenue (billion), by Country 2025 & 2033
- Figure 12: North America Red Biotechnology Industry Volume (K Unit), by Country 2025 & 2033
- Figure 13: North America Red Biotechnology Industry Revenue Share (%), by Country 2025 & 2033
- Figure 14: North America Red Biotechnology Industry Volume Share (%), by Country 2025 & 2033
- Figure 15: Europe Red Biotechnology Industry Revenue (billion), by Product 2025 & 2033
- Figure 16: Europe Red Biotechnology Industry Volume (K Unit), by Product 2025 & 2033
- Figure 17: Europe Red Biotechnology Industry Revenue Share (%), by Product 2025 & 2033
- Figure 18: Europe Red Biotechnology Industry Volume Share (%), by Product 2025 & 2033
- Figure 19: Europe Red Biotechnology Industry Revenue (billion), by End User 2025 & 2033
- Figure 20: Europe Red Biotechnology Industry Volume (K Unit), by End User 2025 & 2033
- Figure 21: Europe Red Biotechnology Industry Revenue Share (%), by End User 2025 & 2033
- Figure 22: Europe Red Biotechnology Industry Volume Share (%), by End User 2025 & 2033
- Figure 23: Europe Red Biotechnology Industry Revenue (billion), by Country 2025 & 2033
- Figure 24: Europe Red Biotechnology Industry Volume (K Unit), by Country 2025 & 2033
- Figure 25: Europe Red Biotechnology Industry Revenue Share (%), by Country 2025 & 2033
- Figure 26: Europe Red Biotechnology Industry Volume Share (%), by Country 2025 & 2033
- Figure 27: Asia Pacific Red Biotechnology Industry Revenue (billion), by Product 2025 & 2033
- Figure 28: Asia Pacific Red Biotechnology Industry Volume (K Unit), by Product 2025 & 2033
- Figure 29: Asia Pacific Red Biotechnology Industry Revenue Share (%), by Product 2025 & 2033
- Figure 30: Asia Pacific Red Biotechnology Industry Volume Share (%), by Product 2025 & 2033
- Figure 31: Asia Pacific Red Biotechnology Industry Revenue (billion), by End User 2025 & 2033
- Figure 32: Asia Pacific Red Biotechnology Industry Volume (K Unit), by End User 2025 & 2033
- Figure 33: Asia Pacific Red Biotechnology Industry Revenue Share (%), by End User 2025 & 2033
- Figure 34: Asia Pacific Red Biotechnology Industry Volume Share (%), by End User 2025 & 2033
- Figure 35: Asia Pacific Red Biotechnology Industry Revenue (billion), by Country 2025 & 2033
- Figure 36: Asia Pacific Red Biotechnology Industry Volume (K Unit), by Country 2025 & 2033
- Figure 37: Asia Pacific Red Biotechnology Industry Revenue Share (%), by Country 2025 & 2033
- Figure 38: Asia Pacific Red Biotechnology Industry Volume Share (%), by Country 2025 & 2033
- Figure 39: Middle East and Africa Red Biotechnology Industry Revenue (billion), by Product 2025 & 2033
- Figure 40: Middle East and Africa Red Biotechnology Industry Volume (K Unit), by Product 2025 & 2033
- Figure 41: Middle East and Africa Red Biotechnology Industry Revenue Share (%), by Product 2025 & 2033
- Figure 42: Middle East and Africa Red Biotechnology Industry Volume Share (%), by Product 2025 & 2033
- Figure 43: Middle East and Africa Red Biotechnology Industry Revenue (billion), by End User 2025 & 2033
- Figure 44: Middle East and Africa Red Biotechnology Industry Volume (K Unit), by End User 2025 & 2033
- Figure 45: Middle East and Africa Red Biotechnology Industry Revenue Share (%), by End User 2025 & 2033
- Figure 46: Middle East and Africa Red Biotechnology Industry Volume Share (%), by End User 2025 & 2033
- Figure 47: Middle East and Africa Red Biotechnology Industry Revenue (billion), by Country 2025 & 2033
- Figure 48: Middle East and Africa Red Biotechnology Industry Volume (K Unit), by Country 2025 & 2033
- Figure 49: Middle East and Africa Red Biotechnology Industry Revenue Share (%), by Country 2025 & 2033
- Figure 50: Middle East and Africa Red Biotechnology Industry Volume Share (%), by Country 2025 & 2033
- Figure 51: South America Red Biotechnology Industry Revenue (billion), by Product 2025 & 2033
- Figure 52: South America Red Biotechnology Industry Volume (K Unit), by Product 2025 & 2033
- Figure 53: South America Red Biotechnology Industry Revenue Share (%), by Product 2025 & 2033
- Figure 54: South America Red Biotechnology Industry Volume Share (%), by Product 2025 & 2033
- Figure 55: South America Red Biotechnology Industry Revenue (billion), by End User 2025 & 2033
- Figure 56: South America Red Biotechnology Industry Volume (K Unit), by End User 2025 & 2033
- Figure 57: South America Red Biotechnology Industry Revenue Share (%), by End User 2025 & 2033
- Figure 58: South America Red Biotechnology Industry Volume Share (%), by End User 2025 & 2033
- Figure 59: South America Red Biotechnology Industry Revenue (billion), by Country 2025 & 2033
- Figure 60: South America Red Biotechnology Industry Volume (K Unit), by Country 2025 & 2033
- Figure 61: South America Red Biotechnology Industry Revenue Share (%), by Country 2025 & 2033
- Figure 62: South America Red Biotechnology Industry Volume Share (%), by Country 2025 & 2033
List of Tables
- Table 1: Global Red Biotechnology Industry Revenue billion Forecast, by Product 2020 & 2033
- Table 2: Global Red Biotechnology Industry Volume K Unit Forecast, by Product 2020 & 2033
- Table 3: Global Red Biotechnology Industry Revenue billion Forecast, by End User 2020 & 2033
- Table 4: Global Red Biotechnology Industry Volume K Unit Forecast, by End User 2020 & 2033
- Table 5: Global Red Biotechnology Industry Revenue billion Forecast, by Region 2020 & 2033
- Table 6: Global Red Biotechnology Industry Volume K Unit Forecast, by Region 2020 & 2033
- Table 7: Global Red Biotechnology Industry Revenue billion Forecast, by Product 2020 & 2033
- Table 8: Global Red Biotechnology Industry Volume K Unit Forecast, by Product 2020 & 2033
- Table 9: Global Red Biotechnology Industry Revenue billion Forecast, by End User 2020 & 2033
- Table 10: Global Red Biotechnology Industry Volume K Unit Forecast, by End User 2020 & 2033
- Table 11: Global Red Biotechnology Industry Revenue billion Forecast, by Country 2020 & 2033
- Table 12: Global Red Biotechnology Industry Volume K Unit Forecast, by Country 2020 & 2033
- Table 13: United States Red Biotechnology Industry Revenue (billion) Forecast, by Application 2020 & 2033
- Table 14: United States Red Biotechnology Industry Volume (K Unit) Forecast, by Application 2020 & 2033
- Table 15: Canada Red Biotechnology Industry Revenue (billion) Forecast, by Application 2020 & 2033
- Table 16: Canada Red Biotechnology Industry Volume (K Unit) Forecast, by Application 2020 & 2033
- Table 17: Mexico Red Biotechnology Industry Revenue (billion) Forecast, by Application 2020 & 2033
- Table 18: Mexico Red Biotechnology Industry Volume (K Unit) Forecast, by Application 2020 & 2033
- Table 19: Global Red Biotechnology Industry Revenue billion Forecast, by Product 2020 & 2033
- Table 20: Global Red Biotechnology Industry Volume K Unit Forecast, by Product 2020 & 2033
- Table 21: Global Red Biotechnology Industry Revenue billion Forecast, by End User 2020 & 2033
- Table 22: Global Red Biotechnology Industry Volume K Unit Forecast, by End User 2020 & 2033
- Table 23: Global Red Biotechnology Industry Revenue billion Forecast, by Country 2020 & 2033
- Table 24: Global Red Biotechnology Industry Volume K Unit Forecast, by Country 2020 & 2033
- Table 25: Germany Red Biotechnology Industry Revenue (billion) Forecast, by Application 2020 & 2033
- Table 26: Germany Red Biotechnology Industry Volume (K Unit) Forecast, by Application 2020 & 2033
- Table 27: United Kingdom Red Biotechnology Industry Revenue (billion) Forecast, by Application 2020 & 2033
- Table 28: United Kingdom Red Biotechnology Industry Volume (K Unit) Forecast, by Application 2020 & 2033
- Table 29: France Red Biotechnology Industry Revenue (billion) Forecast, by Application 2020 & 2033
- Table 30: France Red Biotechnology Industry Volume (K Unit) Forecast, by Application 2020 & 2033
- Table 31: Italy Red Biotechnology Industry Revenue (billion) Forecast, by Application 2020 & 2033
- Table 32: Italy Red Biotechnology Industry Volume (K Unit) Forecast, by Application 2020 & 2033
- Table 33: Spain Red Biotechnology Industry Revenue (billion) Forecast, by Application 2020 & 2033
- Table 34: Spain Red Biotechnology Industry Volume (K Unit) Forecast, by Application 2020 & 2033
- Table 35: Rest of Europe Red Biotechnology Industry Revenue (billion) Forecast, by Application 2020 & 2033
- Table 36: Rest of Europe Red Biotechnology Industry Volume (K Unit) Forecast, by Application 2020 & 2033
- Table 37: Global Red Biotechnology Industry Revenue billion Forecast, by Product 2020 & 2033
- Table 38: Global Red Biotechnology Industry Volume K Unit Forecast, by Product 2020 & 2033
- Table 39: Global Red Biotechnology Industry Revenue billion Forecast, by End User 2020 & 2033
- Table 40: Global Red Biotechnology Industry Volume K Unit Forecast, by End User 2020 & 2033
- Table 41: Global Red Biotechnology Industry Revenue billion Forecast, by Country 2020 & 2033
- Table 42: Global Red Biotechnology Industry Volume K Unit Forecast, by Country 2020 & 2033
- Table 43: China Red Biotechnology Industry Revenue (billion) Forecast, by Application 2020 & 2033
- Table 44: China Red Biotechnology Industry Volume (K Unit) Forecast, by Application 2020 & 2033
- Table 45: Japan Red Biotechnology Industry Revenue (billion) Forecast, by Application 2020 & 2033
- Table 46: Japan Red Biotechnology Industry Volume (K Unit) Forecast, by Application 2020 & 2033
- Table 47: India Red Biotechnology Industry Revenue (billion) Forecast, by Application 2020 & 2033
- Table 48: India Red Biotechnology Industry Volume (K Unit) Forecast, by Application 2020 & 2033
- Table 49: Australia Red Biotechnology Industry Revenue (billion) Forecast, by Application 2020 & 2033
- Table 50: Australia Red Biotechnology Industry Volume (K Unit) Forecast, by Application 2020 & 2033
- Table 51: South Korea Red Biotechnology Industry Revenue (billion) Forecast, by Application 2020 & 2033
- Table 52: South Korea Red Biotechnology Industry Volume (K Unit) Forecast, by Application 2020 & 2033
- Table 53: Rest of Asia Pacific Red Biotechnology Industry Revenue (billion) Forecast, by Application 2020 & 2033
- Table 54: Rest of Asia Pacific Red Biotechnology Industry Volume (K Unit) Forecast, by Application 2020 & 2033
- Table 55: Global Red Biotechnology Industry Revenue billion Forecast, by Product 2020 & 2033
- Table 56: Global Red Biotechnology Industry Volume K Unit Forecast, by Product 2020 & 2033
- Table 57: Global Red Biotechnology Industry Revenue billion Forecast, by End User 2020 & 2033
- Table 58: Global Red Biotechnology Industry Volume K Unit Forecast, by End User 2020 & 2033
- Table 59: Global Red Biotechnology Industry Revenue billion Forecast, by Country 2020 & 2033
- Table 60: Global Red Biotechnology Industry Volume K Unit Forecast, by Country 2020 & 2033
- Table 61: GCC Red Biotechnology Industry Revenue (billion) Forecast, by Application 2020 & 2033
- Table 62: GCC Red Biotechnology Industry Volume (K Unit) Forecast, by Application 2020 & 2033
- Table 63: South Africa Red Biotechnology Industry Revenue (billion) Forecast, by Application 2020 & 2033
- Table 64: South Africa Red Biotechnology Industry Volume (K Unit) Forecast, by Application 2020 & 2033
- Table 65: Rest of Middle East and Africa Red Biotechnology Industry Revenue (billion) Forecast, by Application 2020 & 2033
- Table 66: Rest of Middle East and Africa Red Biotechnology Industry Volume (K Unit) Forecast, by Application 2020 & 2033
- Table 67: Global Red Biotechnology Industry Revenue billion Forecast, by Product 2020 & 2033
- Table 68: Global Red Biotechnology Industry Volume K Unit Forecast, by Product 2020 & 2033
- Table 69: Global Red Biotechnology Industry Revenue billion Forecast, by End User 2020 & 2033
- Table 70: Global Red Biotechnology Industry Volume K Unit Forecast, by End User 2020 & 2033
- Table 71: Global Red Biotechnology Industry Revenue billion Forecast, by Country 2020 & 2033
- Table 72: Global Red Biotechnology Industry Volume K Unit Forecast, by Country 2020 & 2033
- Table 73: Brazil Red Biotechnology Industry Revenue (billion) Forecast, by Application 2020 & 2033
- Table 74: Brazil Red Biotechnology Industry Volume (K Unit) Forecast, by Application 2020 & 2033
- Table 75: Argentina Red Biotechnology Industry Revenue (billion) Forecast, by Application 2020 & 2033
- Table 76: Argentina Red Biotechnology Industry Volume (K Unit) Forecast, by Application 2020 & 2033
- Table 77: Rest of South America Red Biotechnology Industry Revenue (billion) Forecast, by Application 2020 & 2033
- Table 78: Rest of South America Red Biotechnology Industry Volume (K Unit) Forecast, by Application 2020 & 2033
Frequently Asked Questions
1. What is the projected Compound Annual Growth Rate (CAGR) of the Red Biotechnology Industry?
The projected CAGR is approximately 10.34%.
2. Which companies are prominent players in the Red Biotechnology Industry?
Key companies in the market include Amgen Inc, Merck & Co Inc, F Hoffmann-La Roche Ltd, AstraZeneca PLC, CSL Limited, Takeda Pharmaceutical Company Limited, Bristol Myers Squibb (Celgene Corporation), Biogen Inc, Gilead Sciences Inc, Pfizer Inc.
3. What are the main segments of the Red Biotechnology Industry?
The market segments include Product, End User.
4. Can you provide details about the market size?
The market size is estimated to be USD 12.27 billion as of 2022.
5. What are some drivers contributing to market growth?
Rising Incidence and Prevalence of Chronic and Rare Diseases; Increased Funding in the Healthcare Industry.
6. What are the notable trends driving market growth?
The Biopharmaceutical Companies Segment is Expected to Hold a Significant Market Share Over the Forecast Period.
7. Are there any restraints impacting market growth?
Costly Therapeutic Technology and Machinery.
8. Can you provide examples of recent developments in the market?
June 2022: Researchers at the University of Maryland's College of Agriculture and Natural Resources found that CRISPR-Combo allows several genes to be edited in plants while altering other genes' expression. The National Institute of Food and Agriculture of the United States Food and Drug Administration helped develop this new technology, allowing genetic engineering combinations to enhance crop breeding and functionality.
9. What pricing options are available for accessing the report?
Pricing options include single-user, multi-user, and enterprise licenses priced at USD 4750, USD 5250, and USD 8750 respectively.
10. Is the market size provided in terms of value or volume?
The market size is provided in terms of value, measured in billion and volume, measured in K Unit.
11. Are there any specific market keywords associated with the report?
Yes, the market keyword associated with the report is "Red Biotechnology Industry," which aids in identifying and referencing the specific market segment covered.
12. How do I determine which pricing option suits my needs best?
The pricing options vary based on user requirements and access needs. Individual users may opt for single-user licenses, while businesses requiring broader access may choose multi-user or enterprise licenses for cost-effective access to the report.
13. Are there any additional resources or data provided in the Red Biotechnology Industry report?
While the report offers comprehensive insights, it's advisable to review the specific contents or supplementary materials provided to ascertain if additional resources or data are available.
14. How can I stay updated on further developments or reports in the Red Biotechnology Industry?
To stay informed about further developments, trends, and reports in the Red Biotechnology Industry, consider subscribing to industry newsletters, following relevant companies and organizations, or regularly checking reputable industry news sources and publications.
Methodology
Step 1 - Identification of Relevant Samples Size from Population Database


Step 2 - Approaches for Defining Global Market Size (Value, Volume* & Price*)

Note*: In applicable scenarios
Step 3 - Data Sources
Primary Research
- Web Analytics
- Survey Reports
- Research Institute
- Latest Research Reports
- Opinion Leaders
Secondary Research
- Annual Reports
- White Paper
- Latest Press Release
- Industry Association
- Paid Database
- Investor Presentations

Step 4 - Data Triangulation
Involves using different sources of information in order to increase the validity of a study
These sources are likely to be stakeholders in a program - participants, other researchers, program staff, other community members, and so on.
Then we put all data in single framework & apply various statistical tools to find out the dynamic on the market.
During the analysis stage, feedback from the stakeholder groups would be compared to determine areas of agreement as well as areas of divergence