

Key Insights
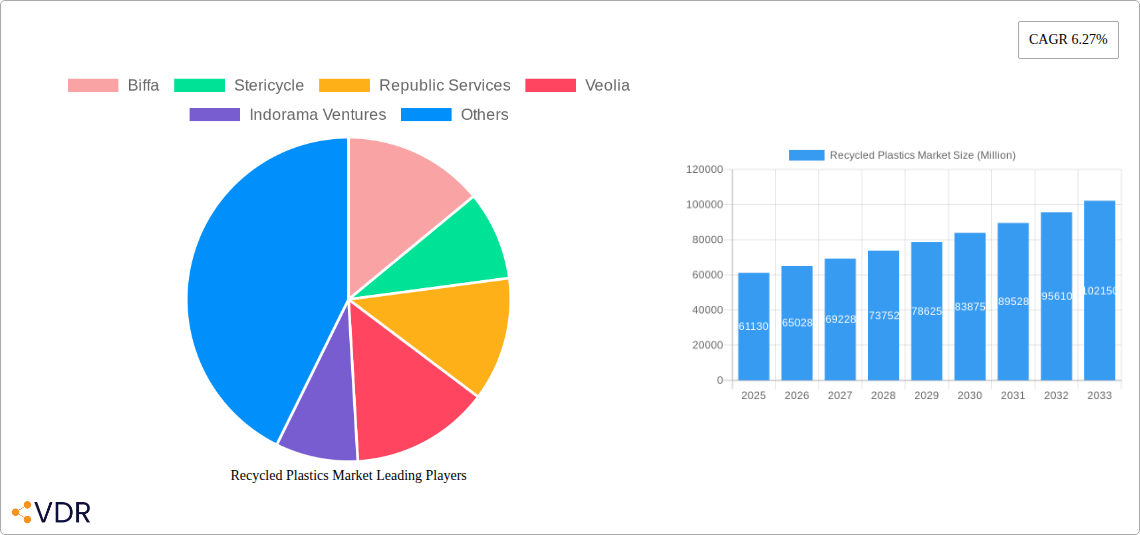
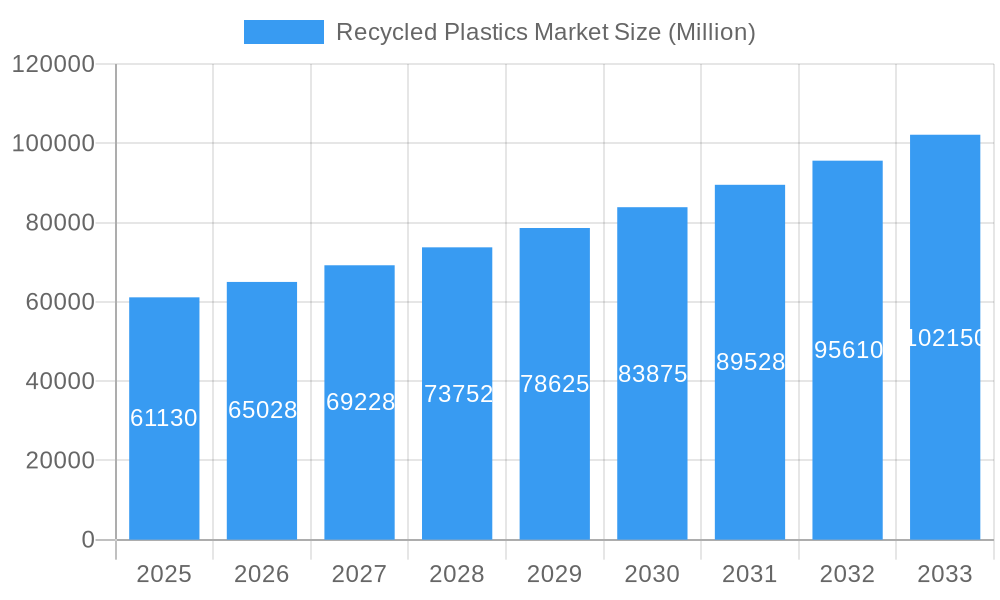
The global recycled plastics market, valued at $61.13 billion in 2025, is projected to experience robust growth, exhibiting a Compound Annual Growth Rate (CAGR) of 6.27% from 2025 to 2033. This expansion is driven by several key factors. Increasing environmental concerns and stringent government regulations regarding plastic waste are pushing businesses and consumers towards more sustainable solutions. The growing demand for recycled plastics across diverse industries, including packaging, automotive, and construction, further fuels market growth. Technological advancements in recycling processes, leading to higher quality recycled materials and increased efficiency, contribute significantly to this positive trajectory. Furthermore, the rising awareness of the circular economy and its economic benefits is incentivizing investments in recycling infrastructure and technological innovation. The market's expansion is, however, moderated by challenges such as the inconsistent quality of recycled plastics, the lack of standardized recycling processes across regions, and the higher costs associated with recycled materials compared to virgin plastics. Overcoming these hurdles will be crucial for realizing the market's full potential.
Recycled Plastics Market Market Size (In Billion)
The competitive landscape is dynamic, featuring both large multinational corporations like Biffa, Stericycle, Republic Services, and Veolia, alongside specialized players such as Indorama Ventures, Loop Industries, Plastipak Holdings, KW Plastics, B&B Plastics, and Green Line Polymers. These companies are actively engaging in strategic initiatives like mergers and acquisitions, technological advancements, and geographical expansion to strengthen their market positions. Future market growth will depend on sustained government support for recycling initiatives, technological breakthroughs improving the quality and cost-effectiveness of recycled plastics, and increased consumer demand for products made from recycled materials. Regional variations in market growth will likely be influenced by existing infrastructure, regulatory frameworks, and consumer awareness levels. The forecast period suggests a considerable market expansion, implying significant opportunities for players willing to navigate the industry’s evolving dynamics.
Recycled Plastics Market Company Market Share
Recycled Plastics Market: A Comprehensive Report (2019-2033)
This comprehensive report provides a detailed analysis of the Recycled Plastics Market, encompassing market dynamics, growth trends, regional dominance, product landscape, key players, and future outlook. The study period covers 2019-2033, with a base year of 2025 and a forecast period of 2025-2033. The report examines both the parent market (plastics recycling) and child markets (e.g., recycled PET, HDPE, etc.) to offer a holistic view of this rapidly evolving industry. The market value is presented in Million units throughout the report.
Recycled Plastics Market Dynamics & Structure
This section delves into the intricate structure of the recycled plastics market, analyzing its competitive landscape, technological advancements, regulatory influences, and market trends. The analysis incorporates quantitative data on market share, mergers & acquisitions (M&A) activity, and qualitative insights into innovation challenges and market concentration.
- Market Concentration: The recycled plastics market exhibits a moderately concentrated structure, with a few large players holding significant market share (xx%). However, a growing number of smaller, specialized companies are emerging, particularly in niche applications. The market share of the top 5 players is estimated to be xx% in 2025.
- Technological Innovation: Advancements in plastic recycling technologies, such as chemical recycling and advanced sorting techniques, are driving market growth. However, scaling up these technologies and overcoming cost barriers remain significant challenges.
- Regulatory Frameworks: Government regulations and policies promoting plastic waste reduction and recycled content mandates are creating significant growth opportunities. The impact of extended producer responsibility (EPR) schemes is analyzed in detail.
- Competitive Product Substitutes: Bioplastics and other sustainable materials pose competitive pressure. The report evaluates their impact on market share and future growth potential.
- End-User Demographics: The primary end-users of recycled plastics include packaging, automotive, construction, and textile industries. The report details the market share of each end-use sector.
- M&A Trends: The number of M&A deals in the recycled plastics sector increased significantly in the historical period (2019-2024) with xx deals recorded. This is expected to continue with xx predicted deals in the forecast period. Consolidation is a key trend, driving efficiency and scale.
Recycled Plastics Market Growth Trends & Insights
This section presents a comprehensive analysis of the recycled plastics market's growth trajectory, utilizing various analytical tools and data points to illustrate the market's evolution. It examines market size, adoption rates, technological disruptions, and shifts in consumer behavior.
The global recycled plastics market is experiencing robust growth, with a CAGR of xx% projected from 2025 to 2033. Market penetration is expected to increase from xx% in 2025 to xx% by 2033, driven by factors such as increasing environmental awareness, stringent regulations, and technological advancements. The report provides a detailed analysis of the market size evolution, examining factors such as increased recycling rates, innovative recycling technologies, and growing demand from various end-use industries. Technological disruptions such as chemical recycling are analyzed for their impact on market growth. Furthermore, the report highlights consumer preference shifts towards sustainable products as a significant growth driver.
Dominant Regions, Countries, or Segments in Recycled Plastics Market
This section identifies the leading geographical regions and market segments driving the expansion of the recycled plastics market. We explore the specific factors contributing to regional dominance and analyze the key end-use industries that are propelling this growth.
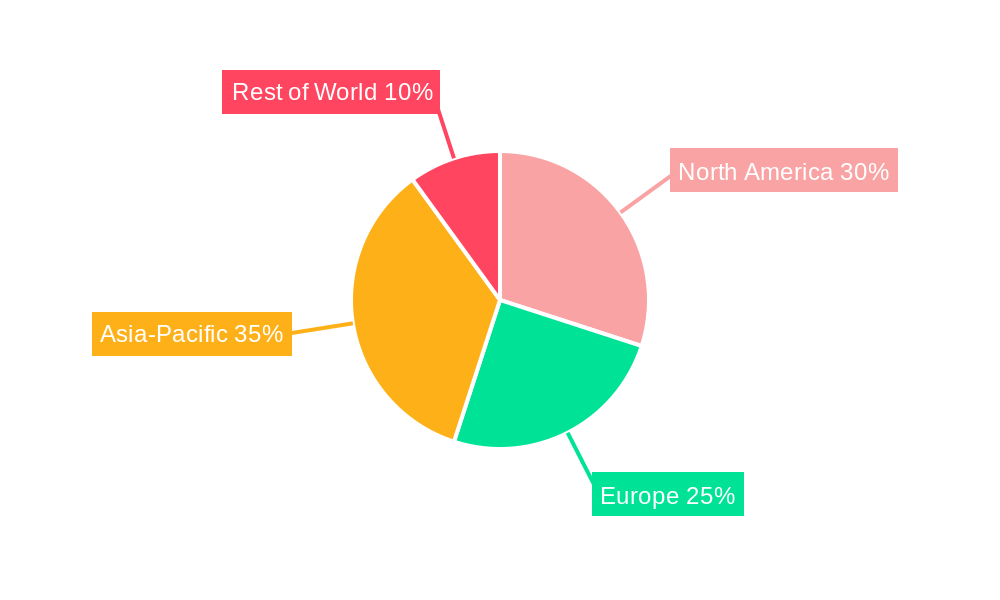
- North America and Europe: These established markets continue to lead the recycled plastics sector, underpinned by robust environmental legislation, advanced recycling infrastructure, and a strong consumer preference for eco-conscious products. The market share of North America is projected to be approximately XX%, while Europe is expected to hold around XX% of the market by 2025, reflecting their mature recycling ecosystems and proactive policy frameworks.
- Asia-Pacific: This dynamic region is anticipated to experience the most significant growth trajectory. Factors fueling this expansion include rapid industrialization, a substantial increase in plastic waste generation, and proactive government initiatives actively promoting and incentivizing plastic recycling. The projected Compound Annual Growth Rate (CAGR) for Asia-Pacific is an impressive XX%, indicating a substantial shift towards circularity.
- Emerging Markets: Other regions, including parts of Latin America and the Middle East, are beginning to show promising growth. These markets are driven by evolving environmental awareness, increasing foreign investment in sustainable solutions, and a growing recognition of the economic opportunities within the recycled plastics value chain.
- Key Drivers and Growth Catalysts: The overarching growth in these regions is propelled by a confluence of critical factors:
- Evolving Regulatory Landscapes: Increasingly stringent environmental regulations, Extended Producer Responsibility (EPR) schemes, and landfill bans are mandating the use of recycled content and driving demand.
- Heightened Consumer and Corporate Sustainability Mandates: Growing public awareness of plastic pollution and a strong corporate push towards sustainability goals are creating significant pull for recycled plastic materials.
- Advancements in Recycling Technologies: Investments in innovative mechanical and chemical recycling technologies are enhancing the quality and versatility of recycled plastics, enabling their use in more demanding applications.
- Expanding Demand from Key End-Use Sectors: Industries such as packaging (food-grade and non-food grade), automotive, construction, textiles, and electronics are increasingly incorporating recycled plastics to meet sustainability targets and reduce reliance on virgin materials.
- Development of Circular Economy Frameworks: The widespread adoption of circular economy principles and the establishment of robust collection, sorting, and processing infrastructure are fundamental to market expansion.
- Growing Investments and Collaborations: Increased investment from both private and public sectors, along with strategic partnerships across the value chain, are accelerating innovation and market penetration.
Recycled Plastics Market Product Landscape
The recycled plastics market is characterized by a diverse and expanding product portfolio, encompassing resins derived from a wide spectrum of plastic types such as PET, HDPE, PP, LDPE, PVC, and others. Each resin type possesses distinct physical and chemical properties, catering to specific performance requirements and a broad spectrum of applications. Continuous advancements in recycling technologies, particularly in purification and compounding, are enabling the production of recycled plastics with enhanced performance characteristics, rivaling virgin materials in many instances. The market's focus is increasingly on high-quality, application-specific recycled resins that offer reliable performance. Unique selling propositions for these products often center on their verified recyclability, adherence to stringent sustainability certifications (e.g., food-contact compliance, environmental product declarations), and their compelling cost-competitiveness compared to their virgin counterparts, offering a tangible economic and environmental advantage.
Key Drivers, Barriers & Challenges in Recycled Plastics Market
Key Drivers:
- Growing environmental concerns and stringent government regulations driving plastic waste reduction.
- Increasing demand for sustainable and eco-friendly products from consumers and businesses.
- Technological advancements in recycling processes enabling higher quality recycled materials.
- Cost advantages of recycled plastics compared to virgin materials in some applications.
Key Barriers & Challenges:
- Contamination of plastic waste streams affecting the quality of recycled materials.
- High capital expenditure required for advanced recycling technologies.
- Lack of efficient and cost-effective sorting and collection infrastructure in many regions.
- Fluctuations in the price of virgin plastics impacting the competitiveness of recycled materials. The price volatility is estimated to cause a xx% impact on market growth.
Emerging Opportunities in Recycled Plastics Market
- Growing demand for recycled plastics in high-value applications such as food packaging.
- Development of innovative recycling technologies enabling the recycling of complex plastic waste streams.
- Expansion of the market into developing countries with increasing plastic waste generation.
- Growing consumer preference for products made from recycled materials driving increased demand.
Growth Accelerators in the Recycled Plastics Market Industry
The long-term growth of the recycled plastics market is expected to be fueled by a confluence of factors, including continuous technological advancements leading to higher-quality recycled materials, strategic partnerships between recycling companies and brand owners fostering the development of closed-loop systems, and the expansion of recycling infrastructure into emerging markets. These factors collectively contribute to the increasing availability and affordability of recycled plastics, further driving market growth.
Key Players Shaping the Recycled Plastics Market Market
- Biffa
- Stericycle
- Republic Services
- Veolia
- Indorama Ventures
- Loop Industries
- Plastipak Holdings
- KW Plastics
- B&B Plastics
- Green Line Polymers
- List Not Exhaustive
Notable Milestones in Recycled Plastics Market Sector
- March 2024: PepsiCo unveiled its innovative snack packaging incorporating 50% recycled plastic content, underscoring a significant step towards reducing its virgin plastic footprint in the fast-moving consumer goods sector.
- February 2023: SK Geo-Centric, in collaboration with Loop Industries and SUEZ, announced plans for a pioneering plant in France dedicated to producing virgin-quality PET from 100% recycled materials. This facility, with commissioning targeted for 2027, represents a significant advancement in achieving true circularity for PET.
- January 2024: Several major automotive manufacturers announced ambitious targets for increasing the use of recycled plastics in vehicle components, signaling a strong demand shift within the automotive industry.
- November 2023: The European Union introduced new directives mandating minimum recycled content levels for plastic packaging, providing a substantial regulatory push for the adoption of recycled materials across the continent.
In-Depth Recycled Plastics Market Market Outlook
The recycled plastics market is on an accelerated growth trajectory, driven by a potent combination of surging environmental consciousness, increasingly stringent global regulations, and groundbreaking advancements in recycling technologies, including sophisticated mechanical and pioneering chemical recycling methods. Strategic alliances and collaborations among stakeholders – from raw material suppliers and recyclers to brand owners and end-users – are proving instrumental in fostering a truly circular economy for plastics. This collaborative approach is not only enhancing market efficiency but also unlocking new avenues for innovation. The market's future expansion will be significantly influenced by the development of high-value applications for recycled plastics, the creation of novel recycling solutions that address complex waste streams, and the ongoing commitment to improving the quality and consistency of recycled resin outputs. These factors collectively promise to drive substantial market growth and unlock unprecedented opportunities for sustainable plastic solutions.
Recycled Plastics Market Segmentation
-
1. Type
- 1.1. Polyethylene
- 1.2. Polyvinyl Chloride
- 1.3. Polyethylene Terephthalate
- 1.4. Polypropylene
- 1.5. Polystyrene
- 1.6. Other Types
-
2. Source
- 2.1. Foams
- 2.2. Films
- 2.3. Bottles
- 2.4. Fibers
- 2.5. Other Sources
-
3. End User
- 3.1. Building and Construction
- 3.2. Packaging
- 3.3. Electrical and Electronics
- 3.4. Automotive
- 3.5. Other End Users
Recycled Plastics Market Segmentation By Geography
-
1. North America
- 1.1. United States
- 1.2. Canada
- 1.3. Rest of North America
-
2. Europe
- 2.1. United Kingdom
- 2.2. Germany
- 2.3. France
- 2.4. Russia
- 2.5. Italy
- 2.6. Spain
- 2.7. Rest of Europe
-
3. Asia Pacific
- 3.1. India
- 3.2. China
- 3.3. Japan
- 3.4. Australia
- 3.5. Rest of Asia Pacific
-
4. South America
- 4.1. Brazil
- 4.2. Argentina
- 4.3. Rest of South America
-
5. Middle East and Africa
- 5.1. United Arab Emirates
- 5.2. South Africa
- 5.3. Rest of Middle East and Africa
Recycled Plastics Market Regional Market Share
Geographic Coverage of Recycled Plastics Market
Recycled Plastics Market REPORT HIGHLIGHTS
| Aspects | Details |
|---|---|
| Study Period | 2020-2034 |
| Base Year | 2025 |
| Estimated Year | 2026 |
| Forecast Period | 2026-2034 |
| Historical Period | 2020-2025 |
| Growth Rate | CAGR of 6.27% from 2020-2034 |
| Segmentation |
|
Table of Contents
- 1. Introduction
- 1.1. Research Scope
- 1.2. Market Segmentation
- 1.3. Research Objective
- 1.4. Definitions and Assumptions
- 2. Executive Summary
- 2.1. Market Snapshot
- 3. Market Dynamics
- 3.1. Market Drivers
- 3.2. Market Restrains
- 3.3. Market Trends
- 3.4. Market Opportunities
- 4. Market Factor Analysis
- 4.1. Porters Five Forces
- 4.1.1. Bargaining Power of Suppliers
- 4.1.2. Bargaining Power of Buyers
- 4.1.3. Threat of New Entrants
- 4.1.4. Threat of Substitutes
- 4.1.5. Competitive Rivalry
- 4.2. PESTEL analysis
- 4.3. BCG Analysis
- 4.3.1. Stars (High Growth, High Market Share)
- 4.3.2. Cash Cows (Low Growth, High Market Share)
- 4.3.3. Question Mark (High Growth, Low Market Share)
- 4.3.4. Dogs (Low Growth, Low Market Share)
- 4.4. Ansoff Matrix Analysis
- 4.5. Supply Chain Analysis
- 4.6. Regulatory Landscape
- 4.7. Current Market Potential and Opportunity Assessment (TAM–SAM–SOM Framework)
- 4.8. VDR Analyst Note
- 4.1. Porters Five Forces
- 5. Market Analysis, Insights and Forecast 2021-2033
- 5.1. Market Analysis, Insights and Forecast - by Type
- 5.1.1. Polyethylene
- 5.1.2. Polyvinyl Chloride
- 5.1.3. Polyethylene Terephthalate
- 5.1.4. Polypropylene
- 5.1.5. Polystyrene
- 5.1.6. Other Types
- 5.2. Market Analysis, Insights and Forecast - by Source
- 5.2.1. Foams
- 5.2.2. Films
- 5.2.3. Bottles
- 5.2.4. Fibers
- 5.2.5. Other Sources
- 5.3. Market Analysis, Insights and Forecast - by End User
- 5.3.1. Building and Construction
- 5.3.2. Packaging
- 5.3.3. Electrical and Electronics
- 5.3.4. Automotive
- 5.3.5. Other End Users
- 5.4. Market Analysis, Insights and Forecast - by Region
- 5.4.1. North America
- 5.4.2. Europe
- 5.4.3. Asia Pacific
- 5.4.4. South America
- 5.4.5. Middle East and Africa
- 5.1. Market Analysis, Insights and Forecast - by Type
- 6. Global Recycled Plastics Market Analysis, Insights and Forecast, 2021-2033
- 6.1. Market Analysis, Insights and Forecast - by Type
- 6.1.1. Polyethylene
- 6.1.2. Polyvinyl Chloride
- 6.1.3. Polyethylene Terephthalate
- 6.1.4. Polypropylene
- 6.1.5. Polystyrene
- 6.1.6. Other Types
- 6.2. Market Analysis, Insights and Forecast - by Source
- 6.2.1. Foams
- 6.2.2. Films
- 6.2.3. Bottles
- 6.2.4. Fibers
- 6.2.5. Other Sources
- 6.3. Market Analysis, Insights and Forecast - by End User
- 6.3.1. Building and Construction
- 6.3.2. Packaging
- 6.3.3. Electrical and Electronics
- 6.3.4. Automotive
- 6.3.5. Other End Users
- 6.1. Market Analysis, Insights and Forecast - by Type
- 7. North America Recycled Plastics Market Analysis, Insights and Forecast, 2021-2033
- 7.1. Market Analysis, Insights and Forecast - by Type
- 7.1.1. Polyethylene
- 7.1.2. Polyvinyl Chloride
- 7.1.3. Polyethylene Terephthalate
- 7.1.4. Polypropylene
- 7.1.5. Polystyrene
- 7.1.6. Other Types
- 7.2. Market Analysis, Insights and Forecast - by Source
- 7.2.1. Foams
- 7.2.2. Films
- 7.2.3. Bottles
- 7.2.4. Fibers
- 7.2.5. Other Sources
- 7.3. Market Analysis, Insights and Forecast - by End User
- 7.3.1. Building and Construction
- 7.3.2. Packaging
- 7.3.3. Electrical and Electronics
- 7.3.4. Automotive
- 7.3.5. Other End Users
- 7.1. Market Analysis, Insights and Forecast - by Type
- 8. Europe Recycled Plastics Market Analysis, Insights and Forecast, 2021-2033
- 8.1. Market Analysis, Insights and Forecast - by Type
- 8.1.1. Polyethylene
- 8.1.2. Polyvinyl Chloride
- 8.1.3. Polyethylene Terephthalate
- 8.1.4. Polypropylene
- 8.1.5. Polystyrene
- 8.1.6. Other Types
- 8.2. Market Analysis, Insights and Forecast - by Source
- 8.2.1. Foams
- 8.2.2. Films
- 8.2.3. Bottles
- 8.2.4. Fibers
- 8.2.5. Other Sources
- 8.3. Market Analysis, Insights and Forecast - by End User
- 8.3.1. Building and Construction
- 8.3.2. Packaging
- 8.3.3. Electrical and Electronics
- 8.3.4. Automotive
- 8.3.5. Other End Users
- 8.1. Market Analysis, Insights and Forecast - by Type
- 9. Asia Pacific Recycled Plastics Market Analysis, Insights and Forecast, 2021-2033
- 9.1. Market Analysis, Insights and Forecast - by Type
- 9.1.1. Polyethylene
- 9.1.2. Polyvinyl Chloride
- 9.1.3. Polyethylene Terephthalate
- 9.1.4. Polypropylene
- 9.1.5. Polystyrene
- 9.1.6. Other Types
- 9.2. Market Analysis, Insights and Forecast - by Source
- 9.2.1. Foams
- 9.2.2. Films
- 9.2.3. Bottles
- 9.2.4. Fibers
- 9.2.5. Other Sources
- 9.3. Market Analysis, Insights and Forecast - by End User
- 9.3.1. Building and Construction
- 9.3.2. Packaging
- 9.3.3. Electrical and Electronics
- 9.3.4. Automotive
- 9.3.5. Other End Users
- 9.1. Market Analysis, Insights and Forecast - by Type
- 10. South America Recycled Plastics Market Analysis, Insights and Forecast, 2021-2033
- 10.1. Market Analysis, Insights and Forecast - by Type
- 10.1.1. Polyethylene
- 10.1.2. Polyvinyl Chloride
- 10.1.3. Polyethylene Terephthalate
- 10.1.4. Polypropylene
- 10.1.5. Polystyrene
- 10.1.6. Other Types
- 10.2. Market Analysis, Insights and Forecast - by Source
- 10.2.1. Foams
- 10.2.2. Films
- 10.2.3. Bottles
- 10.2.4. Fibers
- 10.2.5. Other Sources
- 10.3. Market Analysis, Insights and Forecast - by End User
- 10.3.1. Building and Construction
- 10.3.2. Packaging
- 10.3.3. Electrical and Electronics
- 10.3.4. Automotive
- 10.3.5. Other End Users
- 10.1. Market Analysis, Insights and Forecast - by Type
- 11. Middle East and Africa Recycled Plastics Market Analysis, Insights and Forecast, 2021-2033
- 11.1. Market Analysis, Insights and Forecast - by Type
- 11.1.1. Polyethylene
- 11.1.2. Polyvinyl Chloride
- 11.1.3. Polyethylene Terephthalate
- 11.1.4. Polypropylene
- 11.1.5. Polystyrene
- 11.1.6. Other Types
- 11.2. Market Analysis, Insights and Forecast - by Source
- 11.2.1. Foams
- 11.2.2. Films
- 11.2.3. Bottles
- 11.2.4. Fibers
- 11.2.5. Other Sources
- 11.3. Market Analysis, Insights and Forecast - by End User
- 11.3.1. Building and Construction
- 11.3.2. Packaging
- 11.3.3. Electrical and Electronics
- 11.3.4. Automotive
- 11.3.5. Other End Users
- 11.1. Market Analysis, Insights and Forecast - by Type
- 12. Competitive Analysis
- 12.1. Company Profiles
- 12.1.1 Biffa
- 12.1.1.1. Company Overview
- 12.1.1.2. Products
- 12.1.1.3. Company Financials
- 12.1.1.4. SWOT Analysis
- 12.1.2 Stericycle
- 12.1.2.1. Company Overview
- 12.1.2.2. Products
- 12.1.2.3. Company Financials
- 12.1.2.4. SWOT Analysis
- 12.1.3 Republic Services
- 12.1.3.1. Company Overview
- 12.1.3.2. Products
- 12.1.3.3. Company Financials
- 12.1.3.4. SWOT Analysis
- 12.1.4 Veolia
- 12.1.4.1. Company Overview
- 12.1.4.2. Products
- 12.1.4.3. Company Financials
- 12.1.4.4. SWOT Analysis
- 12.1.5 Indorama Ventures
- 12.1.5.1. Company Overview
- 12.1.5.2. Products
- 12.1.5.3. Company Financials
- 12.1.5.4. SWOT Analysis
- 12.1.6 Loop Industries
- 12.1.6.1. Company Overview
- 12.1.6.2. Products
- 12.1.6.3. Company Financials
- 12.1.6.4. SWOT Analysis
- 12.1.7 Plastipak Holdings
- 12.1.7.1. Company Overview
- 12.1.7.2. Products
- 12.1.7.3. Company Financials
- 12.1.7.4. SWOT Analysis
- 12.1.8 KW Plastics
- 12.1.8.1. Company Overview
- 12.1.8.2. Products
- 12.1.8.3. Company Financials
- 12.1.8.4. SWOT Analysis
- 12.1.9 B&B Plastics
- 12.1.9.1. Company Overview
- 12.1.9.2. Products
- 12.1.9.3. Company Financials
- 12.1.9.4. SWOT Analysis
- 12.1.10 Green Line Polymers**List Not Exhaustive
- 12.1.10.1. Company Overview
- 12.1.10.2. Products
- 12.1.10.3. Company Financials
- 12.1.10.4. SWOT Analysis
- 12.1.1 Biffa
- 12.2. Market Entropy
- 12.2.1 Company's Key Areas Served
- 12.2.2 Recent Developments
- 12.3. Company Market Share Analysis 2025
- 12.3.1 Top 5 Companies Market Share Analysis
- 12.3.2 Top 3 Companies Market Share Analysis
- 12.4. List of Potential Customers
- 13. Research Methodology
List of Figures
- Figure 1: Global Recycled Plastics Market Revenue Breakdown (Million, %) by Region 2025 & 2033
- Figure 2: Global Recycled Plastics Market Volume Breakdown (Billion, %) by Region 2025 & 2033
- Figure 3: North America Recycled Plastics Market Revenue (Million), by Type 2025 & 2033
- Figure 4: North America Recycled Plastics Market Volume (Billion), by Type 2025 & 2033
- Figure 5: North America Recycled Plastics Market Revenue Share (%), by Type 2025 & 2033
- Figure 6: North America Recycled Plastics Market Volume Share (%), by Type 2025 & 2033
- Figure 7: North America Recycled Plastics Market Revenue (Million), by Source 2025 & 2033
- Figure 8: North America Recycled Plastics Market Volume (Billion), by Source 2025 & 2033
- Figure 9: North America Recycled Plastics Market Revenue Share (%), by Source 2025 & 2033
- Figure 10: North America Recycled Plastics Market Volume Share (%), by Source 2025 & 2033
- Figure 11: North America Recycled Plastics Market Revenue (Million), by End User 2025 & 2033
- Figure 12: North America Recycled Plastics Market Volume (Billion), by End User 2025 & 2033
- Figure 13: North America Recycled Plastics Market Revenue Share (%), by End User 2025 & 2033
- Figure 14: North America Recycled Plastics Market Volume Share (%), by End User 2025 & 2033
- Figure 15: North America Recycled Plastics Market Revenue (Million), by Country 2025 & 2033
- Figure 16: North America Recycled Plastics Market Volume (Billion), by Country 2025 & 2033
- Figure 17: North America Recycled Plastics Market Revenue Share (%), by Country 2025 & 2033
- Figure 18: North America Recycled Plastics Market Volume Share (%), by Country 2025 & 2033
- Figure 19: Europe Recycled Plastics Market Revenue (Million), by Type 2025 & 2033
- Figure 20: Europe Recycled Plastics Market Volume (Billion), by Type 2025 & 2033
- Figure 21: Europe Recycled Plastics Market Revenue Share (%), by Type 2025 & 2033
- Figure 22: Europe Recycled Plastics Market Volume Share (%), by Type 2025 & 2033
- Figure 23: Europe Recycled Plastics Market Revenue (Million), by Source 2025 & 2033
- Figure 24: Europe Recycled Plastics Market Volume (Billion), by Source 2025 & 2033
- Figure 25: Europe Recycled Plastics Market Revenue Share (%), by Source 2025 & 2033
- Figure 26: Europe Recycled Plastics Market Volume Share (%), by Source 2025 & 2033
- Figure 27: Europe Recycled Plastics Market Revenue (Million), by End User 2025 & 2033
- Figure 28: Europe Recycled Plastics Market Volume (Billion), by End User 2025 & 2033
- Figure 29: Europe Recycled Plastics Market Revenue Share (%), by End User 2025 & 2033
- Figure 30: Europe Recycled Plastics Market Volume Share (%), by End User 2025 & 2033
- Figure 31: Europe Recycled Plastics Market Revenue (Million), by Country 2025 & 2033
- Figure 32: Europe Recycled Plastics Market Volume (Billion), by Country 2025 & 2033
- Figure 33: Europe Recycled Plastics Market Revenue Share (%), by Country 2025 & 2033
- Figure 34: Europe Recycled Plastics Market Volume Share (%), by Country 2025 & 2033
- Figure 35: Asia Pacific Recycled Plastics Market Revenue (Million), by Type 2025 & 2033
- Figure 36: Asia Pacific Recycled Plastics Market Volume (Billion), by Type 2025 & 2033
- Figure 37: Asia Pacific Recycled Plastics Market Revenue Share (%), by Type 2025 & 2033
- Figure 38: Asia Pacific Recycled Plastics Market Volume Share (%), by Type 2025 & 2033
- Figure 39: Asia Pacific Recycled Plastics Market Revenue (Million), by Source 2025 & 2033
- Figure 40: Asia Pacific Recycled Plastics Market Volume (Billion), by Source 2025 & 2033
- Figure 41: Asia Pacific Recycled Plastics Market Revenue Share (%), by Source 2025 & 2033
- Figure 42: Asia Pacific Recycled Plastics Market Volume Share (%), by Source 2025 & 2033
- Figure 43: Asia Pacific Recycled Plastics Market Revenue (Million), by End User 2025 & 2033
- Figure 44: Asia Pacific Recycled Plastics Market Volume (Billion), by End User 2025 & 2033
- Figure 45: Asia Pacific Recycled Plastics Market Revenue Share (%), by End User 2025 & 2033
- Figure 46: Asia Pacific Recycled Plastics Market Volume Share (%), by End User 2025 & 2033
- Figure 47: Asia Pacific Recycled Plastics Market Revenue (Million), by Country 2025 & 2033
- Figure 48: Asia Pacific Recycled Plastics Market Volume (Billion), by Country 2025 & 2033
- Figure 49: Asia Pacific Recycled Plastics Market Revenue Share (%), by Country 2025 & 2033
- Figure 50: Asia Pacific Recycled Plastics Market Volume Share (%), by Country 2025 & 2033
- Figure 51: South America Recycled Plastics Market Revenue (Million), by Type 2025 & 2033
- Figure 52: South America Recycled Plastics Market Volume (Billion), by Type 2025 & 2033
- Figure 53: South America Recycled Plastics Market Revenue Share (%), by Type 2025 & 2033
- Figure 54: South America Recycled Plastics Market Volume Share (%), by Type 2025 & 2033
- Figure 55: South America Recycled Plastics Market Revenue (Million), by Source 2025 & 2033
- Figure 56: South America Recycled Plastics Market Volume (Billion), by Source 2025 & 2033
- Figure 57: South America Recycled Plastics Market Revenue Share (%), by Source 2025 & 2033
- Figure 58: South America Recycled Plastics Market Volume Share (%), by Source 2025 & 2033
- Figure 59: South America Recycled Plastics Market Revenue (Million), by End User 2025 & 2033
- Figure 60: South America Recycled Plastics Market Volume (Billion), by End User 2025 & 2033
- Figure 61: South America Recycled Plastics Market Revenue Share (%), by End User 2025 & 2033
- Figure 62: South America Recycled Plastics Market Volume Share (%), by End User 2025 & 2033
- Figure 63: South America Recycled Plastics Market Revenue (Million), by Country 2025 & 2033
- Figure 64: South America Recycled Plastics Market Volume (Billion), by Country 2025 & 2033
- Figure 65: South America Recycled Plastics Market Revenue Share (%), by Country 2025 & 2033
- Figure 66: South America Recycled Plastics Market Volume Share (%), by Country 2025 & 2033
- Figure 67: Middle East and Africa Recycled Plastics Market Revenue (Million), by Type 2025 & 2033
- Figure 68: Middle East and Africa Recycled Plastics Market Volume (Billion), by Type 2025 & 2033
- Figure 69: Middle East and Africa Recycled Plastics Market Revenue Share (%), by Type 2025 & 2033
- Figure 70: Middle East and Africa Recycled Plastics Market Volume Share (%), by Type 2025 & 2033
- Figure 71: Middle East and Africa Recycled Plastics Market Revenue (Million), by Source 2025 & 2033
- Figure 72: Middle East and Africa Recycled Plastics Market Volume (Billion), by Source 2025 & 2033
- Figure 73: Middle East and Africa Recycled Plastics Market Revenue Share (%), by Source 2025 & 2033
- Figure 74: Middle East and Africa Recycled Plastics Market Volume Share (%), by Source 2025 & 2033
- Figure 75: Middle East and Africa Recycled Plastics Market Revenue (Million), by End User 2025 & 2033
- Figure 76: Middle East and Africa Recycled Plastics Market Volume (Billion), by End User 2025 & 2033
- Figure 77: Middle East and Africa Recycled Plastics Market Revenue Share (%), by End User 2025 & 2033
- Figure 78: Middle East and Africa Recycled Plastics Market Volume Share (%), by End User 2025 & 2033
- Figure 79: Middle East and Africa Recycled Plastics Market Revenue (Million), by Country 2025 & 2033
- Figure 80: Middle East and Africa Recycled Plastics Market Volume (Billion), by Country 2025 & 2033
- Figure 81: Middle East and Africa Recycled Plastics Market Revenue Share (%), by Country 2025 & 2033
- Figure 82: Middle East and Africa Recycled Plastics Market Volume Share (%), by Country 2025 & 2033
List of Tables
- Table 1: Global Recycled Plastics Market Revenue Million Forecast, by Type 2020 & 2033
- Table 2: Global Recycled Plastics Market Volume Billion Forecast, by Type 2020 & 2033
- Table 3: Global Recycled Plastics Market Revenue Million Forecast, by Source 2020 & 2033
- Table 4: Global Recycled Plastics Market Volume Billion Forecast, by Source 2020 & 2033
- Table 5: Global Recycled Plastics Market Revenue Million Forecast, by End User 2020 & 2033
- Table 6: Global Recycled Plastics Market Volume Billion Forecast, by End User 2020 & 2033
- Table 7: Global Recycled Plastics Market Revenue Million Forecast, by Region 2020 & 2033
- Table 8: Global Recycled Plastics Market Volume Billion Forecast, by Region 2020 & 2033
- Table 9: Global Recycled Plastics Market Revenue Million Forecast, by Type 2020 & 2033
- Table 10: Global Recycled Plastics Market Volume Billion Forecast, by Type 2020 & 2033
- Table 11: Global Recycled Plastics Market Revenue Million Forecast, by Source 2020 & 2033
- Table 12: Global Recycled Plastics Market Volume Billion Forecast, by Source 2020 & 2033
- Table 13: Global Recycled Plastics Market Revenue Million Forecast, by End User 2020 & 2033
- Table 14: Global Recycled Plastics Market Volume Billion Forecast, by End User 2020 & 2033
- Table 15: Global Recycled Plastics Market Revenue Million Forecast, by Country 2020 & 2033
- Table 16: Global Recycled Plastics Market Volume Billion Forecast, by Country 2020 & 2033
- Table 17: United States Recycled Plastics Market Revenue (Million) Forecast, by Application 2020 & 2033
- Table 18: United States Recycled Plastics Market Volume (Billion) Forecast, by Application 2020 & 2033
- Table 19: Canada Recycled Plastics Market Revenue (Million) Forecast, by Application 2020 & 2033
- Table 20: Canada Recycled Plastics Market Volume (Billion) Forecast, by Application 2020 & 2033
- Table 21: Rest of North America Recycled Plastics Market Revenue (Million) Forecast, by Application 2020 & 2033
- Table 22: Rest of North America Recycled Plastics Market Volume (Billion) Forecast, by Application 2020 & 2033
- Table 23: Global Recycled Plastics Market Revenue Million Forecast, by Type 2020 & 2033
- Table 24: Global Recycled Plastics Market Volume Billion Forecast, by Type 2020 & 2033
- Table 25: Global Recycled Plastics Market Revenue Million Forecast, by Source 2020 & 2033
- Table 26: Global Recycled Plastics Market Volume Billion Forecast, by Source 2020 & 2033
- Table 27: Global Recycled Plastics Market Revenue Million Forecast, by End User 2020 & 2033
- Table 28: Global Recycled Plastics Market Volume Billion Forecast, by End User 2020 & 2033
- Table 29: Global Recycled Plastics Market Revenue Million Forecast, by Country 2020 & 2033
- Table 30: Global Recycled Plastics Market Volume Billion Forecast, by Country 2020 & 2033
- Table 31: United Kingdom Recycled Plastics Market Revenue (Million) Forecast, by Application 2020 & 2033
- Table 32: United Kingdom Recycled Plastics Market Volume (Billion) Forecast, by Application 2020 & 2033
- Table 33: Germany Recycled Plastics Market Revenue (Million) Forecast, by Application 2020 & 2033
- Table 34: Germany Recycled Plastics Market Volume (Billion) Forecast, by Application 2020 & 2033
- Table 35: France Recycled Plastics Market Revenue (Million) Forecast, by Application 2020 & 2033
- Table 36: France Recycled Plastics Market Volume (Billion) Forecast, by Application 2020 & 2033
- Table 37: Russia Recycled Plastics Market Revenue (Million) Forecast, by Application 2020 & 2033
- Table 38: Russia Recycled Plastics Market Volume (Billion) Forecast, by Application 2020 & 2033
- Table 39: Italy Recycled Plastics Market Revenue (Million) Forecast, by Application 2020 & 2033
- Table 40: Italy Recycled Plastics Market Volume (Billion) Forecast, by Application 2020 & 2033
- Table 41: Spain Recycled Plastics Market Revenue (Million) Forecast, by Application 2020 & 2033
- Table 42: Spain Recycled Plastics Market Volume (Billion) Forecast, by Application 2020 & 2033
- Table 43: Rest of Europe Recycled Plastics Market Revenue (Million) Forecast, by Application 2020 & 2033
- Table 44: Rest of Europe Recycled Plastics Market Volume (Billion) Forecast, by Application 2020 & 2033
- Table 45: Global Recycled Plastics Market Revenue Million Forecast, by Type 2020 & 2033
- Table 46: Global Recycled Plastics Market Volume Billion Forecast, by Type 2020 & 2033
- Table 47: Global Recycled Plastics Market Revenue Million Forecast, by Source 2020 & 2033
- Table 48: Global Recycled Plastics Market Volume Billion Forecast, by Source 2020 & 2033
- Table 49: Global Recycled Plastics Market Revenue Million Forecast, by End User 2020 & 2033
- Table 50: Global Recycled Plastics Market Volume Billion Forecast, by End User 2020 & 2033
- Table 51: Global Recycled Plastics Market Revenue Million Forecast, by Country 2020 & 2033
- Table 52: Global Recycled Plastics Market Volume Billion Forecast, by Country 2020 & 2033
- Table 53: India Recycled Plastics Market Revenue (Million) Forecast, by Application 2020 & 2033
- Table 54: India Recycled Plastics Market Volume (Billion) Forecast, by Application 2020 & 2033
- Table 55: China Recycled Plastics Market Revenue (Million) Forecast, by Application 2020 & 2033
- Table 56: China Recycled Plastics Market Volume (Billion) Forecast, by Application 2020 & 2033
- Table 57: Japan Recycled Plastics Market Revenue (Million) Forecast, by Application 2020 & 2033
- Table 58: Japan Recycled Plastics Market Volume (Billion) Forecast, by Application 2020 & 2033
- Table 59: Australia Recycled Plastics Market Revenue (Million) Forecast, by Application 2020 & 2033
- Table 60: Australia Recycled Plastics Market Volume (Billion) Forecast, by Application 2020 & 2033
- Table 61: Rest of Asia Pacific Recycled Plastics Market Revenue (Million) Forecast, by Application 2020 & 2033
- Table 62: Rest of Asia Pacific Recycled Plastics Market Volume (Billion) Forecast, by Application 2020 & 2033
- Table 63: Global Recycled Plastics Market Revenue Million Forecast, by Type 2020 & 2033
- Table 64: Global Recycled Plastics Market Volume Billion Forecast, by Type 2020 & 2033
- Table 65: Global Recycled Plastics Market Revenue Million Forecast, by Source 2020 & 2033
- Table 66: Global Recycled Plastics Market Volume Billion Forecast, by Source 2020 & 2033
- Table 67: Global Recycled Plastics Market Revenue Million Forecast, by End User 2020 & 2033
- Table 68: Global Recycled Plastics Market Volume Billion Forecast, by End User 2020 & 2033
- Table 69: Global Recycled Plastics Market Revenue Million Forecast, by Country 2020 & 2033
- Table 70: Global Recycled Plastics Market Volume Billion Forecast, by Country 2020 & 2033
- Table 71: Brazil Recycled Plastics Market Revenue (Million) Forecast, by Application 2020 & 2033
- Table 72: Brazil Recycled Plastics Market Volume (Billion) Forecast, by Application 2020 & 2033
- Table 73: Argentina Recycled Plastics Market Revenue (Million) Forecast, by Application 2020 & 2033
- Table 74: Argentina Recycled Plastics Market Volume (Billion) Forecast, by Application 2020 & 2033
- Table 75: Rest of South America Recycled Plastics Market Revenue (Million) Forecast, by Application 2020 & 2033
- Table 76: Rest of South America Recycled Plastics Market Volume (Billion) Forecast, by Application 2020 & 2033
- Table 77: Global Recycled Plastics Market Revenue Million Forecast, by Type 2020 & 2033
- Table 78: Global Recycled Plastics Market Volume Billion Forecast, by Type 2020 & 2033
- Table 79: Global Recycled Plastics Market Revenue Million Forecast, by Source 2020 & 2033
- Table 80: Global Recycled Plastics Market Volume Billion Forecast, by Source 2020 & 2033
- Table 81: Global Recycled Plastics Market Revenue Million Forecast, by End User 2020 & 2033
- Table 82: Global Recycled Plastics Market Volume Billion Forecast, by End User 2020 & 2033
- Table 83: Global Recycled Plastics Market Revenue Million Forecast, by Country 2020 & 2033
- Table 84: Global Recycled Plastics Market Volume Billion Forecast, by Country 2020 & 2033
- Table 85: United Arab Emirates Recycled Plastics Market Revenue (Million) Forecast, by Application 2020 & 2033
- Table 86: United Arab Emirates Recycled Plastics Market Volume (Billion) Forecast, by Application 2020 & 2033
- Table 87: South Africa Recycled Plastics Market Revenue (Million) Forecast, by Application 2020 & 2033
- Table 88: South Africa Recycled Plastics Market Volume (Billion) Forecast, by Application 2020 & 2033
- Table 89: Rest of Middle East and Africa Recycled Plastics Market Revenue (Million) Forecast, by Application 2020 & 2033
- Table 90: Rest of Middle East and Africa Recycled Plastics Market Volume (Billion) Forecast, by Application 2020 & 2033
Frequently Asked Questions
1. What is the projected Compound Annual Growth Rate (CAGR) of the Recycled Plastics Market?
The projected CAGR is approximately 6.27%.
2. Which companies are prominent players in the Recycled Plastics Market?
Key companies in the market include Biffa, Stericycle, Republic Services, Veolia, Indorama Ventures, Loop Industries, Plastipak Holdings, KW Plastics, B&B Plastics, Green Line Polymers**List Not Exhaustive.
3. What are the main segments of the Recycled Plastics Market?
The market segments include Type, Source, End User.
4. Can you provide details about the market size?
The market size is estimated to be USD 61.13 Million as of 2022.
5. What are some drivers contributing to market growth?
Increasing Awareness Regarding Sustainable Plastic Waste Management; Implementation of Restrictions on Landfills.
6. What are the notable trends driving market growth?
Increasing Adoption of Recycled Plastic in Packaging Industries.
7. Are there any restraints impacting market growth?
Increasing Awareness Regarding Sustainable Plastic Waste Management; Implementation of Restrictions on Landfills.
8. Can you provide examples of recent developments in the market?
March 2024: PepsiCo, in collaboration with its partners in the flexible food packaging supply chain, unveiled a line of premium snack packaging boasting a significant 50% recycled plastic content. This innovative packaging, meeting rigorous food-contact standards, debuted with PepsiCo's Sunbites brand, initially hitting the shelves in the United Kingdom and Ireland.February 2023: SK Geo-Centric, Loop Industries, and SUEZ announced their selection of the Grand Est region in France to manufacture virgin-quality PET plastic exclusively from 100% recycled materials. The trio plans to commence construction in early 2025, targeting a plant commissioning by 2027.
9. What pricing options are available for accessing the report?
Pricing options include single-user, multi-user, and enterprise licenses priced at USD 4750, USD 5250, and USD 8750 respectively.
10. Is the market size provided in terms of value or volume?
The market size is provided in terms of value, measured in Million and volume, measured in Billion.
11. Are there any specific market keywords associated with the report?
Yes, the market keyword associated with the report is "Recycled Plastics Market," which aids in identifying and referencing the specific market segment covered.
12. How do I determine which pricing option suits my needs best?
The pricing options vary based on user requirements and access needs. Individual users may opt for single-user licenses, while businesses requiring broader access may choose multi-user or enterprise licenses for cost-effective access to the report.
13. Are there any additional resources or data provided in the Recycled Plastics Market report?
While the report offers comprehensive insights, it's advisable to review the specific contents or supplementary materials provided to ascertain if additional resources or data are available.
14. How can I stay updated on further developments or reports in the Recycled Plastics Market?
To stay informed about further developments, trends, and reports in the Recycled Plastics Market, consider subscribing to industry newsletters, following relevant companies and organizations, or regularly checking reputable industry news sources and publications.
Methodology
Step 1 - Identification of Relevant Samples Size from Population Database


Step 2 - Approaches for Defining Global Market Size (Value, Volume* & Price*)

Note*: In applicable scenarios
Step 3 - Data Sources
Primary Research
- Web Analytics
- Survey Reports
- Research Institute
- Latest Research Reports
- Opinion Leaders
Secondary Research
- Annual Reports
- White Paper
- Latest Press Release
- Industry Association
- Paid Database
- Investor Presentations

Step 4 - Data Triangulation
Involves using different sources of information in order to increase the validity of a study
These sources are likely to be stakeholders in a program - participants, other researchers, program staff, other community members, and so on.
Then we put all data in single framework & apply various statistical tools to find out the dynamic on the market.
During the analysis stage, feedback from the stakeholder groups would be compared to determine areas of agreement as well as areas of divergence