
Key Insights
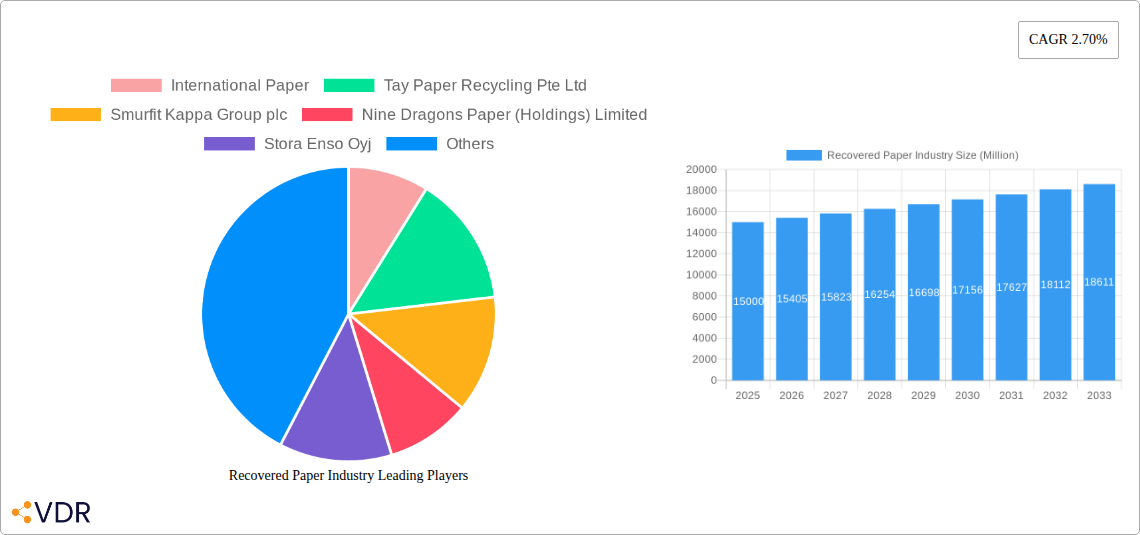
The recovered paper industry, exhibiting a CAGR of 2.70%, presents a significant market opportunity. Driven by increasing environmental consciousness, stricter regulations on landfill waste, and the rising demand for sustainable packaging solutions, the market is experiencing robust growth. Key segments, such as printing and writing paper, newsprint, and tissue, are witnessing considerable traction, fueled by the growing preference for recycled content in various applications. The containerboard segment is particularly noteworthy, driven by the e-commerce boom and the consequent surge in demand for corrugated boxes. Major players like International Paper, Smurfit Kappa, and Nine Dragons Paper are strategically investing in expanding their recycling capacities and technological advancements to capitalize on this expanding market. Geographic distribution reveals North America and Europe as mature markets, while the Asia-Pacific region, particularly China and India, demonstrates substantial growth potential due to rapid industrialization and increasing urbanization. However, fluctuating raw material prices and challenges associated with consistent quality control of recovered paper remain significant restraints.
Furthermore, the industry is witnessing the adoption of advanced technologies like automated sorting systems and improved pulping processes to enhance efficiency and the quality of recycled fibers. This technological advancement contributes to the overall cost-effectiveness and sustainability of recovered paper production. The industry's future trajectory will be significantly influenced by government policies promoting recycling and sustainable practices, along with evolving consumer preferences toward eco-friendly products. The continuous innovation in recycling technologies and the expansion of the global recycling infrastructure will play a crucial role in shaping the market's growth trajectory in the coming years. This ongoing transformation highlights the recovered paper industry's crucial role in the circular economy and its potential for sustainable development.
Recovered Paper Industry Market Report: 2019-2033
This comprehensive report provides an in-depth analysis of the Recovered Paper Industry, encompassing market dynamics, growth trends, key players, and future outlook. The study period covers 2019-2033, with 2025 as the base and estimated year. The report leverages extensive primary and secondary research to deliver actionable insights for industry professionals, investors, and strategic decision-makers. The total market size is projected to reach xx Million by 2033.
Recovered Paper Industry Market Dynamics & Structure
The recovered paper industry is characterized by a moderately consolidated market structure, with key players like International Paper, Smurfit Kappa Group plc, and Nine Dragons Paper (Holdings) Limited holding significant market share. Market concentration is influenced by economies of scale, technological advancements, and access to raw materials. The industry is subject to evolving regulatory frameworks focused on recycling targets and waste management. Technological innovations, particularly in sorting and pulping technologies, drive efficiency and quality improvements. However, barriers to entry remain high, particularly for new entrants facing established players with extensive infrastructure and supply chains. Substitutes, such as virgin fiber, compete based on cost and sustainability concerns. The industry experiences frequent M&A activity, with deal volumes averaging xx Million annually during the historical period (2019-2024), driven by strategies to expand capacity, enhance geographical reach, and secure access to raw materials.
- Market Concentration: High (Top 5 players hold xx% market share in 2025)
- Technological Innovation: Significant advancements in sorting and pulping driving efficiency gains.
- Regulatory Frameworks: Increasingly stringent environmental regulations impacting operational costs and investment decisions.
- Competitive Product Substitutes: Virgin fiber presents a significant alternative, impacting pricing and demand.
- M&A Trends: Consolidation continues, with an average of xx M&A deals annually (2019-2024) valued at xx Million.
- End-User Demographics: Primarily driven by packaging and printing/writing paper demands.
Recovered Paper Industry Growth Trends & Insights
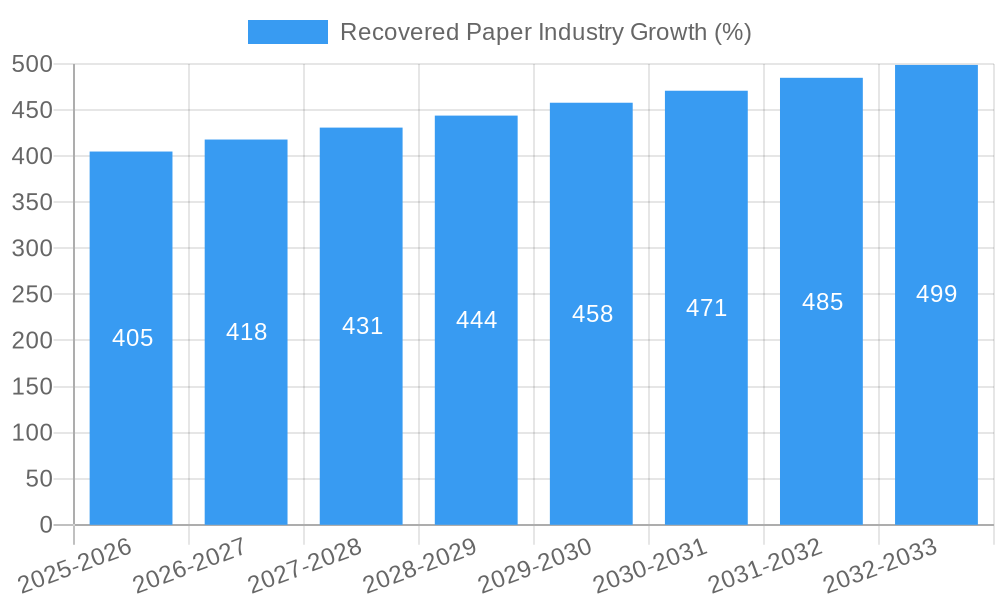
The global recovered paper market exhibited steady growth during the historical period (2019-2024), driven by increasing demand from packaging applications, particularly corrugated boxes. The market size grew from xx Million in 2019 to xx Million in 2024, exhibiting a CAGR of xx%. This growth is projected to continue during the forecast period (2025-2033), with a projected CAGR of xx%, reaching xx Million by 2033. This expansion is fueled by rising environmental awareness, stringent government regulations promoting recycling, and the increasing demand for sustainable packaging solutions. Technological advancements in paper recycling processes, enabling higher quality recycled fiber production, further contribute to market expansion. Consumer behavior shifts towards eco-friendly products are bolstering demand for recycled paper-based products. However, fluctuations in raw material prices and economic downturns could potentially impact growth trajectories.
Dominant Regions, Countries, or Segments in Recovered Paper Industry
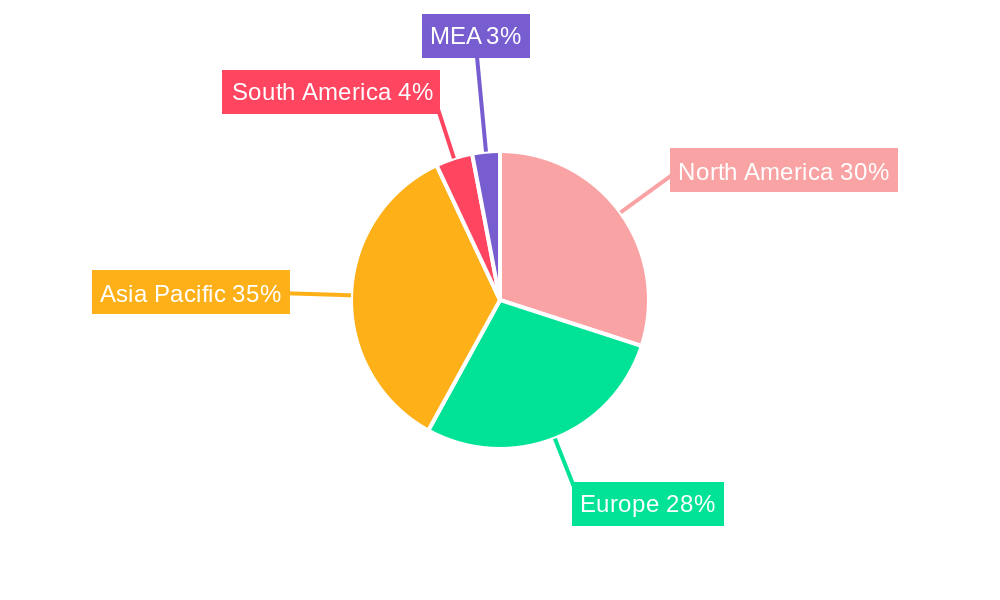
North America and Europe are the dominant regions in the global recovered paper market, holding the largest market shares due to well-established recycling infrastructure, stringent environmental regulations, and high demand from packaging and printing industries. Within these regions, countries like the United States, Germany, and the United Kingdom are major contributors. By segment type, containerboard is the largest segment, driven by its significant application in packaging, representing xx% of the market in 2025.
- North America: High recycling rates and robust packaging industry drive strong growth.
- Europe: Stringent environmental regulations and a focus on sustainability fuel demand.
- Asia-Pacific: Rapid economic growth and expanding packaging sector contribute to rising consumption.
- Containerboard: Dominant segment due to extensive use in corrugated packaging. Projected growth of xx% CAGR (2025-2033).
- Printing and Writing Paper: Facing declining demand due to digitalization, but still a sizable segment.
Recovered Paper Industry Product Landscape
Recovered paper products are categorized based on their application and quality. Advancements in pulping and de-inking technologies have significantly improved the quality of recycled fiber, enabling its use in a wider range of paper grades. Product innovations focus on improving fiber strength, brightness, and printability. This leads to the development of higher-quality recycled papers suitable for various applications, including packaging, printing, and tissue products. Key selling propositions include sustainability, cost-effectiveness, and reduced environmental impact.
Key Drivers, Barriers & Challenges in Recovered Paper Industry
Key Drivers:
- Growing environmental consciousness and increased focus on sustainable packaging solutions.
- Stringent government regulations and recycling targets in many countries.
- Rise in e-commerce and demand for corrugated packaging.
Key Challenges:
- Fluctuations in raw material prices, impacting profitability.
- Contamination of recovered paper streams, reducing the quality of recycled fiber.
- Competition from virgin fiber and alternative packaging materials.
- Supply chain disruptions and logistics challenges.
Emerging Opportunities in Recovered Paper Industry
Emerging opportunities lie in expanding applications of recycled fiber in high-value paper grades, such as specialty papers and packaging materials. Untapped markets in developing economies offer significant growth potential. Furthermore, advancements in de-inking and pulping technologies are opening avenues to recycle more challenging paper types. Innovation in bio-based coatings and functionalized papers adds value and expands application possibilities.
Growth Accelerators in the Recovered Paper Industry Industry
Technological advancements in sorting and pulping, driving higher quality recycled fiber, and strategic partnerships for enhanced supply chain efficiency are key growth accelerators. Expansion into new geographic markets with promising recycling infrastructure and governmental support offers long-term growth opportunities. The increasing adoption of sustainable packaging solutions across various industries is another prominent growth catalyst.
Key Players Shaping the Recovered Paper Industry Market
- International Paper
- Tay Paper Recycling Pte Ltd
- Smurfit Kappa Group plc
- Nine Dragons Paper (Holdings) Limited
- Stora Enso Oyj
- S A Industrias Celulosa Aragonesa (SAICA)
- Visy Industrie
- DS Smith Plc
Notable Milestones in Recovered Paper Industry Sector
- 2021: International Paper announces significant investment in a new recycled paper mill.
- 2022: Smurfit Kappa launches a new line of sustainable packaging solutions utilizing recycled content.
- 2023: New EU regulations on packaging waste increase demand for recycled paper.
- 2024: Several significant M&A transactions reshape the industry landscape.
In-Depth Recovered Paper Industry Market Outlook
The recovered paper industry is poised for continued growth driven by environmental concerns, regulatory pressures, and the burgeoning demand for sustainable packaging. Strategic investments in advanced recycling technologies and expansion into new geographic markets will further shape the industry landscape. Companies that successfully adapt to evolving consumer preferences and embrace sustainable practices are best positioned to capitalize on the future growth opportunities.
Recovered Paper Industry Segmentation
-
1. Type
- 1.1. Printing and Writing Paper
- 1.2. Newsprint
- 1.3. Tissue
- 1.4. Containerboard
- 1.5. Other Types
Recovered Paper Industry Segmentation By Geography
- 1. North America
- 2. Europe
- 3. Asia Pacific
- 4. Latin America
- 5. Middle East and Africa
Recovered Paper Industry REPORT HIGHLIGHTS
| Aspects | Details |
|---|---|
| Study Period | 2019-2033 |
| Base Year | 2024 |
| Estimated Year | 2025 |
| Forecast Period | 2025-2033 |
| Historical Period | 2019-2024 |
| Growth Rate | CAGR of 2.70% from 2019-2033 |
| Segmentation |
|
Table of Contents
- 1. Introduction
- 1.1. Research Scope
- 1.2. Market Segmentation
- 1.3. Research Methodology
- 1.4. Definitions and Assumptions
- 2. Executive Summary
- 2.1. Introduction
- 3. Market Dynamics
- 3.1. Introduction
- 3.2. Market Drivers
- 3.2.1. Growth in E-commerce Sales in China; Rising Demand from the Food-service Sector; Growing Consumer Awareness on Paper Packaging; Recycling Initiatives Involving Closed-loop Systems to Aid Market Adoption of Paper Packaging-based Materials
- 3.3. Market Restrains
- 3.3.1 Recycling
- 3.3.2 Raw Material Supply Chain Management
- 3.3.3 and Challenges in the Paper Packaging Industry; Effects of Deforestation on Paper Packaging; Increasing Raw Material Costs and Outsourcing
- 3.4. Market Trends
- 3.4.1. Containerboard to Dominate the Market
- 4. Market Factor Analysis
- 4.1. Porters Five Forces
- 4.2. Supply/Value Chain
- 4.3. PESTEL analysis
- 4.4. Market Entropy
- 4.5. Patent/Trademark Analysis
- 5. Global Recovered Paper Industry Analysis, Insights and Forecast, 2019-2031
- 5.1. Market Analysis, Insights and Forecast - by Type
- 5.1.1. Printing and Writing Paper
- 5.1.2. Newsprint
- 5.1.3. Tissue
- 5.1.4. Containerboard
- 5.1.5. Other Types
- 5.2. Market Analysis, Insights and Forecast - by Region
- 5.2.1. North America
- 5.2.2. Europe
- 5.2.3. Asia Pacific
- 5.2.4. Latin America
- 5.2.5. Middle East and Africa
- 5.1. Market Analysis, Insights and Forecast - by Type
- 6. North America Recovered Paper Industry Analysis, Insights and Forecast, 2019-2031
- 6.1. Market Analysis, Insights and Forecast - by Type
- 6.1.1. Printing and Writing Paper
- 6.1.2. Newsprint
- 6.1.3. Tissue
- 6.1.4. Containerboard
- 6.1.5. Other Types
- 6.1. Market Analysis, Insights and Forecast - by Type
- 7. Europe Recovered Paper Industry Analysis, Insights and Forecast, 2019-2031
- 7.1. Market Analysis, Insights and Forecast - by Type
- 7.1.1. Printing and Writing Paper
- 7.1.2. Newsprint
- 7.1.3. Tissue
- 7.1.4. Containerboard
- 7.1.5. Other Types
- 7.1. Market Analysis, Insights and Forecast - by Type
- 8. Asia Pacific Recovered Paper Industry Analysis, Insights and Forecast, 2019-2031
- 8.1. Market Analysis, Insights and Forecast - by Type
- 8.1.1. Printing and Writing Paper
- 8.1.2. Newsprint
- 8.1.3. Tissue
- 8.1.4. Containerboard
- 8.1.5. Other Types
- 8.1. Market Analysis, Insights and Forecast - by Type
- 9. Latin America Recovered Paper Industry Analysis, Insights and Forecast, 2019-2031
- 9.1. Market Analysis, Insights and Forecast - by Type
- 9.1.1. Printing and Writing Paper
- 9.1.2. Newsprint
- 9.1.3. Tissue
- 9.1.4. Containerboard
- 9.1.5. Other Types
- 9.1. Market Analysis, Insights and Forecast - by Type
- 10. Middle East and Africa Recovered Paper Industry Analysis, Insights and Forecast, 2019-2031
- 10.1. Market Analysis, Insights and Forecast - by Type
- 10.1.1. Printing and Writing Paper
- 10.1.2. Newsprint
- 10.1.3. Tissue
- 10.1.4. Containerboard
- 10.1.5. Other Types
- 10.1. Market Analysis, Insights and Forecast - by Type
- 11. North America Recovered Paper Industry Analysis, Insights and Forecast, 2019-2031
- 11.1. Market Analysis, Insights and Forecast - By Country/Sub-region
- 11.1.1 United States
- 11.1.2 Canada
- 11.1.3 Mexico
- 12. Europe Recovered Paper Industry Analysis, Insights and Forecast, 2019-2031
- 12.1. Market Analysis, Insights and Forecast - By Country/Sub-region
- 12.1.1 Germany
- 12.1.2 United Kingdom
- 12.1.3 France
- 12.1.4 Spain
- 12.1.5 Italy
- 12.1.6 Spain
- 12.1.7 Belgium
- 12.1.8 Netherland
- 12.1.9 Nordics
- 12.1.10 Rest of Europe
- 13. Asia Pacific Recovered Paper Industry Analysis, Insights and Forecast, 2019-2031
- 13.1. Market Analysis, Insights and Forecast - By Country/Sub-region
- 13.1.1 China
- 13.1.2 Japan
- 13.1.3 India
- 13.1.4 South Korea
- 13.1.5 Southeast Asia
- 13.1.6 Australia
- 13.1.7 Indonesia
- 13.1.8 Phillipes
- 13.1.9 Singapore
- 13.1.10 Thailandc
- 13.1.11 Rest of Asia Pacific
- 14. South America Recovered Paper Industry Analysis, Insights and Forecast, 2019-2031
- 14.1. Market Analysis, Insights and Forecast - By Country/Sub-region
- 14.1.1 Brazil
- 14.1.2 Argentina
- 14.1.3 Peru
- 14.1.4 Chile
- 14.1.5 Colombia
- 14.1.6 Ecuador
- 14.1.7 Venezuela
- 14.1.8 Rest of South America
- 15. North America Recovered Paper Industry Analysis, Insights and Forecast, 2019-2031
- 15.1. Market Analysis, Insights and Forecast - By Country/Sub-region
- 15.1.1 United States
- 15.1.2 Canada
- 15.1.3 Mexico
- 16. MEA Recovered Paper Industry Analysis, Insights and Forecast, 2019-2031
- 16.1. Market Analysis, Insights and Forecast - By Country/Sub-region
- 16.1.1 United Arab Emirates
- 16.1.2 Saudi Arabia
- 16.1.3 South Africa
- 16.1.4 Rest of Middle East and Africa
- 17. Competitive Analysis
- 17.1. Global Market Share Analysis 2024
- 17.2. Company Profiles
- 17.2.1 International Paper
- 17.2.1.1. Overview
- 17.2.1.2. Products
- 17.2.1.3. SWOT Analysis
- 17.2.1.4. Recent Developments
- 17.2.1.5. Financials (Based on Availability)
- 17.2.2 Tay Paper Recycling Pte Ltd
- 17.2.2.1. Overview
- 17.2.2.2. Products
- 17.2.2.3. SWOT Analysis
- 17.2.2.4. Recent Developments
- 17.2.2.5. Financials (Based on Availability)
- 17.2.3 Smurfit Kappa Group plc
- 17.2.3.1. Overview
- 17.2.3.2. Products
- 17.2.3.3. SWOT Analysis
- 17.2.3.4. Recent Developments
- 17.2.3.5. Financials (Based on Availability)
- 17.2.4 Nine Dragons Paper (Holdings) Limited
- 17.2.4.1. Overview
- 17.2.4.2. Products
- 17.2.4.3. SWOT Analysis
- 17.2.4.4. Recent Developments
- 17.2.4.5. Financials (Based on Availability)
- 17.2.5 Stora Enso Oyj
- 17.2.5.1. Overview
- 17.2.5.2. Products
- 17.2.5.3. SWOT Analysis
- 17.2.5.4. Recent Developments
- 17.2.5.5. Financials (Based on Availability)
- 17.2.6 S A Industrias Celulosa Aragonesa (SAICA)
- 17.2.6.1. Overview
- 17.2.6.2. Products
- 17.2.6.3. SWOT Analysis
- 17.2.6.4. Recent Developments
- 17.2.6.5. Financials (Based on Availability)
- 17.2.7 Visy Industrie
- 17.2.7.1. Overview
- 17.2.7.2. Products
- 17.2.7.3. SWOT Analysis
- 17.2.7.4. Recent Developments
- 17.2.7.5. Financials (Based on Availability)
- 17.2.8 DS Smith Plc
- 17.2.8.1. Overview
- 17.2.8.2. Products
- 17.2.8.3. SWOT Analysis
- 17.2.8.4. Recent Developments
- 17.2.8.5. Financials (Based on Availability)
- 17.2.1 International Paper
List of Figures
- Figure 1: Global Recovered Paper Industry Revenue Breakdown (Million, %) by Region 2024 & 2032
- Figure 2: North America Recovered Paper Industry Revenue (Million), by Country 2024 & 2032
- Figure 3: North America Recovered Paper Industry Revenue Share (%), by Country 2024 & 2032
- Figure 4: Europe Recovered Paper Industry Revenue (Million), by Country 2024 & 2032
- Figure 5: Europe Recovered Paper Industry Revenue Share (%), by Country 2024 & 2032
- Figure 6: Asia Pacific Recovered Paper Industry Revenue (Million), by Country 2024 & 2032
- Figure 7: Asia Pacific Recovered Paper Industry Revenue Share (%), by Country 2024 & 2032
- Figure 8: South America Recovered Paper Industry Revenue (Million), by Country 2024 & 2032
- Figure 9: South America Recovered Paper Industry Revenue Share (%), by Country 2024 & 2032
- Figure 10: North America Recovered Paper Industry Revenue (Million), by Country 2024 & 2032
- Figure 11: North America Recovered Paper Industry Revenue Share (%), by Country 2024 & 2032
- Figure 12: MEA Recovered Paper Industry Revenue (Million), by Country 2024 & 2032
- Figure 13: MEA Recovered Paper Industry Revenue Share (%), by Country 2024 & 2032
- Figure 14: North America Recovered Paper Industry Revenue (Million), by Type 2024 & 2032
- Figure 15: North America Recovered Paper Industry Revenue Share (%), by Type 2024 & 2032
- Figure 16: North America Recovered Paper Industry Revenue (Million), by Country 2024 & 2032
- Figure 17: North America Recovered Paper Industry Revenue Share (%), by Country 2024 & 2032
- Figure 18: Europe Recovered Paper Industry Revenue (Million), by Type 2024 & 2032
- Figure 19: Europe Recovered Paper Industry Revenue Share (%), by Type 2024 & 2032
- Figure 20: Europe Recovered Paper Industry Revenue (Million), by Country 2024 & 2032
- Figure 21: Europe Recovered Paper Industry Revenue Share (%), by Country 2024 & 2032
- Figure 22: Asia Pacific Recovered Paper Industry Revenue (Million), by Type 2024 & 2032
- Figure 23: Asia Pacific Recovered Paper Industry Revenue Share (%), by Type 2024 & 2032
- Figure 24: Asia Pacific Recovered Paper Industry Revenue (Million), by Country 2024 & 2032
- Figure 25: Asia Pacific Recovered Paper Industry Revenue Share (%), by Country 2024 & 2032
- Figure 26: Latin America Recovered Paper Industry Revenue (Million), by Type 2024 & 2032
- Figure 27: Latin America Recovered Paper Industry Revenue Share (%), by Type 2024 & 2032
- Figure 28: Latin America Recovered Paper Industry Revenue (Million), by Country 2024 & 2032
- Figure 29: Latin America Recovered Paper Industry Revenue Share (%), by Country 2024 & 2032
- Figure 30: Middle East and Africa Recovered Paper Industry Revenue (Million), by Type 2024 & 2032
- Figure 31: Middle East and Africa Recovered Paper Industry Revenue Share (%), by Type 2024 & 2032
- Figure 32: Middle East and Africa Recovered Paper Industry Revenue (Million), by Country 2024 & 2032
- Figure 33: Middle East and Africa Recovered Paper Industry Revenue Share (%), by Country 2024 & 2032
List of Tables
- Table 1: Global Recovered Paper Industry Revenue Million Forecast, by Region 2019 & 2032
- Table 2: Global Recovered Paper Industry Revenue Million Forecast, by Type 2019 & 2032
- Table 3: Global Recovered Paper Industry Revenue Million Forecast, by Region 2019 & 2032
- Table 4: Global Recovered Paper Industry Revenue Million Forecast, by Country 2019 & 2032
- Table 5: United States Recovered Paper Industry Revenue (Million) Forecast, by Application 2019 & 2032
- Table 6: Canada Recovered Paper Industry Revenue (Million) Forecast, by Application 2019 & 2032
- Table 7: Mexico Recovered Paper Industry Revenue (Million) Forecast, by Application 2019 & 2032
- Table 8: Global Recovered Paper Industry Revenue Million Forecast, by Country 2019 & 2032
- Table 9: Germany Recovered Paper Industry Revenue (Million) Forecast, by Application 2019 & 2032
- Table 10: United Kingdom Recovered Paper Industry Revenue (Million) Forecast, by Application 2019 & 2032
- Table 11: France Recovered Paper Industry Revenue (Million) Forecast, by Application 2019 & 2032
- Table 12: Spain Recovered Paper Industry Revenue (Million) Forecast, by Application 2019 & 2032
- Table 13: Italy Recovered Paper Industry Revenue (Million) Forecast, by Application 2019 & 2032
- Table 14: Spain Recovered Paper Industry Revenue (Million) Forecast, by Application 2019 & 2032
- Table 15: Belgium Recovered Paper Industry Revenue (Million) Forecast, by Application 2019 & 2032
- Table 16: Netherland Recovered Paper Industry Revenue (Million) Forecast, by Application 2019 & 2032
- Table 17: Nordics Recovered Paper Industry Revenue (Million) Forecast, by Application 2019 & 2032
- Table 18: Rest of Europe Recovered Paper Industry Revenue (Million) Forecast, by Application 2019 & 2032
- Table 19: Global Recovered Paper Industry Revenue Million Forecast, by Country 2019 & 2032
- Table 20: China Recovered Paper Industry Revenue (Million) Forecast, by Application 2019 & 2032
- Table 21: Japan Recovered Paper Industry Revenue (Million) Forecast, by Application 2019 & 2032
- Table 22: India Recovered Paper Industry Revenue (Million) Forecast, by Application 2019 & 2032
- Table 23: South Korea Recovered Paper Industry Revenue (Million) Forecast, by Application 2019 & 2032
- Table 24: Southeast Asia Recovered Paper Industry Revenue (Million) Forecast, by Application 2019 & 2032
- Table 25: Australia Recovered Paper Industry Revenue (Million) Forecast, by Application 2019 & 2032
- Table 26: Indonesia Recovered Paper Industry Revenue (Million) Forecast, by Application 2019 & 2032
- Table 27: Phillipes Recovered Paper Industry Revenue (Million) Forecast, by Application 2019 & 2032
- Table 28: Singapore Recovered Paper Industry Revenue (Million) Forecast, by Application 2019 & 2032
- Table 29: Thailandc Recovered Paper Industry Revenue (Million) Forecast, by Application 2019 & 2032
- Table 30: Rest of Asia Pacific Recovered Paper Industry Revenue (Million) Forecast, by Application 2019 & 2032
- Table 31: Global Recovered Paper Industry Revenue Million Forecast, by Country 2019 & 2032
- Table 32: Brazil Recovered Paper Industry Revenue (Million) Forecast, by Application 2019 & 2032
- Table 33: Argentina Recovered Paper Industry Revenue (Million) Forecast, by Application 2019 & 2032
- Table 34: Peru Recovered Paper Industry Revenue (Million) Forecast, by Application 2019 & 2032
- Table 35: Chile Recovered Paper Industry Revenue (Million) Forecast, by Application 2019 & 2032
- Table 36: Colombia Recovered Paper Industry Revenue (Million) Forecast, by Application 2019 & 2032
- Table 37: Ecuador Recovered Paper Industry Revenue (Million) Forecast, by Application 2019 & 2032
- Table 38: Venezuela Recovered Paper Industry Revenue (Million) Forecast, by Application 2019 & 2032
- Table 39: Rest of South America Recovered Paper Industry Revenue (Million) Forecast, by Application 2019 & 2032
- Table 40: Global Recovered Paper Industry Revenue Million Forecast, by Country 2019 & 2032
- Table 41: United States Recovered Paper Industry Revenue (Million) Forecast, by Application 2019 & 2032
- Table 42: Canada Recovered Paper Industry Revenue (Million) Forecast, by Application 2019 & 2032
- Table 43: Mexico Recovered Paper Industry Revenue (Million) Forecast, by Application 2019 & 2032
- Table 44: Global Recovered Paper Industry Revenue Million Forecast, by Country 2019 & 2032
- Table 45: United Arab Emirates Recovered Paper Industry Revenue (Million) Forecast, by Application 2019 & 2032
- Table 46: Saudi Arabia Recovered Paper Industry Revenue (Million) Forecast, by Application 2019 & 2032
- Table 47: South Africa Recovered Paper Industry Revenue (Million) Forecast, by Application 2019 & 2032
- Table 48: Rest of Middle East and Africa Recovered Paper Industry Revenue (Million) Forecast, by Application 2019 & 2032
- Table 49: Global Recovered Paper Industry Revenue Million Forecast, by Type 2019 & 2032
- Table 50: Global Recovered Paper Industry Revenue Million Forecast, by Country 2019 & 2032
- Table 51: Global Recovered Paper Industry Revenue Million Forecast, by Type 2019 & 2032
- Table 52: Global Recovered Paper Industry Revenue Million Forecast, by Country 2019 & 2032
- Table 53: Global Recovered Paper Industry Revenue Million Forecast, by Type 2019 & 2032
- Table 54: Global Recovered Paper Industry Revenue Million Forecast, by Country 2019 & 2032
- Table 55: Global Recovered Paper Industry Revenue Million Forecast, by Type 2019 & 2032
- Table 56: Global Recovered Paper Industry Revenue Million Forecast, by Country 2019 & 2032
- Table 57: Global Recovered Paper Industry Revenue Million Forecast, by Type 2019 & 2032
- Table 58: Global Recovered Paper Industry Revenue Million Forecast, by Country 2019 & 2032
Frequently Asked Questions
1. What is the projected Compound Annual Growth Rate (CAGR) of the Recovered Paper Industry?
The projected CAGR is approximately 2.70%.
2. Which companies are prominent players in the Recovered Paper Industry?
Key companies in the market include International Paper, Tay Paper Recycling Pte Ltd, Smurfit Kappa Group plc, Nine Dragons Paper (Holdings) Limited, Stora Enso Oyj, S A Industrias Celulosa Aragonesa (SAICA), Visy Industrie, DS Smith Plc.
3. What are the main segments of the Recovered Paper Industry?
The market segments include Type.
4. Can you provide details about the market size?
The market size is estimated to be USD XX Million as of 2022.
5. What are some drivers contributing to market growth?
Growth in E-commerce Sales in China; Rising Demand from the Food-service Sector; Growing Consumer Awareness on Paper Packaging; Recycling Initiatives Involving Closed-loop Systems to Aid Market Adoption of Paper Packaging-based Materials.
6. What are the notable trends driving market growth?
Containerboard to Dominate the Market.
7. Are there any restraints impacting market growth?
Recycling. Raw Material Supply Chain Management. and Challenges in the Paper Packaging Industry; Effects of Deforestation on Paper Packaging; Increasing Raw Material Costs and Outsourcing.
8. Can you provide examples of recent developments in the market?
N/A
9. What pricing options are available for accessing the report?
Pricing options include single-user, multi-user, and enterprise licenses priced at USD 4750, USD 5250, and USD 8750 respectively.
10. Is the market size provided in terms of value or volume?
The market size is provided in terms of value, measured in Million.
11. Are there any specific market keywords associated with the report?
Yes, the market keyword associated with the report is "Recovered Paper Industry," which aids in identifying and referencing the specific market segment covered.
12. How do I determine which pricing option suits my needs best?
The pricing options vary based on user requirements and access needs. Individual users may opt for single-user licenses, while businesses requiring broader access may choose multi-user or enterprise licenses for cost-effective access to the report.
13. Are there any additional resources or data provided in the Recovered Paper Industry report?
While the report offers comprehensive insights, it's advisable to review the specific contents or supplementary materials provided to ascertain if additional resources or data are available.
14. How can I stay updated on further developments or reports in the Recovered Paper Industry?
To stay informed about further developments, trends, and reports in the Recovered Paper Industry, consider subscribing to industry newsletters, following relevant companies and organizations, or regularly checking reputable industry news sources and publications.
Methodology
Step 1 - Identification of Relevant Samples Size from Population Database


Step 2 - Approaches for Defining Global Market Size (Value, Volume* & Price*)

Note*: In applicable scenarios
Step 3 - Data Sources
Primary Research
- Web Analytics
- Survey Reports
- Research Institute
- Latest Research Reports
- Opinion Leaders
Secondary Research
- Annual Reports
- White Paper
- Latest Press Release
- Industry Association
- Paid Database
- Investor Presentations

Step 4 - Data Triangulation
Involves using different sources of information in order to increase the validity of a study
These sources are likely to be stakeholders in a program - participants, other researchers, program staff, other community members, and so on.
Then we put all data in single framework & apply various statistical tools to find out the dynamic on the market.
During the analysis stage, feedback from the stakeholder groups would be compared to determine areas of agreement as well as areas of divergence


