


Key Insights
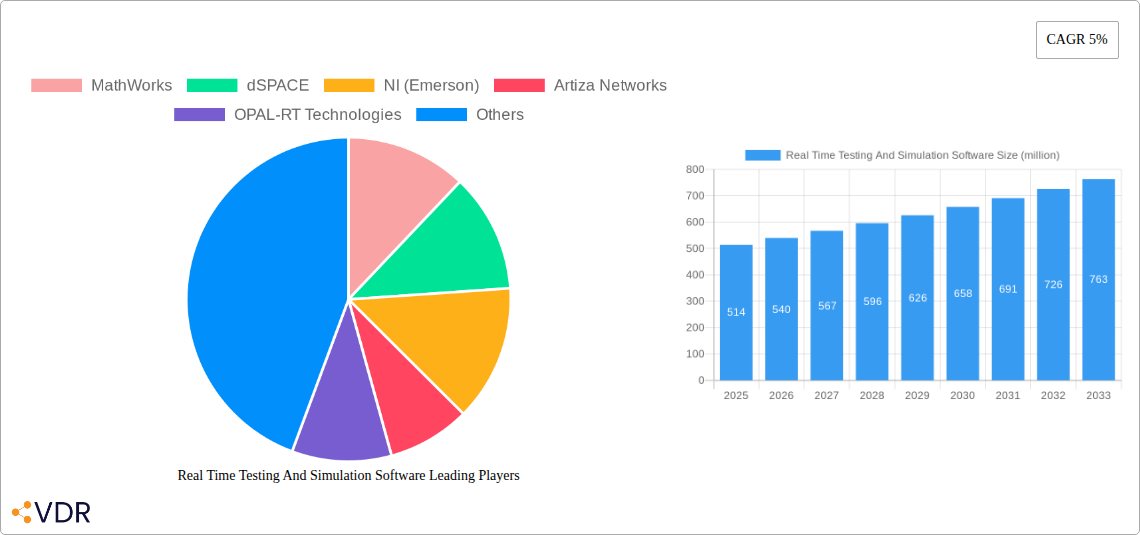
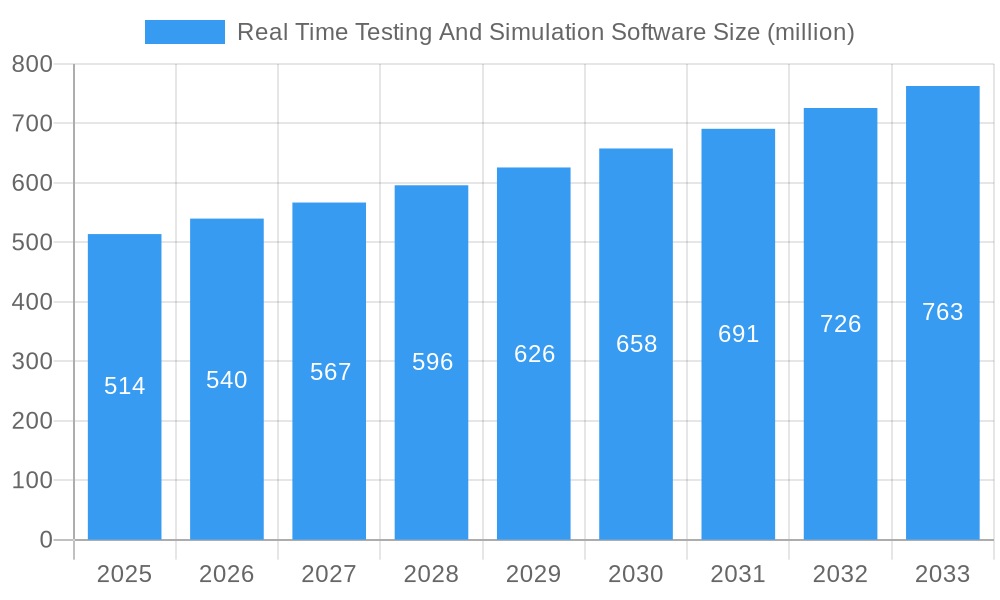
The real-time testing and simulation software market, currently valued at $514 million in 2025, is projected to experience robust growth, driven by the increasing demand for reliable and efficient testing methodologies across various industries. The 5% CAGR indicates a steady expansion over the forecast period (2025-2033), fueled by several key factors. The automotive sector, with its stringent safety and performance requirements, is a significant driver, alongside the aerospace and defense industries which rely heavily on simulations for complex system validation. Furthermore, the rising adoption of autonomous systems and the Internet of Things (IoT) necessitates sophisticated real-time testing solutions, further propelling market growth. The market is segmented by software type (hardware-in-the-loop, software-in-the-loop, model-in-the-loop), application (automotive, aerospace & defense, industrial automation), and deployment mode (cloud-based, on-premise). Competition is fierce, with established players like MathWorks, dSPACE, and NI (Emerson) facing challenges from emerging companies specializing in niche applications. However, the overall market trajectory remains positive, indicating substantial opportunities for innovation and expansion in the coming years. Challenges include the complexity of integrating diverse simulation tools and the need for skilled professionals to effectively utilize the software. The high initial investment cost for advanced simulation platforms can also act as a restraint for smaller companies.
Real Time Testing And Simulation Software Market Size (In Million)

The competitive landscape is dynamic, with established players continuously innovating to maintain their market share. Strategic partnerships, acquisitions, and the development of advanced features are common strategies. Future growth will be influenced by advancements in artificial intelligence (AI) and machine learning (ML), enabling more sophisticated simulations and automated testing processes. The increasing focus on reducing time-to-market and improving product quality across industries will continue to drive the demand for efficient and reliable real-time testing and simulation software solutions. The adoption of cloud-based solutions is expected to accelerate, offering scalability and accessibility benefits. Geographical expansion, particularly in developing economies, presents a significant avenue for future growth.
Real Time Testing And Simulation Software Company Market Share
Real Time Testing & Simulation Software Market Report: 2019-2033
This comprehensive report provides a detailed analysis of the real-time testing and simulation software market, encompassing market dynamics, growth trends, regional insights, competitive landscape, and future outlook. The study period covers 2019-2033, with 2025 as the base and estimated year. The forecast period spans 2025-2033, and the historical period covers 2019-2024. This report is crucial for industry professionals, investors, and strategic decision-makers seeking to understand and capitalize on opportunities within this rapidly evolving market. The market is valued at xx million in 2025 and is expected to reach xx million by 2033.
Parent Market: Software Market (valued at $xx million in 2025) Child Market: Embedded Systems Testing & Simulation
Real Time Testing And Simulation Software Market Dynamics & Structure
The real-time testing and simulation software market is characterized by moderate concentration, with key players holding significant market share. MathWorks, dSPACE, and NI (Emerson) dominate the landscape, collectively accounting for approximately xx% of the market in 2025. However, smaller specialized firms like OPAL-RT Technologies and Vector Informatik are gaining traction in niche segments. Technological innovation, particularly in areas like AI and machine learning integration, is a major driver of market growth. Stringent regulatory frameworks in industries like automotive and aerospace influence software development and validation processes. The market experiences competitive pressures from open-source alternatives and cloud-based solutions. Furthermore, M&A activity is relatively moderate, with approximately xx deals recorded in the past five years. End-user demographics are diverse, spanning automotive, aerospace, industrial automation, and defense sectors.
- Market Concentration: Moderately concentrated, with top 3 players holding xx% market share in 2025.
- Technological Drivers: AI/ML integration, high-fidelity simulation, model-based design.
- Regulatory Frameworks: Strict standards in automotive (ISO 26262), aerospace (DO-178C).
- Competitive Substitutes: Open-source solutions, cloud-based simulation platforms.
- M&A Activity: Approximately xx deals in the last 5 years, indicative of consolidation.
- Innovation Barriers: High development costs, skilled labor shortages.
Real Time Testing And Simulation Software Growth Trends & Insights
The real-time testing and simulation software market exhibits robust growth, driven by increasing demand for advanced testing and validation methodologies across diverse industries. The market size has grown from xx million in 2019 to xx million in 2024, with a CAGR of xx%. This growth is fueled by several factors, including the rising adoption of autonomous vehicles, the increasing complexity of embedded systems, and the growing need for virtual prototyping and digital twin technologies. Technological disruptions, such as the advent of 5G and edge computing, are creating new opportunities for innovation and market expansion. Consumer behavior shifts towards greater reliance on sophisticated digital systems further stimulate market growth. Market penetration is currently at xx% and is projected to reach xx% by 2033.
Dominant Regions, Countries, or Segments in Real Time Testing And Simulation Software
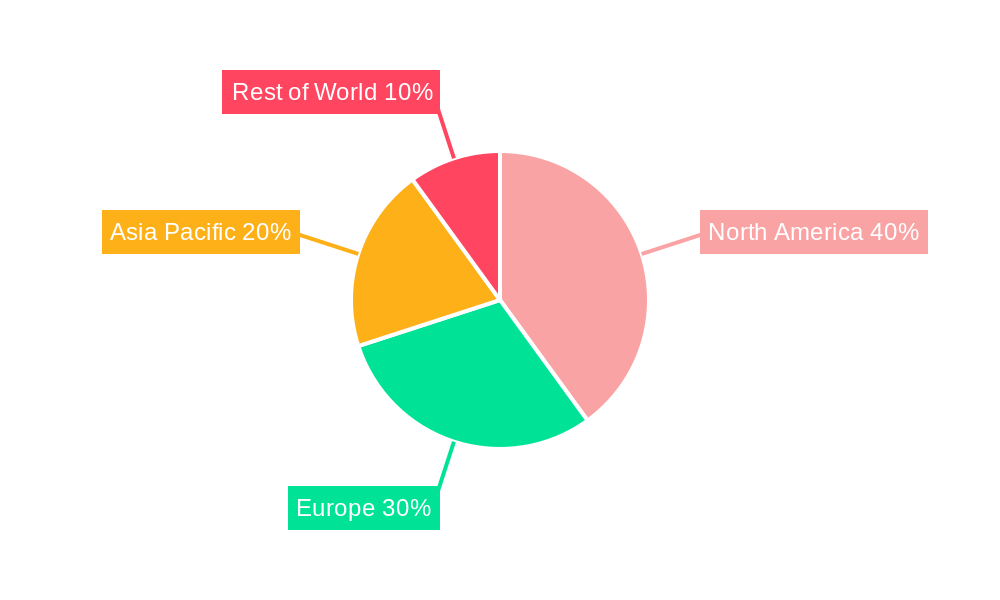
North America currently holds the largest market share, driven by strong technological advancements, a robust automotive industry, and substantial government investment in research and development. Europe follows closely, with Germany and the UK being significant contributors due to their established automotive and aerospace sectors. Asia-Pacific is expected to witness the fastest growth, propelled by rising manufacturing activities, government initiatives promoting technological advancement, and increasing adoption of automation in various industries.
- North America: Strong automotive and aerospace industries, high R&D investment.
- Europe: Established automotive and aerospace sectors, presence of major software vendors.
- Asia-Pacific: Rapid industrialization, government initiatives promoting technology adoption.
- Market Share: North America (xx%), Europe (xx%), Asia-Pacific (xx%) in 2025.
- Growth Potential: Asia-Pacific exhibits the highest projected growth rate (xx% CAGR).
Real Time Testing And Simulation Software Product Landscape
The product landscape features a range of solutions, from standalone software packages to integrated platforms offering comprehensive testing and simulation capabilities. Innovations focus on enhanced accuracy, faster simulation speeds, improved user interfaces, and seamless integration with other development tools. Key features include automated testing frameworks, advanced visualization tools, and support for diverse hardware platforms. Unique selling propositions emphasize ease of use, scalability, and specific industry-focused functionalities. Technological advancements are concentrated on AI-driven test automation and the integration of cloud-based technologies.
Key Drivers, Barriers & Challenges in Real Time Testing And Simulation Software
Key Drivers:
- Increasing demand for complex embedded systems across diverse sectors.
- Growing adoption of autonomous vehicles, robotics, and IoT devices.
- Stringent safety and regulatory requirements in various industries.
- The rise of digital twins and virtual prototyping methodologies.
Challenges and Restraints:
- High cost of software development and implementation.
- Complexity in integrating with existing development workflows.
- Shortage of skilled professionals proficient in real-time simulation techniques.
- Intense competition and the emergence of open-source alternatives.
Emerging Opportunities in Real Time Testing And Simulation Software
- Expansion into untapped markets, such as renewable energy and smart grids.
- Development of specialized solutions for specific industry segments (e.g., medical devices).
- Integration of AI and ML for automated test generation and analysis.
- Adoption of cloud-based platforms for collaborative testing and simulation.
Growth Accelerators in the Real Time Testing And Simulation Software Industry
Technological breakthroughs in areas such as high-performance computing, AI, and virtual reality are key growth catalysts. Strategic partnerships between software vendors and hardware manufacturers, along with aggressive market expansion strategies targeting emerging economies, will further propel market growth.
Key Players Shaping the Real Time Testing And Simulation Software Market
- MathWorks
- dSPACE
- NI (Emerson)
- Artiza Networks
- OPAL-RT Technologies
- Vector Informatik
- Keysight Technologies
- Real-Time Innovations
- RTDS Technologies
- Rohde & Schwarz
- OPAL-RT
- Speedgoat
- Ansys
- ESI Group
Notable Milestones in Real Time Testing And Simulation Software Sector
- 2020-Q4: MathWorks releases a major update to its Simulink suite, incorporating AI capabilities.
- 2021-Q2: dSPACE launches a new hardware-in-the-loop (HIL) simulator with advanced features.
- 2022-Q3: NI (Emerson) acquires a smaller simulation software company, expanding its product portfolio.
- 2023-Q1: Several key players announce strategic partnerships to expand market reach and integrate products.
In-Depth Real Time Testing And Simulation Software Market Outlook
The future of the real-time testing and simulation software market is bright, with continued growth driven by technological advancements and increasing industry adoption. Strategic opportunities lie in leveraging AI/ML to improve simulation accuracy and automation, developing cloud-based solutions for scalability and collaboration, and expanding into new and emerging application areas. The market is poised for significant expansion, presenting lucrative opportunities for both established players and new entrants.
Real Time Testing And Simulation Software Segmentation
-
1. Application
- 1.1. Automotive Industry
- 1.2. Aerospace
- 1.3. Energy and Power
- 1.4. Industrial Automation
- 1.5. Others
-
2. Type
- 2.1. Hardware-in-the-Loop (HIL) Simulation
- 2.2. Software-in-the-Loop (SIL) Simulation
- 2.3. Model-in-the-Loop (MIL) Simulation
Real Time Testing And Simulation Software Segmentation By Geography
-
1. North America
- 1.1. United States
- 1.2. Canada
- 1.3. Mexico
-
2. South America
- 2.1. Brazil
- 2.2. Argentina
- 2.3. Rest of South America
-
3. Europe
- 3.1. United Kingdom
- 3.2. Germany
- 3.3. France
- 3.4. Italy
- 3.5. Spain
- 3.6. Russia
- 3.7. Benelux
- 3.8. Nordics
- 3.9. Rest of Europe
-
4. Middle East & Africa
- 4.1. Turkey
- 4.2. Israel
- 4.3. GCC
- 4.4. North Africa
- 4.5. South Africa
- 4.6. Rest of Middle East & Africa
-
5. Asia Pacific
- 5.1. China
- 5.2. India
- 5.3. Japan
- 5.4. South Korea
- 5.5. ASEAN
- 5.6. Oceania
- 5.7. Rest of Asia Pacific
Real Time Testing And Simulation Software Regional Market Share
Geographic Coverage of Real Time Testing And Simulation Software
Real Time Testing And Simulation Software REPORT HIGHLIGHTS
| Aspects | Details |
|---|---|
| Study Period | 2020-2034 |
| Base Year | 2025 |
| Estimated Year | 2026 |
| Forecast Period | 2026-2034 |
| Historical Period | 2020-2025 |
| Growth Rate | CAGR of 5% from 2020-2034 |
| Segmentation |
|
Table of Contents
- 1. Introduction
- 1.1. Research Scope
- 1.2. Market Segmentation
- 1.3. Research Methodology
- 1.4. Definitions and Assumptions
- 2. Executive Summary
- 2.1. Introduction
- 3. Market Dynamics
- 3.1. Introduction
- 3.2. Market Drivers
- 3.3. Market Restrains
- 3.4. Market Trends
- 4. Market Factor Analysis
- 4.1. Porters Five Forces
- 4.2. Supply/Value Chain
- 4.3. PESTEL analysis
- 4.4. Market Entropy
- 4.5. Patent/Trademark Analysis
- 5. Global Real Time Testing And Simulation Software Analysis, Insights and Forecast, 2020-2032
- 5.1. Market Analysis, Insights and Forecast - by Application
- 5.1.1. Automotive Industry
- 5.1.2. Aerospace
- 5.1.3. Energy and Power
- 5.1.4. Industrial Automation
- 5.1.5. Others
- 5.2. Market Analysis, Insights and Forecast - by Type
- 5.2.1. Hardware-in-the-Loop (HIL) Simulation
- 5.2.2. Software-in-the-Loop (SIL) Simulation
- 5.2.3. Model-in-the-Loop (MIL) Simulation
- 5.3. Market Analysis, Insights and Forecast - by Region
- 5.3.1. North America
- 5.3.2. South America
- 5.3.3. Europe
- 5.3.4. Middle East & Africa
- 5.3.5. Asia Pacific
- 5.1. Market Analysis, Insights and Forecast - by Application
- 6. North America Real Time Testing And Simulation Software Analysis, Insights and Forecast, 2020-2032
- 6.1. Market Analysis, Insights and Forecast - by Application
- 6.1.1. Automotive Industry
- 6.1.2. Aerospace
- 6.1.3. Energy and Power
- 6.1.4. Industrial Automation
- 6.1.5. Others
- 6.2. Market Analysis, Insights and Forecast - by Type
- 6.2.1. Hardware-in-the-Loop (HIL) Simulation
- 6.2.2. Software-in-the-Loop (SIL) Simulation
- 6.2.3. Model-in-the-Loop (MIL) Simulation
- 6.1. Market Analysis, Insights and Forecast - by Application
- 7. South America Real Time Testing And Simulation Software Analysis, Insights and Forecast, 2020-2032
- 7.1. Market Analysis, Insights and Forecast - by Application
- 7.1.1. Automotive Industry
- 7.1.2. Aerospace
- 7.1.3. Energy and Power
- 7.1.4. Industrial Automation
- 7.1.5. Others
- 7.2. Market Analysis, Insights and Forecast - by Type
- 7.2.1. Hardware-in-the-Loop (HIL) Simulation
- 7.2.2. Software-in-the-Loop (SIL) Simulation
- 7.2.3. Model-in-the-Loop (MIL) Simulation
- 7.1. Market Analysis, Insights and Forecast - by Application
- 8. Europe Real Time Testing And Simulation Software Analysis, Insights and Forecast, 2020-2032
- 8.1. Market Analysis, Insights and Forecast - by Application
- 8.1.1. Automotive Industry
- 8.1.2. Aerospace
- 8.1.3. Energy and Power
- 8.1.4. Industrial Automation
- 8.1.5. Others
- 8.2. Market Analysis, Insights and Forecast - by Type
- 8.2.1. Hardware-in-the-Loop (HIL) Simulation
- 8.2.2. Software-in-the-Loop (SIL) Simulation
- 8.2.3. Model-in-the-Loop (MIL) Simulation
- 8.1. Market Analysis, Insights and Forecast - by Application
- 9. Middle East & Africa Real Time Testing And Simulation Software Analysis, Insights and Forecast, 2020-2032
- 9.1. Market Analysis, Insights and Forecast - by Application
- 9.1.1. Automotive Industry
- 9.1.2. Aerospace
- 9.1.3. Energy and Power
- 9.1.4. Industrial Automation
- 9.1.5. Others
- 9.2. Market Analysis, Insights and Forecast - by Type
- 9.2.1. Hardware-in-the-Loop (HIL) Simulation
- 9.2.2. Software-in-the-Loop (SIL) Simulation
- 9.2.3. Model-in-the-Loop (MIL) Simulation
- 9.1. Market Analysis, Insights and Forecast - by Application
- 10. Asia Pacific Real Time Testing And Simulation Software Analysis, Insights and Forecast, 2020-2032
- 10.1. Market Analysis, Insights and Forecast - by Application
- 10.1.1. Automotive Industry
- 10.1.2. Aerospace
- 10.1.3. Energy and Power
- 10.1.4. Industrial Automation
- 10.1.5. Others
- 10.2. Market Analysis, Insights and Forecast - by Type
- 10.2.1. Hardware-in-the-Loop (HIL) Simulation
- 10.2.2. Software-in-the-Loop (SIL) Simulation
- 10.2.3. Model-in-the-Loop (MIL) Simulation
- 10.1. Market Analysis, Insights and Forecast - by Application
- 11. Competitive Analysis
- 11.1. Global Market Share Analysis 2025
- 11.2. Company Profiles
- 11.2.1 MathWorks
- 11.2.1.1. Overview
- 11.2.1.2. Products
- 11.2.1.3. SWOT Analysis
- 11.2.1.4. Recent Developments
- 11.2.1.5. Financials (Based on Availability)
- 11.2.2 dSPACE
- 11.2.2.1. Overview
- 11.2.2.2. Products
- 11.2.2.3. SWOT Analysis
- 11.2.2.4. Recent Developments
- 11.2.2.5. Financials (Based on Availability)
- 11.2.3 NI (Emerson)
- 11.2.3.1. Overview
- 11.2.3.2. Products
- 11.2.3.3. SWOT Analysis
- 11.2.3.4. Recent Developments
- 11.2.3.5. Financials (Based on Availability)
- 11.2.4 Artiza Networks
- 11.2.4.1. Overview
- 11.2.4.2. Products
- 11.2.4.3. SWOT Analysis
- 11.2.4.4. Recent Developments
- 11.2.4.5. Financials (Based on Availability)
- 11.2.5 OPAL-RT Technologies
- 11.2.5.1. Overview
- 11.2.5.2. Products
- 11.2.5.3. SWOT Analysis
- 11.2.5.4. Recent Developments
- 11.2.5.5. Financials (Based on Availability)
- 11.2.6 Vector Informatik
- 11.2.6.1. Overview
- 11.2.6.2. Products
- 11.2.6.3. SWOT Analysis
- 11.2.6.4. Recent Developments
- 11.2.6.5. Financials (Based on Availability)
- 11.2.7 Keysight Technologies
- 11.2.7.1. Overview
- 11.2.7.2. Products
- 11.2.7.3. SWOT Analysis
- 11.2.7.4. Recent Developments
- 11.2.7.5. Financials (Based on Availability)
- 11.2.8 Real-Time Innovations
- 11.2.8.1. Overview
- 11.2.8.2. Products
- 11.2.8.3. SWOT Analysis
- 11.2.8.4. Recent Developments
- 11.2.8.5. Financials (Based on Availability)
- 11.2.9 RTDS Technologies
- 11.2.9.1. Overview
- 11.2.9.2. Products
- 11.2.9.3. SWOT Analysis
- 11.2.9.4. Recent Developments
- 11.2.9.5. Financials (Based on Availability)
- 11.2.10 Rohde & Schwarz
- 11.2.10.1. Overview
- 11.2.10.2. Products
- 11.2.10.3. SWOT Analysis
- 11.2.10.4. Recent Developments
- 11.2.10.5. Financials (Based on Availability)
- 11.2.11 OPAL-RT
- 11.2.11.1. Overview
- 11.2.11.2. Products
- 11.2.11.3. SWOT Analysis
- 11.2.11.4. Recent Developments
- 11.2.11.5. Financials (Based on Availability)
- 11.2.12 Speedgoat
- 11.2.12.1. Overview
- 11.2.12.2. Products
- 11.2.12.3. SWOT Analysis
- 11.2.12.4. Recent Developments
- 11.2.12.5. Financials (Based on Availability)
- 11.2.13 Ansys
- 11.2.13.1. Overview
- 11.2.13.2. Products
- 11.2.13.3. SWOT Analysis
- 11.2.13.4. Recent Developments
- 11.2.13.5. Financials (Based on Availability)
- 11.2.14 ESI Group
- 11.2.14.1. Overview
- 11.2.14.2. Products
- 11.2.14.3. SWOT Analysis
- 11.2.14.4. Recent Developments
- 11.2.14.5. Financials (Based on Availability)
- 11.2.1 MathWorks
List of Figures
- Figure 1: Global Real Time Testing And Simulation Software Revenue Breakdown (million, %) by Region 2025 & 2033
- Figure 2: North America Real Time Testing And Simulation Software Revenue (million), by Application 2025 & 2033
- Figure 3: North America Real Time Testing And Simulation Software Revenue Share (%), by Application 2025 & 2033
- Figure 4: North America Real Time Testing And Simulation Software Revenue (million), by Type 2025 & 2033
- Figure 5: North America Real Time Testing And Simulation Software Revenue Share (%), by Type 2025 & 2033
- Figure 6: North America Real Time Testing And Simulation Software Revenue (million), by Country 2025 & 2033
- Figure 7: North America Real Time Testing And Simulation Software Revenue Share (%), by Country 2025 & 2033
- Figure 8: South America Real Time Testing And Simulation Software Revenue (million), by Application 2025 & 2033
- Figure 9: South America Real Time Testing And Simulation Software Revenue Share (%), by Application 2025 & 2033
- Figure 10: South America Real Time Testing And Simulation Software Revenue (million), by Type 2025 & 2033
- Figure 11: South America Real Time Testing And Simulation Software Revenue Share (%), by Type 2025 & 2033
- Figure 12: South America Real Time Testing And Simulation Software Revenue (million), by Country 2025 & 2033
- Figure 13: South America Real Time Testing And Simulation Software Revenue Share (%), by Country 2025 & 2033
- Figure 14: Europe Real Time Testing And Simulation Software Revenue (million), by Application 2025 & 2033
- Figure 15: Europe Real Time Testing And Simulation Software Revenue Share (%), by Application 2025 & 2033
- Figure 16: Europe Real Time Testing And Simulation Software Revenue (million), by Type 2025 & 2033
- Figure 17: Europe Real Time Testing And Simulation Software Revenue Share (%), by Type 2025 & 2033
- Figure 18: Europe Real Time Testing And Simulation Software Revenue (million), by Country 2025 & 2033
- Figure 19: Europe Real Time Testing And Simulation Software Revenue Share (%), by Country 2025 & 2033
- Figure 20: Middle East & Africa Real Time Testing And Simulation Software Revenue (million), by Application 2025 & 2033
- Figure 21: Middle East & Africa Real Time Testing And Simulation Software Revenue Share (%), by Application 2025 & 2033
- Figure 22: Middle East & Africa Real Time Testing And Simulation Software Revenue (million), by Type 2025 & 2033
- Figure 23: Middle East & Africa Real Time Testing And Simulation Software Revenue Share (%), by Type 2025 & 2033
- Figure 24: Middle East & Africa Real Time Testing And Simulation Software Revenue (million), by Country 2025 & 2033
- Figure 25: Middle East & Africa Real Time Testing And Simulation Software Revenue Share (%), by Country 2025 & 2033
- Figure 26: Asia Pacific Real Time Testing And Simulation Software Revenue (million), by Application 2025 & 2033
- Figure 27: Asia Pacific Real Time Testing And Simulation Software Revenue Share (%), by Application 2025 & 2033
- Figure 28: Asia Pacific Real Time Testing And Simulation Software Revenue (million), by Type 2025 & 2033
- Figure 29: Asia Pacific Real Time Testing And Simulation Software Revenue Share (%), by Type 2025 & 2033
- Figure 30: Asia Pacific Real Time Testing And Simulation Software Revenue (million), by Country 2025 & 2033
- Figure 31: Asia Pacific Real Time Testing And Simulation Software Revenue Share (%), by Country 2025 & 2033
List of Tables
- Table 1: Global Real Time Testing And Simulation Software Revenue million Forecast, by Application 2020 & 2033
- Table 2: Global Real Time Testing And Simulation Software Revenue million Forecast, by Type 2020 & 2033
- Table 3: Global Real Time Testing And Simulation Software Revenue million Forecast, by Region 2020 & 2033
- Table 4: Global Real Time Testing And Simulation Software Revenue million Forecast, by Application 2020 & 2033
- Table 5: Global Real Time Testing And Simulation Software Revenue million Forecast, by Type 2020 & 2033
- Table 6: Global Real Time Testing And Simulation Software Revenue million Forecast, by Country 2020 & 2033
- Table 7: United States Real Time Testing And Simulation Software Revenue (million) Forecast, by Application 2020 & 2033
- Table 8: Canada Real Time Testing And Simulation Software Revenue (million) Forecast, by Application 2020 & 2033
- Table 9: Mexico Real Time Testing And Simulation Software Revenue (million) Forecast, by Application 2020 & 2033
- Table 10: Global Real Time Testing And Simulation Software Revenue million Forecast, by Application 2020 & 2033
- Table 11: Global Real Time Testing And Simulation Software Revenue million Forecast, by Type 2020 & 2033
- Table 12: Global Real Time Testing And Simulation Software Revenue million Forecast, by Country 2020 & 2033
- Table 13: Brazil Real Time Testing And Simulation Software Revenue (million) Forecast, by Application 2020 & 2033
- Table 14: Argentina Real Time Testing And Simulation Software Revenue (million) Forecast, by Application 2020 & 2033
- Table 15: Rest of South America Real Time Testing And Simulation Software Revenue (million) Forecast, by Application 2020 & 2033
- Table 16: Global Real Time Testing And Simulation Software Revenue million Forecast, by Application 2020 & 2033
- Table 17: Global Real Time Testing And Simulation Software Revenue million Forecast, by Type 2020 & 2033
- Table 18: Global Real Time Testing And Simulation Software Revenue million Forecast, by Country 2020 & 2033
- Table 19: United Kingdom Real Time Testing And Simulation Software Revenue (million) Forecast, by Application 2020 & 2033
- Table 20: Germany Real Time Testing And Simulation Software Revenue (million) Forecast, by Application 2020 & 2033
- Table 21: France Real Time Testing And Simulation Software Revenue (million) Forecast, by Application 2020 & 2033
- Table 22: Italy Real Time Testing And Simulation Software Revenue (million) Forecast, by Application 2020 & 2033
- Table 23: Spain Real Time Testing And Simulation Software Revenue (million) Forecast, by Application 2020 & 2033
- Table 24: Russia Real Time Testing And Simulation Software Revenue (million) Forecast, by Application 2020 & 2033
- Table 25: Benelux Real Time Testing And Simulation Software Revenue (million) Forecast, by Application 2020 & 2033
- Table 26: Nordics Real Time Testing And Simulation Software Revenue (million) Forecast, by Application 2020 & 2033
- Table 27: Rest of Europe Real Time Testing And Simulation Software Revenue (million) Forecast, by Application 2020 & 2033
- Table 28: Global Real Time Testing And Simulation Software Revenue million Forecast, by Application 2020 & 2033
- Table 29: Global Real Time Testing And Simulation Software Revenue million Forecast, by Type 2020 & 2033
- Table 30: Global Real Time Testing And Simulation Software Revenue million Forecast, by Country 2020 & 2033
- Table 31: Turkey Real Time Testing And Simulation Software Revenue (million) Forecast, by Application 2020 & 2033
- Table 32: Israel Real Time Testing And Simulation Software Revenue (million) Forecast, by Application 2020 & 2033
- Table 33: GCC Real Time Testing And Simulation Software Revenue (million) Forecast, by Application 2020 & 2033
- Table 34: North Africa Real Time Testing And Simulation Software Revenue (million) Forecast, by Application 2020 & 2033
- Table 35: South Africa Real Time Testing And Simulation Software Revenue (million) Forecast, by Application 2020 & 2033
- Table 36: Rest of Middle East & Africa Real Time Testing And Simulation Software Revenue (million) Forecast, by Application 2020 & 2033
- Table 37: Global Real Time Testing And Simulation Software Revenue million Forecast, by Application 2020 & 2033
- Table 38: Global Real Time Testing And Simulation Software Revenue million Forecast, by Type 2020 & 2033
- Table 39: Global Real Time Testing And Simulation Software Revenue million Forecast, by Country 2020 & 2033
- Table 40: China Real Time Testing And Simulation Software Revenue (million) Forecast, by Application 2020 & 2033
- Table 41: India Real Time Testing And Simulation Software Revenue (million) Forecast, by Application 2020 & 2033
- Table 42: Japan Real Time Testing And Simulation Software Revenue (million) Forecast, by Application 2020 & 2033
- Table 43: South Korea Real Time Testing And Simulation Software Revenue (million) Forecast, by Application 2020 & 2033
- Table 44: ASEAN Real Time Testing And Simulation Software Revenue (million) Forecast, by Application 2020 & 2033
- Table 45: Oceania Real Time Testing And Simulation Software Revenue (million) Forecast, by Application 2020 & 2033
- Table 46: Rest of Asia Pacific Real Time Testing And Simulation Software Revenue (million) Forecast, by Application 2020 & 2033
Frequently Asked Questions
1. What is the projected Compound Annual Growth Rate (CAGR) of the Real Time Testing And Simulation Software?
The projected CAGR is approximately 5%.
2. Which companies are prominent players in the Real Time Testing And Simulation Software?
Key companies in the market include MathWorks, dSPACE, NI (Emerson), Artiza Networks, OPAL-RT Technologies, Vector Informatik, Keysight Technologies, Real-Time Innovations, RTDS Technologies, Rohde & Schwarz, OPAL-RT, Speedgoat, Ansys, ESI Group.
3. What are the main segments of the Real Time Testing And Simulation Software?
The market segments include Application, Type.
4. Can you provide details about the market size?
The market size is estimated to be USD 514 million as of 2022.
5. What are some drivers contributing to market growth?
N/A
6. What are the notable trends driving market growth?
N/A
7. Are there any restraints impacting market growth?
N/A
8. Can you provide examples of recent developments in the market?
N/A
9. What pricing options are available for accessing the report?
Pricing options include single-user, multi-user, and enterprise licenses priced at USD 4250.00, USD 6375.00, and USD 8500.00 respectively.
10. Is the market size provided in terms of value or volume?
The market size is provided in terms of value, measured in million.
11. Are there any specific market keywords associated with the report?
Yes, the market keyword associated with the report is "Real Time Testing And Simulation Software," which aids in identifying and referencing the specific market segment covered.
12. How do I determine which pricing option suits my needs best?
The pricing options vary based on user requirements and access needs. Individual users may opt for single-user licenses, while businesses requiring broader access may choose multi-user or enterprise licenses for cost-effective access to the report.
13. Are there any additional resources or data provided in the Real Time Testing And Simulation Software report?
While the report offers comprehensive insights, it's advisable to review the specific contents or supplementary materials provided to ascertain if additional resources or data are available.
14. How can I stay updated on further developments or reports in the Real Time Testing And Simulation Software?
To stay informed about further developments, trends, and reports in the Real Time Testing And Simulation Software, consider subscribing to industry newsletters, following relevant companies and organizations, or regularly checking reputable industry news sources and publications.
Methodology
Step 1 - Identification of Relevant Samples Size from Population Database


Step 2 - Approaches for Defining Global Market Size (Value, Volume* & Price*)

Note*: In applicable scenarios
Step 3 - Data Sources
Primary Research
- Web Analytics
- Survey Reports
- Research Institute
- Latest Research Reports
- Opinion Leaders
Secondary Research
- Annual Reports
- White Paper
- Latest Press Release
- Industry Association
- Paid Database
- Investor Presentations

Step 4 - Data Triangulation
Involves using different sources of information in order to increase the validity of a study
These sources are likely to be stakeholders in a program - participants, other researchers, program staff, other community members, and so on.
Then we put all data in single framework & apply various statistical tools to find out the dynamic on the market.
During the analysis stage, feedback from the stakeholder groups would be compared to determine areas of agreement as well as areas of divergence