

Key Insights
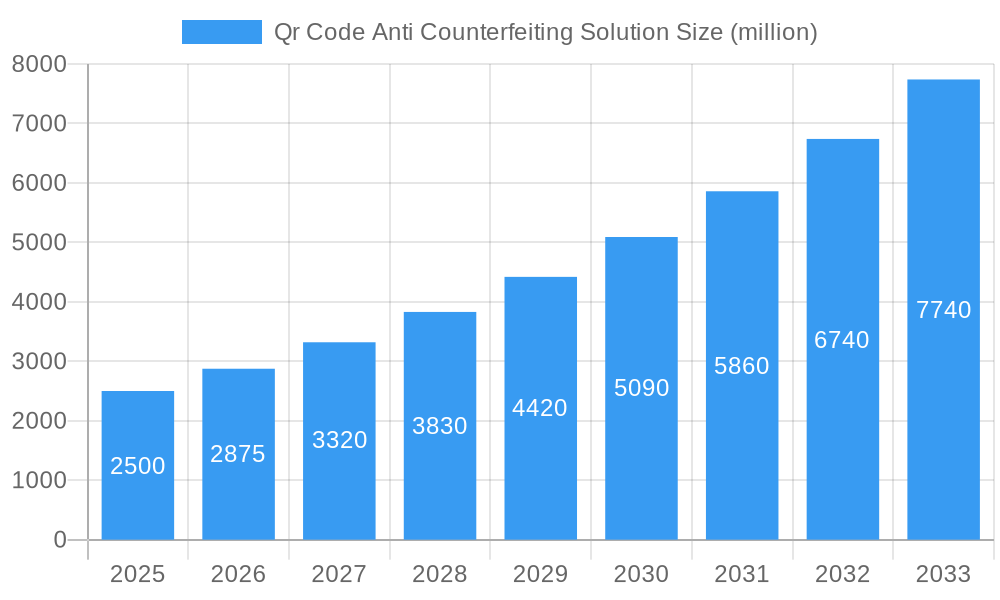
The QR code anti-counterfeiting solution market is experiencing robust growth, driven by the increasing prevalence of counterfeiting across various industries and the rising consumer demand for product authenticity verification. The market, estimated at $2.5 billion in 2025, is projected to witness a Compound Annual Growth Rate (CAGR) of 15% from 2025 to 2033, reaching an estimated value of $8 billion by 2033. This expansion is fueled by several factors, including the growing adoption of e-commerce, sophisticated counterfeiting techniques, and stringent government regulations aimed at combating illicit trade. Key drivers include the rising need for brand protection, enhanced supply chain transparency, and the ability of QR codes to provide secure, easily accessible product information. The market is segmented by technology (e.g., 2D codes, unique identifiers), industry (pharmaceuticals, luxury goods, food & beverage), and geography. Leading companies such as Systech International, Authentix, and TraceLink are actively shaping market dynamics through technological innovation and strategic partnerships. The increasing adoption of blockchain technology for enhanced security and traceability is a prominent trend, alongside the integration of QR codes with other anti-counterfeiting measures. While challenges remain, such as the potential for QR code manipulation and the cost of implementation, the overall market outlook remains extremely positive.
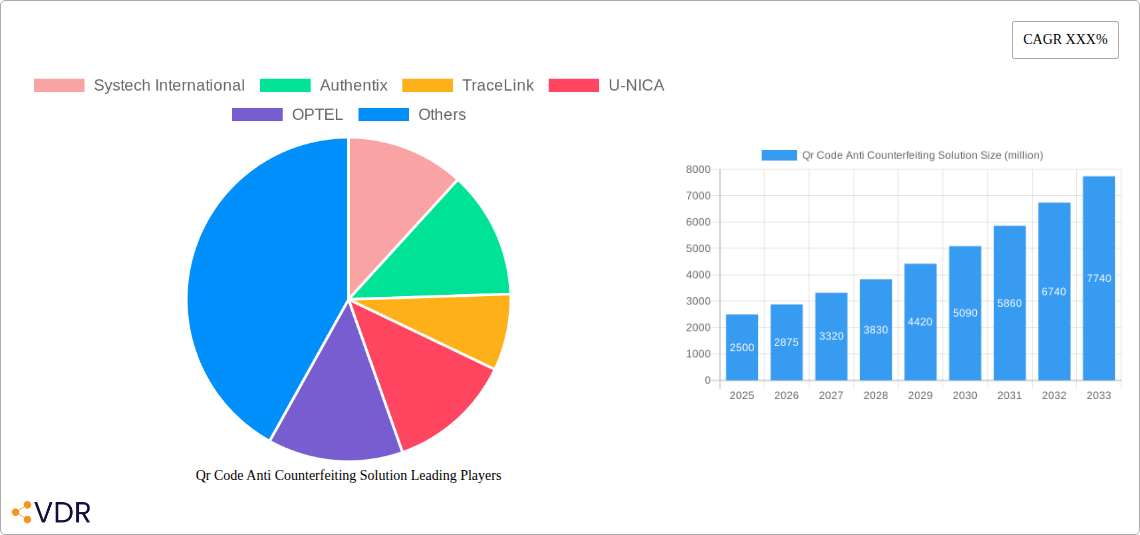
Qr Code Anti Counterfeiting Solution Market Size (In Billion)
The pharmaceutical and luxury goods sectors are currently the largest contributors to market revenue, but growth is anticipated across all segments. The Asia-Pacific region, experiencing rapid economic growth and a high incidence of counterfeiting, is poised to become a significant market in the coming years. However, the relatively high cost of implementation, especially for small and medium-sized enterprises (SMEs), and the potential for QR code manipulation, present challenges to wider adoption. Furthermore, consumer education on effective verification methods is crucial to drive sustained market growth. Despite these obstacles, the long-term forecast remains strong, indicating significant opportunities for companies offering innovative and scalable QR code anti-counterfeiting solutions.
Qr Code Anti Counterfeiting Solution Company Market Share
QR Code Anti-Counterfeiting Solution Market Report: 2019-2033
This comprehensive report provides a detailed analysis of the QR Code Anti-Counterfeiting Solution market, encompassing market dynamics, growth trends, regional dominance, product landscape, key players, and future outlook. The study period covers 2019-2033, with a base year of 2025 and a forecast period of 2025-2033. The report leverages extensive primary and secondary research to deliver actionable insights for industry professionals, investors, and strategic decision-makers. The market is segmented by various factors (detailed below) allowing for a granular understanding of the evolving landscape.
QR Code Anti-Counterfeiting Solution Market Dynamics & Structure
The QR code anti-counterfeiting solution market, valued at $XX million in 2025, is experiencing significant growth driven by increasing counterfeiting activities across various industries. Market concentration is moderate, with several key players holding substantial shares, while numerous smaller companies also compete. Technological innovation, primarily in areas like blockchain integration and AI-powered authentication, is a major driver. Stringent regulatory frameworks and increasing consumer awareness are further bolstering market expansion. Competitive substitutes, such as RFID tags and holographic labels, exist but QR codes maintain a competitive advantage due to their cost-effectiveness and ease of implementation. M&A activity within the sector has been moderate, with approximately XX deals recorded in the historical period (2019-2024). The parent market encompasses the broader anti-counterfeiting industry, while child markets include pharmaceuticals, luxury goods, and food & beverage.
- Market Concentration: Moderate, with top 5 players holding approximately XX% of the market share in 2025.
- Technological Innovation: Blockchain technology, AI-driven authentication, and improved data encryption are key drivers.
- Regulatory Landscape: Stringent regulations in various regions are pushing adoption.
- Competitive Substitutes: RFID, holographic labels, but QR codes remain cost-effective and accessible.
- M&A Activity: Approximately XX deals (2019-2024), indicating consolidation and strategic expansion.
- End-User Demographics: Strong demand from industries with high counterfeiting risks (pharmaceuticals, luxury goods).
QR Code Anti-Counterfeiting Solution Growth Trends & Insights
The QR code anti-counterfeiting solution market is projected to witness robust growth throughout the forecast period (2025-2033). The market size is estimated to reach $XX million by 2033, exhibiting a CAGR of XX%. This expansion is fueled by increasing consumer demand for authentic products, coupled with rising government initiatives to combat counterfeiting. Technological advancements contribute significantly to the market’s trajectory, with innovative solutions continuously improving authentication accuracy and efficiency. Consumer behavior is shifting toward greater product verification, fostering higher adoption rates. Market penetration in key industries like pharmaceuticals is expected to reach XX% by 2033.
- Market Size Evolution: Steady growth from $XX million (2019) to $XX million (2025), projected to $XX million by 2033.
- CAGR: XX% (2025-2033)
- Technological Disruptions: Continuous improvements in encryption, data analytics, and integration with blockchain technologies.
- Consumer Behavior Shifts: Increasing preference for verified products and heightened awareness of counterfeiting.
Dominant Regions, Countries, or Segments in QR Code Anti-Counterfeiting Solution
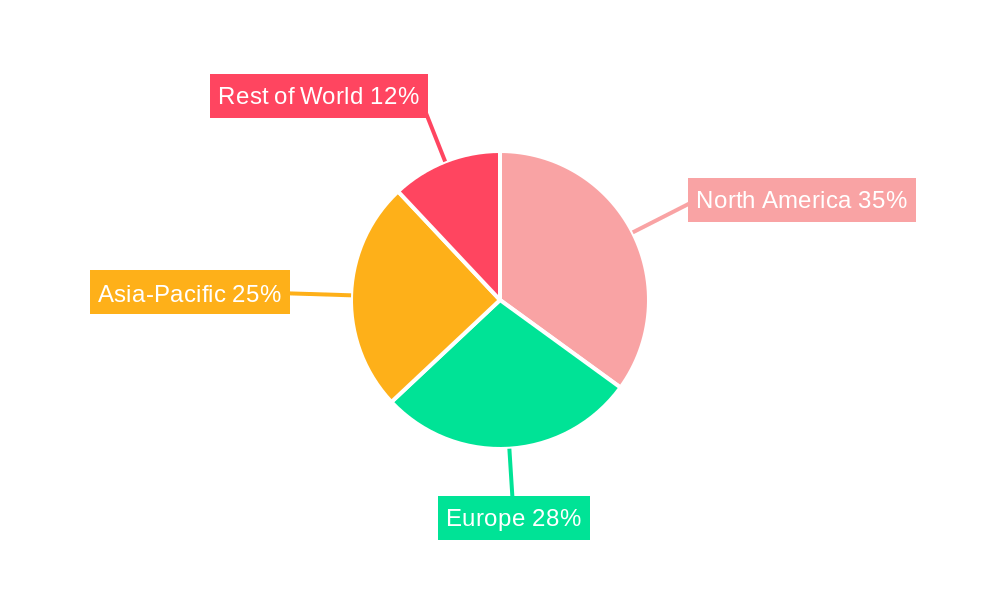
North America currently dominates the QR code anti-counterfeiting solution market, driven by strong regulatory support and a high concentration of key players. Europe follows closely, with robust growth fueled by stringent anti-counterfeiting regulations within the pharmaceutical and luxury goods sectors. Asia-Pacific is experiencing significant growth, particularly in countries like China and India, due to rising consumer awareness and increasing government initiatives. The pharmaceutical segment exhibits the highest growth potential, owing to the substantial financial implications associated with counterfeit drugs.
- North America: High market share, driven by strong regulatory frameworks and established players.
- Europe: Significant market presence, boosted by robust regulations and consumer awareness.
- Asia-Pacific: Fastest-growing region, fueled by rising consumer demand and government support.
- Pharmaceutical Segment: Highest growth potential due to significant risks and financial losses from counterfeits.
QR Code Anti-Counterfeiting Solution Product Landscape
The QR code anti-counterfeiting solution market offers a range of products, from simple QR code generators and scanners to sophisticated platforms integrating blockchain technology and AI. These solutions vary in complexity, features, and pricing, catering to diverse needs across various industries. Key features include secure data encryption, tamper-evident labels, and user-friendly interfaces for verification. Technological advancements are focused on improving data security, integrating with existing supply chain systems, and enhancing the user experience. Unique selling propositions include high security, ease of implementation, cost-effectiveness, and scalability.
Key Drivers, Barriers & Challenges in QR Code Anti-Counterfeiting Solution
Key Drivers: Rising consumer demand for authenticity, stringent government regulations against counterfeiting, increasing sophistication of counterfeiting techniques (driving demand for advanced solutions), and the cost-effectiveness of QR code technology compared to other solutions.
Key Challenges & Restraints: High initial investment costs for some advanced solutions, concerns about data security and privacy, lack of standardization across different platforms, and potential resistance from some businesses to adopt new technologies. Supply chain complexities also present a barrier to widespread adoption, with issues such as counterfeiting within the supply chain itself reducing effectiveness. These challenges collectively limit the speed of market penetration, although significant market growth remains expected.
Emerging Opportunities in QR Code Anti-Counterfeiting Solution
Untapped markets in developing economies, integration with IoT devices for real-time tracking, and the potential for utilizing QR codes for product traceability and supply chain management represent significant emerging opportunities. The growing demand for sustainable and ethical sourcing presents further opportunities for QR codes to enhance transparency and consumer trust. There's also increasing demand for user-friendly applications and the development of integrated solutions that combine QR codes with other security features.
Growth Accelerators in the QR Code Anti-Counterfeiting Solution Industry
Technological advancements, particularly in AI and blockchain integration, are driving growth. Strategic partnerships between technology providers and brand owners are fostering widespread adoption. Expansion into new industries and geographical regions, alongside increased consumer awareness of counterfeiting, is further accelerating market growth. Government initiatives and regulatory changes promoting authenticity are also acting as powerful growth catalysts.
Notable Milestones in QR Code Anti-Counterfeiting Solution Sector
- 2020: Increased adoption of blockchain technology for enhanced security.
- 2021: Several major pharmaceutical companies implement large-scale QR code verification programs.
- 2022: Launch of several new platforms integrating AI for improved counterfeit detection.
- 2023: Significant regulatory changes in key markets further promoting the adoption of QR code solutions.
- 2024: Several key mergers and acquisitions consolidating market share.
In-Depth QR Code Anti-Counterfeiting Solution Market Outlook
The QR code anti-counterfeiting solution market presents a robust outlook, driven by continuous technological innovation, expanding regulatory support, and increasing consumer demand for verified products. Strategic partnerships, market expansion into new sectors, and ongoing development of user-friendly applications are poised to drive significant future growth. The market's potential extends beyond simple product authentication, encompassing broader supply chain management and traceability solutions. The ongoing battle against counterfeiting ensures a sustained demand for effective and adaptable anti-counterfeiting solutions, making the QR code market a lucrative area for investment and growth.
Qr Code Anti Counterfeiting Solution Segmentation
-
1. Application
- 1.1. Electronics
- 1.2. Luxury
- 1.3. Pharmaceutical
- 1.4. Others
-
2. Type
- 2.1. Regular QR Code
- 2.2. Encrypted QR Code
Qr Code Anti Counterfeiting Solution Segmentation By Geography
-
1. North America
- 1.1. United States
- 1.2. Canada
- 1.3. Mexico
-
2. South America
- 2.1. Brazil
- 2.2. Argentina
- 2.3. Rest of South America
-
3. Europe
- 3.1. United Kingdom
- 3.2. Germany
- 3.3. France
- 3.4. Italy
- 3.5. Spain
- 3.6. Russia
- 3.7. Benelux
- 3.8. Nordics
- 3.9. Rest of Europe
-
4. Middle East & Africa
- 4.1. Turkey
- 4.2. Israel
- 4.3. GCC
- 4.4. North Africa
- 4.5. South Africa
- 4.6. Rest of Middle East & Africa
-
5. Asia Pacific
- 5.1. China
- 5.2. India
- 5.3. Japan
- 5.4. South Korea
- 5.5. ASEAN
- 5.6. Oceania
- 5.7. Rest of Asia Pacific
Qr Code Anti Counterfeiting Solution Regional Market Share
Geographic Coverage of Qr Code Anti Counterfeiting Solution
Qr Code Anti Counterfeiting Solution REPORT HIGHLIGHTS
| Aspects | Details |
|---|---|
| Study Period | 2020-2034 |
| Base Year | 2025 |
| Estimated Year | 2026 |
| Forecast Period | 2026-2034 |
| Historical Period | 2020-2025 |
| Growth Rate | CAGR of XXX% from 2020-2034 |
| Segmentation |
|
Table of Contents
- 1. Introduction
- 1.1. Research Scope
- 1.2. Market Segmentation
- 1.3. Research Objective
- 1.4. Definitions and Assumptions
- 2. Executive Summary
- 2.1. Market Snapshot
- 3. Market Dynamics
- 3.1. Market Drivers
- 3.2. Market Restrains
- 3.3. Market Trends
- 3.4. Market Opportunities
- 4. Market Factor Analysis
- 4.1. Porters Five Forces
- 4.1.1. Bargaining Power of Suppliers
- 4.1.2. Bargaining Power of Buyers
- 4.1.3. Threat of New Entrants
- 4.1.4. Threat of Substitutes
- 4.1.5. Competitive Rivalry
- 4.2. PESTEL analysis
- 4.3. BCG Analysis
- 4.3.1. Stars (High Growth, High Market Share)
- 4.3.2. Cash Cows (Low Growth, High Market Share)
- 4.3.3. Question Mark (High Growth, Low Market Share)
- 4.3.4. Dogs (Low Growth, Low Market Share)
- 4.4. Ansoff Matrix Analysis
- 4.5. Supply Chain Analysis
- 4.6. Regulatory Landscape
- 4.7. Current Market Potential and Opportunity Assessment (TAM–SAM–SOM Framework)
- 4.8. VDR Analyst Note
- 4.1. Porters Five Forces
- 5. Market Analysis, Insights and Forecast 2021-2033
- 5.1. Market Analysis, Insights and Forecast - by Application
- 5.1.1. Electronics
- 5.1.2. Luxury
- 5.1.3. Pharmaceutical
- 5.1.4. Others
- 5.2. Market Analysis, Insights and Forecast - by Type
- 5.2.1. Regular QR Code
- 5.2.2. Encrypted QR Code
- 5.3. Market Analysis, Insights and Forecast - by Region
- 5.3.1. North America
- 5.3.2. South America
- 5.3.3. Europe
- 5.3.4. Middle East & Africa
- 5.3.5. Asia Pacific
- 5.1. Market Analysis, Insights and Forecast - by Application
- 6. Global Qr Code Anti Counterfeiting Solution Analysis, Insights and Forecast, 2021-2033
- 6.1. Market Analysis, Insights and Forecast - by Application
- 6.1.1. Electronics
- 6.1.2. Luxury
- 6.1.3. Pharmaceutical
- 6.1.4. Others
- 6.2. Market Analysis, Insights and Forecast - by Type
- 6.2.1. Regular QR Code
- 6.2.2. Encrypted QR Code
- 6.1. Market Analysis, Insights and Forecast - by Application
- 7. North America Qr Code Anti Counterfeiting Solution Analysis, Insights and Forecast, 2021-2033
- 7.1. Market Analysis, Insights and Forecast - by Application
- 7.1.1. Electronics
- 7.1.2. Luxury
- 7.1.3. Pharmaceutical
- 7.1.4. Others
- 7.2. Market Analysis, Insights and Forecast - by Type
- 7.2.1. Regular QR Code
- 7.2.2. Encrypted QR Code
- 7.1. Market Analysis, Insights and Forecast - by Application
- 8. South America Qr Code Anti Counterfeiting Solution Analysis, Insights and Forecast, 2021-2033
- 8.1. Market Analysis, Insights and Forecast - by Application
- 8.1.1. Electronics
- 8.1.2. Luxury
- 8.1.3. Pharmaceutical
- 8.1.4. Others
- 8.2. Market Analysis, Insights and Forecast - by Type
- 8.2.1. Regular QR Code
- 8.2.2. Encrypted QR Code
- 8.1. Market Analysis, Insights and Forecast - by Application
- 9. Europe Qr Code Anti Counterfeiting Solution Analysis, Insights and Forecast, 2021-2033
- 9.1. Market Analysis, Insights and Forecast - by Application
- 9.1.1. Electronics
- 9.1.2. Luxury
- 9.1.3. Pharmaceutical
- 9.1.4. Others
- 9.2. Market Analysis, Insights and Forecast - by Type
- 9.2.1. Regular QR Code
- 9.2.2. Encrypted QR Code
- 9.1. Market Analysis, Insights and Forecast - by Application
- 10. Middle East & Africa Qr Code Anti Counterfeiting Solution Analysis, Insights and Forecast, 2021-2033
- 10.1. Market Analysis, Insights and Forecast - by Application
- 10.1.1. Electronics
- 10.1.2. Luxury
- 10.1.3. Pharmaceutical
- 10.1.4. Others
- 10.2. Market Analysis, Insights and Forecast - by Type
- 10.2.1. Regular QR Code
- 10.2.2. Encrypted QR Code
- 10.1. Market Analysis, Insights and Forecast - by Application
- 11. Asia Pacific Qr Code Anti Counterfeiting Solution Analysis, Insights and Forecast, 2021-2033
- 11.1. Market Analysis, Insights and Forecast - by Application
- 11.1.1. Electronics
- 11.1.2. Luxury
- 11.1.3. Pharmaceutical
- 11.1.4. Others
- 11.2. Market Analysis, Insights and Forecast - by Type
- 11.2.1. Regular QR Code
- 11.2.2. Encrypted QR Code
- 11.1. Market Analysis, Insights and Forecast - by Application
- 12. Competitive Analysis
- 12.1. Company Profiles
- 12.1.1 Systech International
- 12.1.1.1. Company Overview
- 12.1.1.2. Products
- 12.1.1.3. Company Financials
- 12.1.1.4. SWOT Analysis
- 12.1.2 Authentix
- 12.1.2.1. Company Overview
- 12.1.2.2. Products
- 12.1.2.3. Company Financials
- 12.1.2.4. SWOT Analysis
- 12.1.3 TraceLink
- 12.1.3.1. Company Overview
- 12.1.3.2. Products
- 12.1.3.3. Company Financials
- 12.1.3.4. SWOT Analysis
- 12.1.4 U-NICA
- 12.1.4.1. Company Overview
- 12.1.4.2. Products
- 12.1.4.3. Company Financials
- 12.1.4.4. SWOT Analysis
- 12.1.5 OPTEL
- 12.1.5.1. Company Overview
- 12.1.5.2. Products
- 12.1.5.3. Company Financials
- 12.1.5.4. SWOT Analysis
- 12.1.6 SecureRF
- 12.1.6.1. Company Overview
- 12.1.6.2. Products
- 12.1.6.3. Company Financials
- 12.1.6.4. SWOT Analysis
- 12.1.7 Kezzler
- 12.1.7.1. Company Overview
- 12.1.7.2. Products
- 12.1.7.3. Company Financials
- 12.1.7.4. SWOT Analysis
- 12.1.8 Scantrust
- 12.1.8.1. Company Overview
- 12.1.8.2. Products
- 12.1.8.3. Company Financials
- 12.1.8.4. SWOT Analysis
- 12.1.9 Chekkit Technologies
- 12.1.9.1. Company Overview
- 12.1.9.2. Products
- 12.1.9.3. Company Financials
- 12.1.9.4. SWOT Analysis
- 12.1.10 NeuroTags
- 12.1.10.1. Company Overview
- 12.1.10.2. Products
- 12.1.10.3. Company Financials
- 12.1.10.4. SWOT Analysis
- 12.1.11 Sproxil
- 12.1.11.1. Company Overview
- 12.1.11.2. Products
- 12.1.11.3. Company Financials
- 12.1.11.4. SWOT Analysis
- 12.1.12 Nabore
- 12.1.12.1. Company Overview
- 12.1.12.2. Products
- 12.1.12.3. Company Financials
- 12.1.12.4. SWOT Analysis
- 12.1.1 Systech International
- 12.2. Market Entropy
- 12.2.1 Company's Key Areas Served
- 12.2.2 Recent Developments
- 12.3. Company Market Share Analysis 2025
- 12.3.1 Top 5 Companies Market Share Analysis
- 12.3.2 Top 3 Companies Market Share Analysis
- 12.4. List of Potential Customers
- 13. Research Methodology
List of Figures
- Figure 1: Global Qr Code Anti Counterfeiting Solution Revenue Breakdown (million, %) by Region 2025 & 2033
- Figure 2: North America Qr Code Anti Counterfeiting Solution Revenue (million), by Application 2025 & 2033
- Figure 3: North America Qr Code Anti Counterfeiting Solution Revenue Share (%), by Application 2025 & 2033
- Figure 4: North America Qr Code Anti Counterfeiting Solution Revenue (million), by Type 2025 & 2033
- Figure 5: North America Qr Code Anti Counterfeiting Solution Revenue Share (%), by Type 2025 & 2033
- Figure 6: North America Qr Code Anti Counterfeiting Solution Revenue (million), by Country 2025 & 2033
- Figure 7: North America Qr Code Anti Counterfeiting Solution Revenue Share (%), by Country 2025 & 2033
- Figure 8: South America Qr Code Anti Counterfeiting Solution Revenue (million), by Application 2025 & 2033
- Figure 9: South America Qr Code Anti Counterfeiting Solution Revenue Share (%), by Application 2025 & 2033
- Figure 10: South America Qr Code Anti Counterfeiting Solution Revenue (million), by Type 2025 & 2033
- Figure 11: South America Qr Code Anti Counterfeiting Solution Revenue Share (%), by Type 2025 & 2033
- Figure 12: South America Qr Code Anti Counterfeiting Solution Revenue (million), by Country 2025 & 2033
- Figure 13: South America Qr Code Anti Counterfeiting Solution Revenue Share (%), by Country 2025 & 2033
- Figure 14: Europe Qr Code Anti Counterfeiting Solution Revenue (million), by Application 2025 & 2033
- Figure 15: Europe Qr Code Anti Counterfeiting Solution Revenue Share (%), by Application 2025 & 2033
- Figure 16: Europe Qr Code Anti Counterfeiting Solution Revenue (million), by Type 2025 & 2033
- Figure 17: Europe Qr Code Anti Counterfeiting Solution Revenue Share (%), by Type 2025 & 2033
- Figure 18: Europe Qr Code Anti Counterfeiting Solution Revenue (million), by Country 2025 & 2033
- Figure 19: Europe Qr Code Anti Counterfeiting Solution Revenue Share (%), by Country 2025 & 2033
- Figure 20: Middle East & Africa Qr Code Anti Counterfeiting Solution Revenue (million), by Application 2025 & 2033
- Figure 21: Middle East & Africa Qr Code Anti Counterfeiting Solution Revenue Share (%), by Application 2025 & 2033
- Figure 22: Middle East & Africa Qr Code Anti Counterfeiting Solution Revenue (million), by Type 2025 & 2033
- Figure 23: Middle East & Africa Qr Code Anti Counterfeiting Solution Revenue Share (%), by Type 2025 & 2033
- Figure 24: Middle East & Africa Qr Code Anti Counterfeiting Solution Revenue (million), by Country 2025 & 2033
- Figure 25: Middle East & Africa Qr Code Anti Counterfeiting Solution Revenue Share (%), by Country 2025 & 2033
- Figure 26: Asia Pacific Qr Code Anti Counterfeiting Solution Revenue (million), by Application 2025 & 2033
- Figure 27: Asia Pacific Qr Code Anti Counterfeiting Solution Revenue Share (%), by Application 2025 & 2033
- Figure 28: Asia Pacific Qr Code Anti Counterfeiting Solution Revenue (million), by Type 2025 & 2033
- Figure 29: Asia Pacific Qr Code Anti Counterfeiting Solution Revenue Share (%), by Type 2025 & 2033
- Figure 30: Asia Pacific Qr Code Anti Counterfeiting Solution Revenue (million), by Country 2025 & 2033
- Figure 31: Asia Pacific Qr Code Anti Counterfeiting Solution Revenue Share (%), by Country 2025 & 2033
List of Tables
- Table 1: Global Qr Code Anti Counterfeiting Solution Revenue million Forecast, by Application 2020 & 2033
- Table 2: Global Qr Code Anti Counterfeiting Solution Revenue million Forecast, by Type 2020 & 2033
- Table 3: Global Qr Code Anti Counterfeiting Solution Revenue million Forecast, by Region 2020 & 2033
- Table 4: Global Qr Code Anti Counterfeiting Solution Revenue million Forecast, by Application 2020 & 2033
- Table 5: Global Qr Code Anti Counterfeiting Solution Revenue million Forecast, by Type 2020 & 2033
- Table 6: Global Qr Code Anti Counterfeiting Solution Revenue million Forecast, by Country 2020 & 2033
- Table 7: United States Qr Code Anti Counterfeiting Solution Revenue (million) Forecast, by Application 2020 & 2033
- Table 8: Canada Qr Code Anti Counterfeiting Solution Revenue (million) Forecast, by Application 2020 & 2033
- Table 9: Mexico Qr Code Anti Counterfeiting Solution Revenue (million) Forecast, by Application 2020 & 2033
- Table 10: Global Qr Code Anti Counterfeiting Solution Revenue million Forecast, by Application 2020 & 2033
- Table 11: Global Qr Code Anti Counterfeiting Solution Revenue million Forecast, by Type 2020 & 2033
- Table 12: Global Qr Code Anti Counterfeiting Solution Revenue million Forecast, by Country 2020 & 2033
- Table 13: Brazil Qr Code Anti Counterfeiting Solution Revenue (million) Forecast, by Application 2020 & 2033
- Table 14: Argentina Qr Code Anti Counterfeiting Solution Revenue (million) Forecast, by Application 2020 & 2033
- Table 15: Rest of South America Qr Code Anti Counterfeiting Solution Revenue (million) Forecast, by Application 2020 & 2033
- Table 16: Global Qr Code Anti Counterfeiting Solution Revenue million Forecast, by Application 2020 & 2033
- Table 17: Global Qr Code Anti Counterfeiting Solution Revenue million Forecast, by Type 2020 & 2033
- Table 18: Global Qr Code Anti Counterfeiting Solution Revenue million Forecast, by Country 2020 & 2033
- Table 19: United Kingdom Qr Code Anti Counterfeiting Solution Revenue (million) Forecast, by Application 2020 & 2033
- Table 20: Germany Qr Code Anti Counterfeiting Solution Revenue (million) Forecast, by Application 2020 & 2033
- Table 21: France Qr Code Anti Counterfeiting Solution Revenue (million) Forecast, by Application 2020 & 2033
- Table 22: Italy Qr Code Anti Counterfeiting Solution Revenue (million) Forecast, by Application 2020 & 2033
- Table 23: Spain Qr Code Anti Counterfeiting Solution Revenue (million) Forecast, by Application 2020 & 2033
- Table 24: Russia Qr Code Anti Counterfeiting Solution Revenue (million) Forecast, by Application 2020 & 2033
- Table 25: Benelux Qr Code Anti Counterfeiting Solution Revenue (million) Forecast, by Application 2020 & 2033
- Table 26: Nordics Qr Code Anti Counterfeiting Solution Revenue (million) Forecast, by Application 2020 & 2033
- Table 27: Rest of Europe Qr Code Anti Counterfeiting Solution Revenue (million) Forecast, by Application 2020 & 2033
- Table 28: Global Qr Code Anti Counterfeiting Solution Revenue million Forecast, by Application 2020 & 2033
- Table 29: Global Qr Code Anti Counterfeiting Solution Revenue million Forecast, by Type 2020 & 2033
- Table 30: Global Qr Code Anti Counterfeiting Solution Revenue million Forecast, by Country 2020 & 2033
- Table 31: Turkey Qr Code Anti Counterfeiting Solution Revenue (million) Forecast, by Application 2020 & 2033
- Table 32: Israel Qr Code Anti Counterfeiting Solution Revenue (million) Forecast, by Application 2020 & 2033
- Table 33: GCC Qr Code Anti Counterfeiting Solution Revenue (million) Forecast, by Application 2020 & 2033
- Table 34: North Africa Qr Code Anti Counterfeiting Solution Revenue (million) Forecast, by Application 2020 & 2033
- Table 35: South Africa Qr Code Anti Counterfeiting Solution Revenue (million) Forecast, by Application 2020 & 2033
- Table 36: Rest of Middle East & Africa Qr Code Anti Counterfeiting Solution Revenue (million) Forecast, by Application 2020 & 2033
- Table 37: Global Qr Code Anti Counterfeiting Solution Revenue million Forecast, by Application 2020 & 2033
- Table 38: Global Qr Code Anti Counterfeiting Solution Revenue million Forecast, by Type 2020 & 2033
- Table 39: Global Qr Code Anti Counterfeiting Solution Revenue million Forecast, by Country 2020 & 2033
- Table 40: China Qr Code Anti Counterfeiting Solution Revenue (million) Forecast, by Application 2020 & 2033
- Table 41: India Qr Code Anti Counterfeiting Solution Revenue (million) Forecast, by Application 2020 & 2033
- Table 42: Japan Qr Code Anti Counterfeiting Solution Revenue (million) Forecast, by Application 2020 & 2033
- Table 43: South Korea Qr Code Anti Counterfeiting Solution Revenue (million) Forecast, by Application 2020 & 2033
- Table 44: ASEAN Qr Code Anti Counterfeiting Solution Revenue (million) Forecast, by Application 2020 & 2033
- Table 45: Oceania Qr Code Anti Counterfeiting Solution Revenue (million) Forecast, by Application 2020 & 2033
- Table 46: Rest of Asia Pacific Qr Code Anti Counterfeiting Solution Revenue (million) Forecast, by Application 2020 & 2033
Frequently Asked Questions
1. What is the projected Compound Annual Growth Rate (CAGR) of the Qr Code Anti Counterfeiting Solution?
The projected CAGR is approximately XXX%.
2. Which companies are prominent players in the Qr Code Anti Counterfeiting Solution?
Key companies in the market include Systech International, Authentix, TraceLink, U-NICA, OPTEL, SecureRF, Kezzler, Scantrust, Chekkit Technologies, NeuroTags, Sproxil, Nabore.
3. What are the main segments of the Qr Code Anti Counterfeiting Solution?
The market segments include Application, Type.
4. Can you provide details about the market size?
The market size is estimated to be USD XXX million as of 2022.
5. What are some drivers contributing to market growth?
N/A
6. What are the notable trends driving market growth?
N/A
7. Are there any restraints impacting market growth?
N/A
8. Can you provide examples of recent developments in the market?
N/A
9. What pricing options are available for accessing the report?
Pricing options include single-user, multi-user, and enterprise licenses priced at USD 3950.00, USD 5925.00, and USD 7900.00 respectively.
10. Is the market size provided in terms of value or volume?
The market size is provided in terms of value, measured in million.
11. Are there any specific market keywords associated with the report?
Yes, the market keyword associated with the report is "Qr Code Anti Counterfeiting Solution," which aids in identifying and referencing the specific market segment covered.
12. How do I determine which pricing option suits my needs best?
The pricing options vary based on user requirements and access needs. Individual users may opt for single-user licenses, while businesses requiring broader access may choose multi-user or enterprise licenses for cost-effective access to the report.
13. Are there any additional resources or data provided in the Qr Code Anti Counterfeiting Solution report?
While the report offers comprehensive insights, it's advisable to review the specific contents or supplementary materials provided to ascertain if additional resources or data are available.
14. How can I stay updated on further developments or reports in the Qr Code Anti Counterfeiting Solution?
To stay informed about further developments, trends, and reports in the Qr Code Anti Counterfeiting Solution, consider subscribing to industry newsletters, following relevant companies and organizations, or regularly checking reputable industry news sources and publications.
Methodology
Step 1 - Identification of Relevant Samples Size from Population Database


Step 2 - Approaches for Defining Global Market Size (Value, Volume* & Price*)

Note*: In applicable scenarios
Step 3 - Data Sources
Primary Research
- Web Analytics
- Survey Reports
- Research Institute
- Latest Research Reports
- Opinion Leaders
Secondary Research
- Annual Reports
- White Paper
- Latest Press Release
- Industry Association
- Paid Database
- Investor Presentations

Step 4 - Data Triangulation
Involves using different sources of information in order to increase the validity of a study
These sources are likely to be stakeholders in a program - participants, other researchers, program staff, other community members, and so on.
Then we put all data in single framework & apply various statistical tools to find out the dynamic on the market.
During the analysis stage, feedback from the stakeholder groups would be compared to determine areas of agreement as well as areas of divergence