

Key Insights
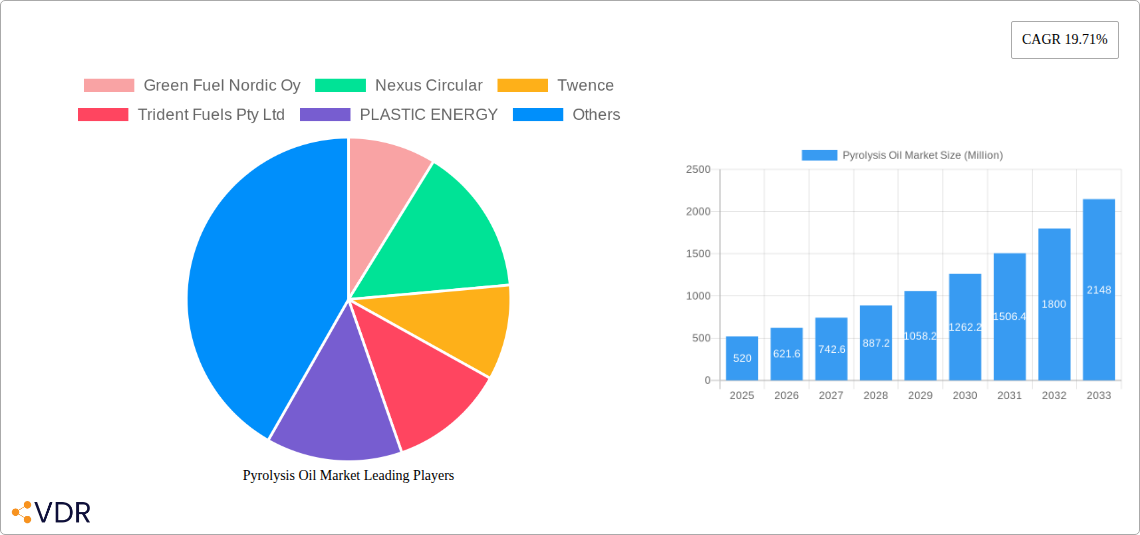
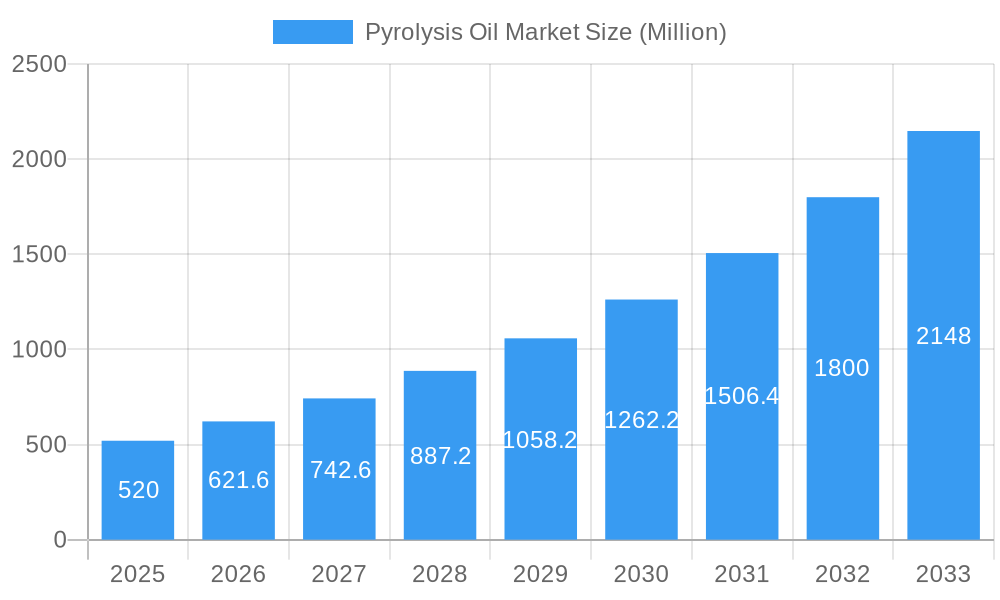
The pyrolysis oil market, valued at $520 million in 2025, is experiencing robust growth, projected to expand at a Compound Annual Growth Rate (CAGR) of 19.71% from 2025 to 2033. This significant expansion is driven by several key factors. Firstly, the increasing global demand for sustainable and renewable energy sources is fueling the adoption of pyrolysis oil as a cleaner alternative to fossil fuels. Governments worldwide are implementing stricter environmental regulations, further incentivizing the shift towards bio-based fuels. Secondly, the rising volume of plastic waste and other non-recyclable materials presents a significant opportunity for pyrolysis oil production, offering a solution for waste management and resource recovery. The conversion of waste materials into valuable energy products reduces landfill burden and promotes a circular economy. Furthermore, advancements in pyrolysis technology are leading to improved efficiency and cost-effectiveness, making pyrolysis oil a more attractive option for various applications, including fuel production and chemical manufacturing. The market is segmented by raw materials (waste plastics, waste rubber, wood, oil sludge, other) and applications (fuels, chemicals). The geographic distribution of the market is broad, with North America, Europe, and Asia-Pacific representing significant regional segments, each exhibiting unique growth trajectories based on their specific regulatory landscapes and waste management practices. Growth within specific regions is likely influenced by governmental incentives, the availability of waste feedstocks, and technological developments in the industry.
Pyrolysis Oil Market Market Size (In Million)
The competitive landscape is characterized by a mix of established players and emerging companies. Key players are continuously investing in research and development to enhance pyrolysis technologies, expand production capacities, and secure strategic partnerships to strengthen their market positions. The future of the pyrolysis oil market looks bright, driven by increasing environmental awareness, technological advancements, and favorable government policies. The market's growth trajectory will be heavily influenced by the scalability of technology, the availability of feedstock, and the overall evolution of sustainable energy solutions. Further investment in research and development will be crucial in improving the efficiency, scalability, and environmental sustainability of pyrolysis oil production processes. The market is poised for substantial growth, offering opportunities for investors, businesses, and researchers alike.
Pyrolysis Oil Market Company Market Share
Pyrolysis Oil Market: A Comprehensive Report (2019-2033)
This comprehensive report provides an in-depth analysis of the Pyrolysis Oil Market, encompassing market dynamics, growth trends, regional analysis, product landscape, key players, and future outlook. The report covers the period from 2019 to 2033, with a focus on the forecast period from 2025 to 2033. The study utilizes data from 2019-2024 as the historical period, with 2025 serving as both the base year and the estimated year. The report delves into the parent market of waste recycling and the child market of biofuels, providing valuable insights for industry professionals. Market values are presented in million units.
Pyrolysis Oil Market Market Dynamics & Structure
The pyrolysis oil market is characterized by a moderately concentrated structure, with key players constantly vying for market share. Technological innovation is a major driver, with companies continuously seeking improvements in efficiency and yield. Stringent environmental regulations are pushing the adoption of pyrolysis technology as a sustainable waste management solution. Competitive substitutes include traditional fossil fuels, but the rising costs and environmental concerns associated with them are fueling the shift toward pyrolysis oil. The end-user demographics are diverse, spanning the fuels, chemicals, and various industrial sectors. Significant M&A activity is observed, reflecting the increasing attractiveness and strategic importance of this market.
- Market Concentration: Moderately concentrated, with the top 5 players holding approximately xx% of the market share (2024).
- Technological Innovation: Focus on improving energy efficiency, yield, and reducing operational costs.
- Regulatory Framework: Stringent environmental regulations are driving market growth.
- Competitive Substitutes: Traditional fossil fuels face increasing competition due to environmental concerns.
- End-User Demographics: Fuels, chemicals, and various industrial sectors.
- M&A Trends: Increasing number of mergers and acquisitions, reflecting market consolidation and strategic investments (xx deals in the past 5 years).
Pyrolysis Oil Market Growth Trends & Insights
The pyrolysis oil market has witnessed substantial growth over the past few years, driven by the increasing need for sustainable waste management solutions and the growing demand for biofuels. The market size is projected to expand significantly over the forecast period, with a Compound Annual Growth Rate (CAGR) of xx% from 2025 to 2033, reaching a market value of xx million units by 2033. This growth is fueled by technological advancements, such as improved reactor designs and catalytic processes, leading to increased efficiency and higher yields. Furthermore, government policies promoting renewable energy and waste-to-energy initiatives are also contributing to the adoption of pyrolysis technology. Consumer behavior is shifting towards more sustainable products and processes, driving the demand for pyrolysis oil as a greener alternative. Market penetration is expected to increase from xx% in 2025 to xx% in 2033.
Dominant Regions, Countries, or Segments in Pyrolysis Oil Market
The North American and European regions currently dominate the pyrolysis oil market, driven by stringent environmental regulations and robust waste management infrastructure. Within these regions, countries with established recycling programs and readily available waste plastic feedstock show higher market penetration. The Waste Plastic segment stands out as the dominant raw material, contributing significantly to the market size, followed by Waste Rubber. The Fuels application segment is the leading driver of market growth, benefiting from increasing demand for renewable energy sources.
- Key Drivers in North America: Stringent environmental regulations, readily available waste plastic feedstock, and government support for renewable energy.
- Key Drivers in Europe: Well-established recycling infrastructure, supportive government policies, and increasing awareness of environmental sustainability.
- Dominant Raw Material: Waste Plastic (xx% market share in 2024).
- Dominant Application: Fuels (xx% market share in 2024).
Pyrolysis Oil Market Product Landscape
Pyrolysis oil products are characterized by their diverse applications across various industries, ranging from fuels to chemical feedstocks. Recent innovations have focused on enhancing the quality and yield of pyrolysis oil, including improvements in purification processes and the development of advanced reactor technologies. This has resulted in products with better performance characteristics and reduced impurities. Unique selling propositions include the sustainable nature of the production process and the potential to convert non-recyclable waste into valuable resources.
Key Drivers, Barriers & Challenges in Pyrolysis Oil Market
Key Drivers:
- Growing concerns about environmental sustainability and plastic waste management.
- Increasing demand for renewable energy sources and biofuels.
- Favorable government policies and incentives promoting renewable energy and waste-to-energy projects.
- Technological advancements improving pyrolysis efficiency and product quality.
Key Challenges:
- High initial capital investment costs associated with establishing pyrolysis plants.
- Fluctuations in feedstock availability and pricing.
- Technological limitations in producing high-quality pyrolysis oil suitable for all applications.
- Regulatory hurdles and permitting processes for establishing new pyrolysis facilities. These can lead to delays and increased costs.
Emerging Opportunities in Pyrolysis Oil Market
Emerging opportunities are seen in the application of pyrolysis oil in the production of specialty chemicals and the expansion into untapped markets in developing economies. Innovative applications, such as the use of pyrolysis oil in the production of bioplastics and other value-added products, are also emerging. Changing consumer preferences towards sustainable and environmentally friendly products further fuel market expansion.
Growth Accelerators in the Pyrolysis Oil Market Industry
Technological breakthroughs in reactor design and catalytic processes will accelerate market growth by improving efficiency, yield, and product quality. Strategic partnerships between waste management companies, energy producers, and chemical manufacturers will play a crucial role in scaling up production and expanding market reach. Expanding into new geographical markets, particularly in regions with significant plastic waste generation and supportive government policies, will further drive market expansion.
Key Players Shaping the Pyrolysis Oil Market Market
- Green Fuel Nordic Oy
- Nexus Circular
- Twence
- Trident Fuels Pty Ltd
- PLASTIC ENERGY
- Ensyn
- Bioenergy Ae Cote-Nord
- Alterra Energy LLC
- New Energy Kft
- Mk Aromatics Limited
- New Hope Energy
- Quantafuel ASA
- Plastic Advanced Recycling Corp
- Setra Group
Notable Milestones in Pyrolysis Oil Market Sector
- June 2023: Audi Hungaria's collaboration with New Energy Kft. for tire waste pyrolysis demonstrates the growing industrial applications of this technology.
- February 2023: Alterra Energy's licensing agreement signifies significant capacity expansion in the US market.
- May 2022: ArcelorMittal's agreement with BioÉnergie AE Côte-Nord highlights the increasing demand for pyrolysis oil as an industrial fuel source.
- May 2022: New Hope Energy and TotalEnergies' joint venture signifies the industry's commitment to advanced plastic recycling and the creation of a circular economy.
In-Depth Pyrolysis Oil Market Market Outlook
The future of the pyrolysis oil market looks promising, with substantial growth potential driven by ongoing technological advancements, increasing environmental concerns, and supportive government policies. Strategic partnerships and investments in expanding capacity will be key to unlocking the full potential of this market. The focus on circular economy initiatives and the drive to reduce plastic waste will continue to propel market growth in the coming years.
Pyrolysis Oil Market Segmentation
-
1. Raw Material
- 1.1. Waste Plastic
- 1.2. Waste Rubber
- 1.3. Wood
- 1.4. Oil Sludge
- 1.5. Other Raw Materials
-
2. Application
- 2.1. Fuels
- 2.2. Chemicals
Pyrolysis Oil Market Segmentation By Geography
-
1. Asia Pacific
- 1.1. China
- 1.2. India
- 1.3. Japan
- 1.4. Thailand
- 1.5. Vietnam
- 1.6. Malaysia
- 1.7. Indonesia
- 1.8. South Korea
- 1.9. Rest of Asia Pacific
-
2. North America
- 2.1. United States
- 2.2. Canada
- 2.3. Mexico
-
3. Europe
- 3.1. Germany
- 3.2. France
- 3.3. United Kingdom
- 3.4. Italy
- 3.5. NORDIC
- 3.6. Spain
- 3.7. Turkey
- 3.8. Russia
- 3.9. Rest of Europe
-
4. South America
- 4.1. Brazil
- 4.2. Argentina
- 4.3. Colombia
- 4.4. Rest of South America
-
5. Middle East and Africa
- 5.1. Saudi Arabia
- 5.2. South Africa
- 5.3. Morocco
- 5.4. Qatar
- 5.5. Egypt
- 5.6. United Arab Emirates
- 5.7. Nigeria
- 5.8. Rest of Middle East and Africa
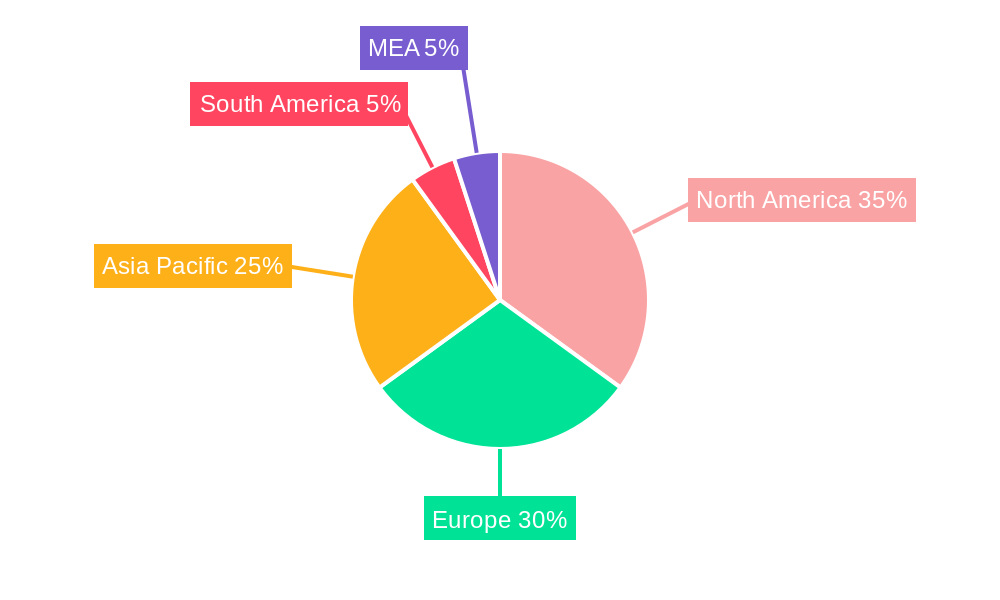
Pyrolysis Oil Market Regional Market Share
Geographic Coverage of Pyrolysis Oil Market
Pyrolysis Oil Market REPORT HIGHLIGHTS
| Aspects | Details |
|---|---|
| Study Period | 2020-2034 |
| Base Year | 2025 |
| Estimated Year | 2026 |
| Forecast Period | 2026-2034 |
| Historical Period | 2020-2025 |
| Growth Rate | CAGR of 19.71% from 2020-2034 |
| Segmentation |
|
Table of Contents
- 1. Introduction
- 1.1. Research Scope
- 1.2. Market Segmentation
- 1.3. Research Objective
- 1.4. Definitions and Assumptions
- 2. Executive Summary
- 2.1. Market Snapshot
- 3. Market Dynamics
- 3.1. Market Drivers
- 3.2. Market Restrains
- 3.3. Market Trends
- 3.4. Market Opportunities
- 4. Market Factor Analysis
- 4.1. Porters Five Forces
- 4.1.1. Bargaining Power of Suppliers
- 4.1.2. Bargaining Power of Buyers
- 4.1.3. Threat of New Entrants
- 4.1.4. Threat of Substitutes
- 4.1.5. Competitive Rivalry
- 4.2. PESTEL analysis
- 4.3. BCG Analysis
- 4.3.1. Stars (High Growth, High Market Share)
- 4.3.2. Cash Cows (Low Growth, High Market Share)
- 4.3.3. Question Mark (High Growth, Low Market Share)
- 4.3.4. Dogs (Low Growth, Low Market Share)
- 4.4. Ansoff Matrix Analysis
- 4.5. Supply Chain Analysis
- 4.6. Regulatory Landscape
- 4.7. Current Market Potential and Opportunity Assessment (TAM–SAM–SOM Framework)
- 4.8. VDR Analyst Note
- 4.1. Porters Five Forces
- 5. Market Analysis, Insights and Forecast 2021-2033
- 5.1. Market Analysis, Insights and Forecast - by Raw Material
- 5.1.1. Waste Plastic
- 5.1.2. Waste Rubber
- 5.1.3. Wood
- 5.1.4. Oil Sludge
- 5.1.5. Other Raw Materials
- 5.2. Market Analysis, Insights and Forecast - by Application
- 5.2.1. Fuels
- 5.2.2. Chemicals
- 5.3. Market Analysis, Insights and Forecast - by Region
- 5.3.1. Asia Pacific
- 5.3.2. North America
- 5.3.3. Europe
- 5.3.4. South America
- 5.3.5. Middle East and Africa
- 5.1. Market Analysis, Insights and Forecast - by Raw Material
- 6. Global Pyrolysis Oil Market Analysis, Insights and Forecast, 2021-2033
- 6.1. Market Analysis, Insights and Forecast - by Raw Material
- 6.1.1. Waste Plastic
- 6.1.2. Waste Rubber
- 6.1.3. Wood
- 6.1.4. Oil Sludge
- 6.1.5. Other Raw Materials
- 6.2. Market Analysis, Insights and Forecast - by Application
- 6.2.1. Fuels
- 6.2.2. Chemicals
- 6.1. Market Analysis, Insights and Forecast - by Raw Material
- 7. Asia Pacific Pyrolysis Oil Market Analysis, Insights and Forecast, 2021-2033
- 7.1. Market Analysis, Insights and Forecast - by Raw Material
- 7.1.1. Waste Plastic
- 7.1.2. Waste Rubber
- 7.1.3. Wood
- 7.1.4. Oil Sludge
- 7.1.5. Other Raw Materials
- 7.2. Market Analysis, Insights and Forecast - by Application
- 7.2.1. Fuels
- 7.2.2. Chemicals
- 7.1. Market Analysis, Insights and Forecast - by Raw Material
- 8. North America Pyrolysis Oil Market Analysis, Insights and Forecast, 2021-2033
- 8.1. Market Analysis, Insights and Forecast - by Raw Material
- 8.1.1. Waste Plastic
- 8.1.2. Waste Rubber
- 8.1.3. Wood
- 8.1.4. Oil Sludge
- 8.1.5. Other Raw Materials
- 8.2. Market Analysis, Insights and Forecast - by Application
- 8.2.1. Fuels
- 8.2.2. Chemicals
- 8.1. Market Analysis, Insights and Forecast - by Raw Material
- 9. Europe Pyrolysis Oil Market Analysis, Insights and Forecast, 2021-2033
- 9.1. Market Analysis, Insights and Forecast - by Raw Material
- 9.1.1. Waste Plastic
- 9.1.2. Waste Rubber
- 9.1.3. Wood
- 9.1.4. Oil Sludge
- 9.1.5. Other Raw Materials
- 9.2. Market Analysis, Insights and Forecast - by Application
- 9.2.1. Fuels
- 9.2.2. Chemicals
- 9.1. Market Analysis, Insights and Forecast - by Raw Material
- 10. South America Pyrolysis Oil Market Analysis, Insights and Forecast, 2021-2033
- 10.1. Market Analysis, Insights and Forecast - by Raw Material
- 10.1.1. Waste Plastic
- 10.1.2. Waste Rubber
- 10.1.3. Wood
- 10.1.4. Oil Sludge
- 10.1.5. Other Raw Materials
- 10.2. Market Analysis, Insights and Forecast - by Application
- 10.2.1. Fuels
- 10.2.2. Chemicals
- 10.1. Market Analysis, Insights and Forecast - by Raw Material
- 11. Middle East and Africa Pyrolysis Oil Market Analysis, Insights and Forecast, 2021-2033
- 11.1. Market Analysis, Insights and Forecast - by Raw Material
- 11.1.1. Waste Plastic
- 11.1.2. Waste Rubber
- 11.1.3. Wood
- 11.1.4. Oil Sludge
- 11.1.5. Other Raw Materials
- 11.2. Market Analysis, Insights and Forecast - by Application
- 11.2.1. Fuels
- 11.2.2. Chemicals
- 11.1. Market Analysis, Insights and Forecast - by Raw Material
- 12. Competitive Analysis
- 12.1. Company Profiles
- 12.1.1 Green Fuel Nordic Oy
- 12.1.1.1. Company Overview
- 12.1.1.2. Products
- 12.1.1.3. Company Financials
- 12.1.1.4. SWOT Analysis
- 12.1.2 Nexus Circular
- 12.1.2.1. Company Overview
- 12.1.2.2. Products
- 12.1.2.3. Company Financials
- 12.1.2.4. SWOT Analysis
- 12.1.3 Twence
- 12.1.3.1. Company Overview
- 12.1.3.2. Products
- 12.1.3.3. Company Financials
- 12.1.3.4. SWOT Analysis
- 12.1.4 Trident Fuels Pty Ltd
- 12.1.4.1. Company Overview
- 12.1.4.2. Products
- 12.1.4.3. Company Financials
- 12.1.4.4. SWOT Analysis
- 12.1.5 PLASTIC ENERGY
- 12.1.5.1. Company Overview
- 12.1.5.2. Products
- 12.1.5.3. Company Financials
- 12.1.5.4. SWOT Analysis
- 12.1.6 Ensyn
- 12.1.6.1. Company Overview
- 12.1.6.2. Products
- 12.1.6.3. Company Financials
- 12.1.6.4. SWOT Analysis
- 12.1.7 Bioenergy Ae Cote-Nord
- 12.1.7.1. Company Overview
- 12.1.7.2. Products
- 12.1.7.3. Company Financials
- 12.1.7.4. SWOT Analysis
- 12.1.8 Alterra Energy LLC
- 12.1.8.1. Company Overview
- 12.1.8.2. Products
- 12.1.8.3. Company Financials
- 12.1.8.4. SWOT Analysis
- 12.1.9 New Energy Kft
- 12.1.9.1. Company Overview
- 12.1.9.2. Products
- 12.1.9.3. Company Financials
- 12.1.9.4. SWOT Analysis
- 12.1.10 Mk Aromatics Limited
- 12.1.10.1. Company Overview
- 12.1.10.2. Products
- 12.1.10.3. Company Financials
- 12.1.10.4. SWOT Analysis
- 12.1.11 New Hope Energy
- 12.1.11.1. Company Overview
- 12.1.11.2. Products
- 12.1.11.3. Company Financials
- 12.1.11.4. SWOT Analysis
- 12.1.12 Quantafuel ASA
- 12.1.12.1. Company Overview
- 12.1.12.2. Products
- 12.1.12.3. Company Financials
- 12.1.12.4. SWOT Analysis
- 12.1.13 Plastic Advanced Recycling Corp
- 12.1.13.1. Company Overview
- 12.1.13.2. Products
- 12.1.13.3. Company Financials
- 12.1.13.4. SWOT Analysis
- 12.1.14 Setra Group
- 12.1.14.1. Company Overview
- 12.1.14.2. Products
- 12.1.14.3. Company Financials
- 12.1.14.4. SWOT Analysis
- 12.1.1 Green Fuel Nordic Oy
- 12.2. Market Entropy
- 12.2.1 Company's Key Areas Served
- 12.2.2 Recent Developments
- 12.3. Company Market Share Analysis 2025
- 12.3.1 Top 5 Companies Market Share Analysis
- 12.3.2 Top 3 Companies Market Share Analysis
- 12.4. List of Potential Customers
- 13. Research Methodology
List of Figures
- Figure 1: Global Pyrolysis Oil Market Revenue Breakdown (Million, %) by Region 2025 & 2033
- Figure 2: Global Pyrolysis Oil Market Volume Breakdown (K Tons, %) by Region 2025 & 2033
- Figure 3: Asia Pacific Pyrolysis Oil Market Revenue (Million), by Raw Material 2025 & 2033
- Figure 4: Asia Pacific Pyrolysis Oil Market Volume (K Tons), by Raw Material 2025 & 2033
- Figure 5: Asia Pacific Pyrolysis Oil Market Revenue Share (%), by Raw Material 2025 & 2033
- Figure 6: Asia Pacific Pyrolysis Oil Market Volume Share (%), by Raw Material 2025 & 2033
- Figure 7: Asia Pacific Pyrolysis Oil Market Revenue (Million), by Application 2025 & 2033
- Figure 8: Asia Pacific Pyrolysis Oil Market Volume (K Tons), by Application 2025 & 2033
- Figure 9: Asia Pacific Pyrolysis Oil Market Revenue Share (%), by Application 2025 & 2033
- Figure 10: Asia Pacific Pyrolysis Oil Market Volume Share (%), by Application 2025 & 2033
- Figure 11: Asia Pacific Pyrolysis Oil Market Revenue (Million), by Country 2025 & 2033
- Figure 12: Asia Pacific Pyrolysis Oil Market Volume (K Tons), by Country 2025 & 2033
- Figure 13: Asia Pacific Pyrolysis Oil Market Revenue Share (%), by Country 2025 & 2033
- Figure 14: Asia Pacific Pyrolysis Oil Market Volume Share (%), by Country 2025 & 2033
- Figure 15: North America Pyrolysis Oil Market Revenue (Million), by Raw Material 2025 & 2033
- Figure 16: North America Pyrolysis Oil Market Volume (K Tons), by Raw Material 2025 & 2033
- Figure 17: North America Pyrolysis Oil Market Revenue Share (%), by Raw Material 2025 & 2033
- Figure 18: North America Pyrolysis Oil Market Volume Share (%), by Raw Material 2025 & 2033
- Figure 19: North America Pyrolysis Oil Market Revenue (Million), by Application 2025 & 2033
- Figure 20: North America Pyrolysis Oil Market Volume (K Tons), by Application 2025 & 2033
- Figure 21: North America Pyrolysis Oil Market Revenue Share (%), by Application 2025 & 2033
- Figure 22: North America Pyrolysis Oil Market Volume Share (%), by Application 2025 & 2033
- Figure 23: North America Pyrolysis Oil Market Revenue (Million), by Country 2025 & 2033
- Figure 24: North America Pyrolysis Oil Market Volume (K Tons), by Country 2025 & 2033
- Figure 25: North America Pyrolysis Oil Market Revenue Share (%), by Country 2025 & 2033
- Figure 26: North America Pyrolysis Oil Market Volume Share (%), by Country 2025 & 2033
- Figure 27: Europe Pyrolysis Oil Market Revenue (Million), by Raw Material 2025 & 2033
- Figure 28: Europe Pyrolysis Oil Market Volume (K Tons), by Raw Material 2025 & 2033
- Figure 29: Europe Pyrolysis Oil Market Revenue Share (%), by Raw Material 2025 & 2033
- Figure 30: Europe Pyrolysis Oil Market Volume Share (%), by Raw Material 2025 & 2033
- Figure 31: Europe Pyrolysis Oil Market Revenue (Million), by Application 2025 & 2033
- Figure 32: Europe Pyrolysis Oil Market Volume (K Tons), by Application 2025 & 2033
- Figure 33: Europe Pyrolysis Oil Market Revenue Share (%), by Application 2025 & 2033
- Figure 34: Europe Pyrolysis Oil Market Volume Share (%), by Application 2025 & 2033
- Figure 35: Europe Pyrolysis Oil Market Revenue (Million), by Country 2025 & 2033
- Figure 36: Europe Pyrolysis Oil Market Volume (K Tons), by Country 2025 & 2033
- Figure 37: Europe Pyrolysis Oil Market Revenue Share (%), by Country 2025 & 2033
- Figure 38: Europe Pyrolysis Oil Market Volume Share (%), by Country 2025 & 2033
- Figure 39: South America Pyrolysis Oil Market Revenue (Million), by Raw Material 2025 & 2033
- Figure 40: South America Pyrolysis Oil Market Volume (K Tons), by Raw Material 2025 & 2033
- Figure 41: South America Pyrolysis Oil Market Revenue Share (%), by Raw Material 2025 & 2033
- Figure 42: South America Pyrolysis Oil Market Volume Share (%), by Raw Material 2025 & 2033
- Figure 43: South America Pyrolysis Oil Market Revenue (Million), by Application 2025 & 2033
- Figure 44: South America Pyrolysis Oil Market Volume (K Tons), by Application 2025 & 2033
- Figure 45: South America Pyrolysis Oil Market Revenue Share (%), by Application 2025 & 2033
- Figure 46: South America Pyrolysis Oil Market Volume Share (%), by Application 2025 & 2033
- Figure 47: South America Pyrolysis Oil Market Revenue (Million), by Country 2025 & 2033
- Figure 48: South America Pyrolysis Oil Market Volume (K Tons), by Country 2025 & 2033
- Figure 49: South America Pyrolysis Oil Market Revenue Share (%), by Country 2025 & 2033
- Figure 50: South America Pyrolysis Oil Market Volume Share (%), by Country 2025 & 2033
- Figure 51: Middle East and Africa Pyrolysis Oil Market Revenue (Million), by Raw Material 2025 & 2033
- Figure 52: Middle East and Africa Pyrolysis Oil Market Volume (K Tons), by Raw Material 2025 & 2033
- Figure 53: Middle East and Africa Pyrolysis Oil Market Revenue Share (%), by Raw Material 2025 & 2033
- Figure 54: Middle East and Africa Pyrolysis Oil Market Volume Share (%), by Raw Material 2025 & 2033
- Figure 55: Middle East and Africa Pyrolysis Oil Market Revenue (Million), by Application 2025 & 2033
- Figure 56: Middle East and Africa Pyrolysis Oil Market Volume (K Tons), by Application 2025 & 2033
- Figure 57: Middle East and Africa Pyrolysis Oil Market Revenue Share (%), by Application 2025 & 2033
- Figure 58: Middle East and Africa Pyrolysis Oil Market Volume Share (%), by Application 2025 & 2033
- Figure 59: Middle East and Africa Pyrolysis Oil Market Revenue (Million), by Country 2025 & 2033
- Figure 60: Middle East and Africa Pyrolysis Oil Market Volume (K Tons), by Country 2025 & 2033
- Figure 61: Middle East and Africa Pyrolysis Oil Market Revenue Share (%), by Country 2025 & 2033
- Figure 62: Middle East and Africa Pyrolysis Oil Market Volume Share (%), by Country 2025 & 2033
List of Tables
- Table 1: Global Pyrolysis Oil Market Revenue Million Forecast, by Raw Material 2020 & 2033
- Table 2: Global Pyrolysis Oil Market Volume K Tons Forecast, by Raw Material 2020 & 2033
- Table 3: Global Pyrolysis Oil Market Revenue Million Forecast, by Application 2020 & 2033
- Table 4: Global Pyrolysis Oil Market Volume K Tons Forecast, by Application 2020 & 2033
- Table 5: Global Pyrolysis Oil Market Revenue Million Forecast, by Region 2020 & 2033
- Table 6: Global Pyrolysis Oil Market Volume K Tons Forecast, by Region 2020 & 2033
- Table 7: Global Pyrolysis Oil Market Revenue Million Forecast, by Raw Material 2020 & 2033
- Table 8: Global Pyrolysis Oil Market Volume K Tons Forecast, by Raw Material 2020 & 2033
- Table 9: Global Pyrolysis Oil Market Revenue Million Forecast, by Application 2020 & 2033
- Table 10: Global Pyrolysis Oil Market Volume K Tons Forecast, by Application 2020 & 2033
- Table 11: Global Pyrolysis Oil Market Revenue Million Forecast, by Country 2020 & 2033
- Table 12: Global Pyrolysis Oil Market Volume K Tons Forecast, by Country 2020 & 2033
- Table 13: China Pyrolysis Oil Market Revenue (Million) Forecast, by Application 2020 & 2033
- Table 14: China Pyrolysis Oil Market Volume (K Tons) Forecast, by Application 2020 & 2033
- Table 15: India Pyrolysis Oil Market Revenue (Million) Forecast, by Application 2020 & 2033
- Table 16: India Pyrolysis Oil Market Volume (K Tons) Forecast, by Application 2020 & 2033
- Table 17: Japan Pyrolysis Oil Market Revenue (Million) Forecast, by Application 2020 & 2033
- Table 18: Japan Pyrolysis Oil Market Volume (K Tons) Forecast, by Application 2020 & 2033
- Table 19: Thailand Pyrolysis Oil Market Revenue (Million) Forecast, by Application 2020 & 2033
- Table 20: Thailand Pyrolysis Oil Market Volume (K Tons) Forecast, by Application 2020 & 2033
- Table 21: Vietnam Pyrolysis Oil Market Revenue (Million) Forecast, by Application 2020 & 2033
- Table 22: Vietnam Pyrolysis Oil Market Volume (K Tons) Forecast, by Application 2020 & 2033
- Table 23: Malaysia Pyrolysis Oil Market Revenue (Million) Forecast, by Application 2020 & 2033
- Table 24: Malaysia Pyrolysis Oil Market Volume (K Tons) Forecast, by Application 2020 & 2033
- Table 25: Indonesia Pyrolysis Oil Market Revenue (Million) Forecast, by Application 2020 & 2033
- Table 26: Indonesia Pyrolysis Oil Market Volume (K Tons) Forecast, by Application 2020 & 2033
- Table 27: South Korea Pyrolysis Oil Market Revenue (Million) Forecast, by Application 2020 & 2033
- Table 28: South Korea Pyrolysis Oil Market Volume (K Tons) Forecast, by Application 2020 & 2033
- Table 29: Rest of Asia Pacific Pyrolysis Oil Market Revenue (Million) Forecast, by Application 2020 & 2033
- Table 30: Rest of Asia Pacific Pyrolysis Oil Market Volume (K Tons) Forecast, by Application 2020 & 2033
- Table 31: Global Pyrolysis Oil Market Revenue Million Forecast, by Raw Material 2020 & 2033
- Table 32: Global Pyrolysis Oil Market Volume K Tons Forecast, by Raw Material 2020 & 2033
- Table 33: Global Pyrolysis Oil Market Revenue Million Forecast, by Application 2020 & 2033
- Table 34: Global Pyrolysis Oil Market Volume K Tons Forecast, by Application 2020 & 2033
- Table 35: Global Pyrolysis Oil Market Revenue Million Forecast, by Country 2020 & 2033
- Table 36: Global Pyrolysis Oil Market Volume K Tons Forecast, by Country 2020 & 2033
- Table 37: United States Pyrolysis Oil Market Revenue (Million) Forecast, by Application 2020 & 2033
- Table 38: United States Pyrolysis Oil Market Volume (K Tons) Forecast, by Application 2020 & 2033
- Table 39: Canada Pyrolysis Oil Market Revenue (Million) Forecast, by Application 2020 & 2033
- Table 40: Canada Pyrolysis Oil Market Volume (K Tons) Forecast, by Application 2020 & 2033
- Table 41: Mexico Pyrolysis Oil Market Revenue (Million) Forecast, by Application 2020 & 2033
- Table 42: Mexico Pyrolysis Oil Market Volume (K Tons) Forecast, by Application 2020 & 2033
- Table 43: Global Pyrolysis Oil Market Revenue Million Forecast, by Raw Material 2020 & 2033
- Table 44: Global Pyrolysis Oil Market Volume K Tons Forecast, by Raw Material 2020 & 2033
- Table 45: Global Pyrolysis Oil Market Revenue Million Forecast, by Application 2020 & 2033
- Table 46: Global Pyrolysis Oil Market Volume K Tons Forecast, by Application 2020 & 2033
- Table 47: Global Pyrolysis Oil Market Revenue Million Forecast, by Country 2020 & 2033
- Table 48: Global Pyrolysis Oil Market Volume K Tons Forecast, by Country 2020 & 2033
- Table 49: Germany Pyrolysis Oil Market Revenue (Million) Forecast, by Application 2020 & 2033
- Table 50: Germany Pyrolysis Oil Market Volume (K Tons) Forecast, by Application 2020 & 2033
- Table 51: France Pyrolysis Oil Market Revenue (Million) Forecast, by Application 2020 & 2033
- Table 52: France Pyrolysis Oil Market Volume (K Tons) Forecast, by Application 2020 & 2033
- Table 53: United Kingdom Pyrolysis Oil Market Revenue (Million) Forecast, by Application 2020 & 2033
- Table 54: United Kingdom Pyrolysis Oil Market Volume (K Tons) Forecast, by Application 2020 & 2033
- Table 55: Italy Pyrolysis Oil Market Revenue (Million) Forecast, by Application 2020 & 2033
- Table 56: Italy Pyrolysis Oil Market Volume (K Tons) Forecast, by Application 2020 & 2033
- Table 57: NORDIC Pyrolysis Oil Market Revenue (Million) Forecast, by Application 2020 & 2033
- Table 58: NORDIC Pyrolysis Oil Market Volume (K Tons) Forecast, by Application 2020 & 2033
- Table 59: Spain Pyrolysis Oil Market Revenue (Million) Forecast, by Application 2020 & 2033
- Table 60: Spain Pyrolysis Oil Market Volume (K Tons) Forecast, by Application 2020 & 2033
- Table 61: Turkey Pyrolysis Oil Market Revenue (Million) Forecast, by Application 2020 & 2033
- Table 62: Turkey Pyrolysis Oil Market Volume (K Tons) Forecast, by Application 2020 & 2033
- Table 63: Russia Pyrolysis Oil Market Revenue (Million) Forecast, by Application 2020 & 2033
- Table 64: Russia Pyrolysis Oil Market Volume (K Tons) Forecast, by Application 2020 & 2033
- Table 65: Rest of Europe Pyrolysis Oil Market Revenue (Million) Forecast, by Application 2020 & 2033
- Table 66: Rest of Europe Pyrolysis Oil Market Volume (K Tons) Forecast, by Application 2020 & 2033
- Table 67: Global Pyrolysis Oil Market Revenue Million Forecast, by Raw Material 2020 & 2033
- Table 68: Global Pyrolysis Oil Market Volume K Tons Forecast, by Raw Material 2020 & 2033
- Table 69: Global Pyrolysis Oil Market Revenue Million Forecast, by Application 2020 & 2033
- Table 70: Global Pyrolysis Oil Market Volume K Tons Forecast, by Application 2020 & 2033
- Table 71: Global Pyrolysis Oil Market Revenue Million Forecast, by Country 2020 & 2033
- Table 72: Global Pyrolysis Oil Market Volume K Tons Forecast, by Country 2020 & 2033
- Table 73: Brazil Pyrolysis Oil Market Revenue (Million) Forecast, by Application 2020 & 2033
- Table 74: Brazil Pyrolysis Oil Market Volume (K Tons) Forecast, by Application 2020 & 2033
- Table 75: Argentina Pyrolysis Oil Market Revenue (Million) Forecast, by Application 2020 & 2033
- Table 76: Argentina Pyrolysis Oil Market Volume (K Tons) Forecast, by Application 2020 & 2033
- Table 77: Colombia Pyrolysis Oil Market Revenue (Million) Forecast, by Application 2020 & 2033
- Table 78: Colombia Pyrolysis Oil Market Volume (K Tons) Forecast, by Application 2020 & 2033
- Table 79: Rest of South America Pyrolysis Oil Market Revenue (Million) Forecast, by Application 2020 & 2033
- Table 80: Rest of South America Pyrolysis Oil Market Volume (K Tons) Forecast, by Application 2020 & 2033
- Table 81: Global Pyrolysis Oil Market Revenue Million Forecast, by Raw Material 2020 & 2033
- Table 82: Global Pyrolysis Oil Market Volume K Tons Forecast, by Raw Material 2020 & 2033
- Table 83: Global Pyrolysis Oil Market Revenue Million Forecast, by Application 2020 & 2033
- Table 84: Global Pyrolysis Oil Market Volume K Tons Forecast, by Application 2020 & 2033
- Table 85: Global Pyrolysis Oil Market Revenue Million Forecast, by Country 2020 & 2033
- Table 86: Global Pyrolysis Oil Market Volume K Tons Forecast, by Country 2020 & 2033
- Table 87: Saudi Arabia Pyrolysis Oil Market Revenue (Million) Forecast, by Application 2020 & 2033
- Table 88: Saudi Arabia Pyrolysis Oil Market Volume (K Tons) Forecast, by Application 2020 & 2033
- Table 89: South Africa Pyrolysis Oil Market Revenue (Million) Forecast, by Application 2020 & 2033
- Table 90: South Africa Pyrolysis Oil Market Volume (K Tons) Forecast, by Application 2020 & 2033
- Table 91: Morocco Pyrolysis Oil Market Revenue (Million) Forecast, by Application 2020 & 2033
- Table 92: Morocco Pyrolysis Oil Market Volume (K Tons) Forecast, by Application 2020 & 2033
- Table 93: Qatar Pyrolysis Oil Market Revenue (Million) Forecast, by Application 2020 & 2033
- Table 94: Qatar Pyrolysis Oil Market Volume (K Tons) Forecast, by Application 2020 & 2033
- Table 95: Egypt Pyrolysis Oil Market Revenue (Million) Forecast, by Application 2020 & 2033
- Table 96: Egypt Pyrolysis Oil Market Volume (K Tons) Forecast, by Application 2020 & 2033
- Table 97: United Arab Emirates Pyrolysis Oil Market Revenue (Million) Forecast, by Application 2020 & 2033
- Table 98: United Arab Emirates Pyrolysis Oil Market Volume (K Tons) Forecast, by Application 2020 & 2033
- Table 99: Nigeria Pyrolysis Oil Market Revenue (Million) Forecast, by Application 2020 & 2033
- Table 100: Nigeria Pyrolysis Oil Market Volume (K Tons) Forecast, by Application 2020 & 2033
- Table 101: Rest of Middle East and Africa Pyrolysis Oil Market Revenue (Million) Forecast, by Application 2020 & 2033
- Table 102: Rest of Middle East and Africa Pyrolysis Oil Market Volume (K Tons) Forecast, by Application 2020 & 2033
Frequently Asked Questions
1. What is the projected Compound Annual Growth Rate (CAGR) of the Pyrolysis Oil Market?
The projected CAGR is approximately 19.71%.
2. Which companies are prominent players in the Pyrolysis Oil Market?
Key companies in the market include Green Fuel Nordic Oy, Nexus Circular, Twence, Trident Fuels Pty Ltd, PLASTIC ENERGY, Ensyn, Bioenergy Ae Cote-Nord, Alterra Energy LLC, New Energy Kft, Mk Aromatics Limited, New Hope Energy, Quantafuel ASA, Plastic Advanced Recycling Corp, Setra Group.
3. What are the main segments of the Pyrolysis Oil Market?
The market segments include Raw Material, Application.
4. Can you provide details about the market size?
The market size is estimated to be USD 0.52 Million as of 2022.
5. What are some drivers contributing to market growth?
Rising Demand For Environment-friendly Fuel and Raw Material Alternatives; Increasing Demand From Heat and Power Generation Sectors.
6. What are the notable trends driving market growth?
Increasing Demand for Fuel Application.
7. Are there any restraints impacting market growth?
Problems Associated With Storage. Transportation. and Application of Pyrolysis Oil.
8. Can you provide examples of recent developments in the market?
June 2023: Audi Hungaria announced its cooperation with New Energy Kft. to deal with tire waste generated at Audi’s Gyor plant. The process for recycling tire waste was pyrolysis, in which tire waste is chemically converted into oil that petrochemical companies can use to produce new plastics, while the resulting recovered carbon black is utilized in tire production.
9. What pricing options are available for accessing the report?
Pricing options include single-user, multi-user, and enterprise licenses priced at USD 4750, USD 5250, and USD 8750 respectively.
10. Is the market size provided in terms of value or volume?
The market size is provided in terms of value, measured in Million and volume, measured in K Tons.
11. Are there any specific market keywords associated with the report?
Yes, the market keyword associated with the report is "Pyrolysis Oil Market," which aids in identifying and referencing the specific market segment covered.
12. How do I determine which pricing option suits my needs best?
The pricing options vary based on user requirements and access needs. Individual users may opt for single-user licenses, while businesses requiring broader access may choose multi-user or enterprise licenses for cost-effective access to the report.
13. Are there any additional resources or data provided in the Pyrolysis Oil Market report?
While the report offers comprehensive insights, it's advisable to review the specific contents or supplementary materials provided to ascertain if additional resources or data are available.
14. How can I stay updated on further developments or reports in the Pyrolysis Oil Market?
To stay informed about further developments, trends, and reports in the Pyrolysis Oil Market, consider subscribing to industry newsletters, following relevant companies and organizations, or regularly checking reputable industry news sources and publications.
Methodology
Step 1 - Identification of Relevant Samples Size from Population Database


Step 2 - Approaches for Defining Global Market Size (Value, Volume* & Price*)

Note*: In applicable scenarios
Step 3 - Data Sources
Primary Research
- Web Analytics
- Survey Reports
- Research Institute
- Latest Research Reports
- Opinion Leaders
Secondary Research
- Annual Reports
- White Paper
- Latest Press Release
- Industry Association
- Paid Database
- Investor Presentations

Step 4 - Data Triangulation
Involves using different sources of information in order to increase the validity of a study
These sources are likely to be stakeholders in a program - participants, other researchers, program staff, other community members, and so on.
Then we put all data in single framework & apply various statistical tools to find out the dynamic on the market.
During the analysis stage, feedback from the stakeholder groups would be compared to determine areas of agreement as well as areas of divergence