
Key Insights
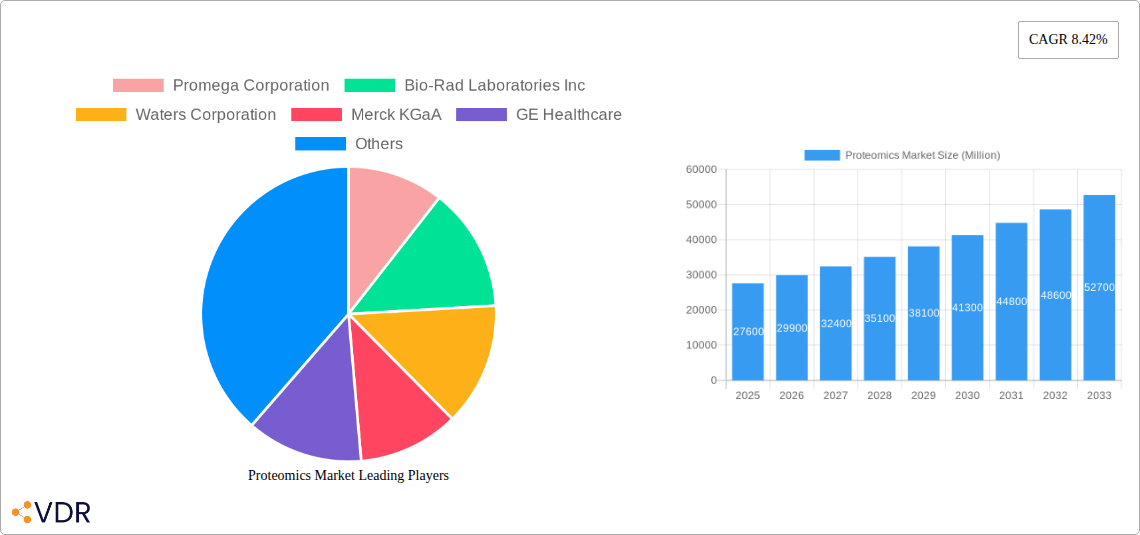
The global proteomics market, valued at $27.60 billion in 2025, is poised for robust growth, exhibiting a compound annual growth rate (CAGR) of 8.42% from 2025 to 2033. This expansion is driven by several key factors. Firstly, the increasing prevalence of chronic diseases like cancer and diabetes fuels demand for advanced diagnostic tools and personalized medicine approaches, where proteomics plays a vital role in identifying disease biomarkers and developing targeted therapies. Secondly, technological advancements in mass spectrometry, chromatography, and bioinformatics are continuously improving the sensitivity, speed, and affordability of proteomic analyses, making them accessible to a wider range of researchers and clinicians. Furthermore, the growing adoption of proteomics in drug discovery and development processes, particularly in identifying potential drug targets and assessing drug efficacy, contributes significantly to market growth. Government funding initiatives supporting proteomics research and the rising collaborations between academia and industry further propel this market's trajectory.
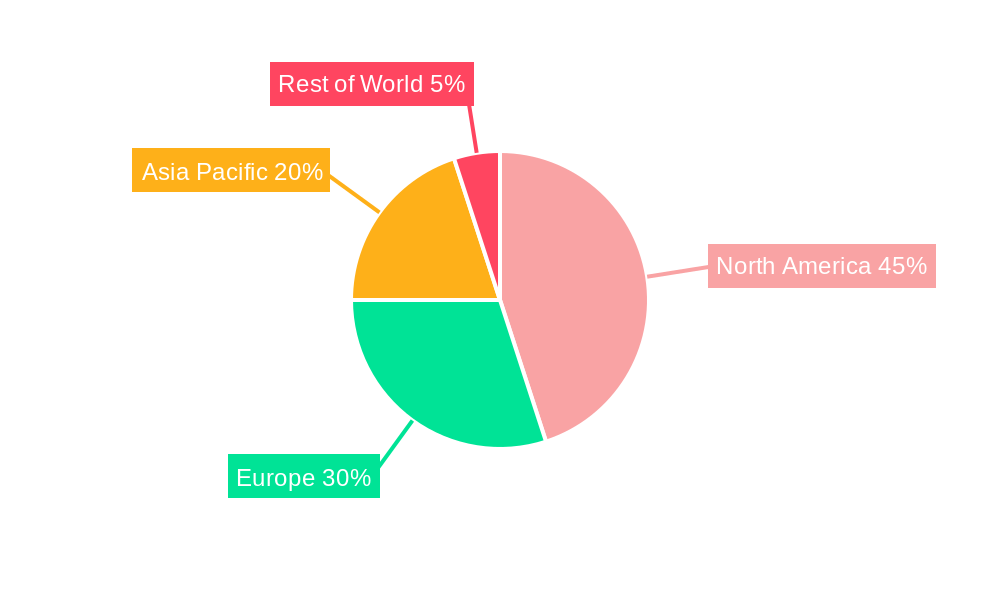
The market segmentation reveals significant opportunities across various product and service categories. Instrumentation technologies, including mass spectrometers and chromatography systems, constitute a substantial portion of the market, followed by reagents, software, and services crucial for data analysis and interpretation. Application-wise, clinical diagnostics holds a leading share, benefiting from the growing demand for early disease detection and personalized treatment strategies. Drug discovery and development represent a rapidly expanding segment, driven by the increasing need for efficient and effective drug development pipelines. Geographically, North America currently dominates the market due to advanced healthcare infrastructure, substantial research funding, and a strong presence of key players. However, Asia Pacific is expected to witness the fastest growth rate in the forecast period, fueled by rising healthcare expenditure, increasing awareness of proteomics applications, and a growing pool of skilled researchers. Competitive rivalry is intense, with prominent players like Thermo Fisher Scientific, Bio-Rad Laboratories, and others continuously investing in research and development to maintain market leadership.
Proteomics Market: A Comprehensive Market Report (2019-2033)
This comprehensive report provides an in-depth analysis of the global Proteomics market, offering invaluable insights for industry professionals, investors, and strategic decision-makers. The study covers the period from 2019 to 2033, with 2025 serving as the base year and the forecast period spanning from 2025 to 2033. The report meticulously examines market dynamics, growth trends, regional dominance, product landscapes, and key players, providing a 360° view of this rapidly evolving sector. The total market size in 2025 is estimated at $xx Million, projected to reach $xx Million by 2033, exhibiting a CAGR of xx% during the forecast period.
Proteomics Market Market Dynamics & Structure
The global proteomics market is characterized by moderate concentration, with several major players holding significant market share. Technological innovation, particularly in mass spectrometry and bioinformatics, is a primary growth driver. Stringent regulatory frameworks, particularly concerning clinical diagnostics applications, influence market dynamics. Competitive pressures from substitute technologies and the emergence of new analytical techniques further shape the market landscape. The market exhibits diverse end-user demographics, including pharmaceutical companies, research institutions, and clinical diagnostic laboratories. M&A activity has been moderately active in recent years, with approximately xx deals recorded between 2019 and 2024, primarily focused on strengthening technological capabilities and expanding market reach.
- Market Concentration: Moderately concentrated, with top 5 players holding approximately xx% market share in 2025.
- Technological Innovation: Mass spectrometry advancements and improved bioinformatics tools are key drivers.
- Regulatory Landscape: Stringent regulations in clinical diagnostics influence market growth.
- Competitive Substitutes: Emerging technologies like genomics pose competitive pressure.
- M&A Activity: Approximately xx deals between 2019-2024, focused on expansion and technology acquisition.
- Innovation Barriers: High R&D costs and complex data analysis pose challenges.
Proteomics Market Growth Trends & Insights
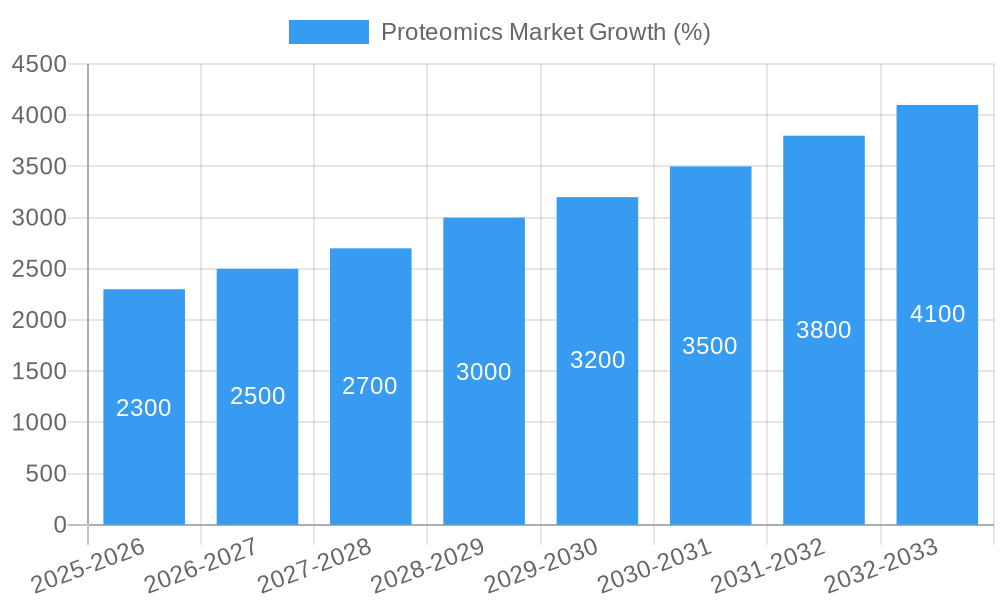
The proteomics market has experienced steady growth over the past few years, driven by increasing demand for personalized medicine, advancements in proteomic technologies, and rising investments in research and development. The market witnessed a significant expansion during the historical period (2019-2024), registering a CAGR of xx%. This growth trajectory is expected to continue during the forecast period (2025-2033), fueled by the increasing adoption of proteomics in various applications such as drug discovery and clinical diagnostics. Technological disruptions, such as the development of advanced mass spectrometry techniques and sophisticated bioinformatics tools, are accelerating market growth. A shift in consumer behavior towards personalized and precision healthcare is further bolstering market expansion. Market penetration in emerging economies is also expected to contribute significantly to future growth.
Dominant Regions, Countries, or Segments in Proteomics Market
North America currently dominates the proteomics market, driven by substantial investments in research and development, a strong presence of major players, and well-established healthcare infrastructure. Europe follows as a significant market, fueled by growing government support for life sciences research and a substantial clinical diagnostics sector. Within the segments, the Instrumentation Technology segment holds the largest market share, followed by Reagents, and Software & Services. The Clinical Diagnostics application segment is experiencing the fastest growth rate, owing to the increasing prevalence of chronic diseases and the growing need for early and accurate diagnoses.
- North America: Strong R&D investments, presence of major players, and well-established healthcare infrastructure.
- Europe: Growing government support for life sciences research and a robust clinical diagnostics sector.
- Asia Pacific: Rapidly growing market driven by increasing healthcare expenditure and a rising prevalence of chronic diseases.
- Instrumentation Technology: Largest market segment due to high demand for advanced mass spectrometers and other instruments.
- Clinical Diagnostics: Fastest-growing application segment due to increasing need for precise and early diagnosis.
Proteomics Market Product Landscape
The proteomics market offers a diverse range of products and services, including advanced mass spectrometers, high-performance liquid chromatography (HPLC) systems, various reagents and kits for sample preparation and analysis, and sophisticated bioinformatics software for data analysis and interpretation. These products exhibit enhanced sensitivity, higher throughput, and improved data analysis capabilities compared to earlier generations, facilitating faster and more accurate results. Unique selling propositions often focus on ease of use, data quality, and integration with other analytical platforms. Technological advancements are continuously shaping the product landscape, leading to the development of miniaturized systems, automated workflows, and cloud-based data analysis platforms.
Key Drivers, Barriers & Challenges in Proteomics Market
Key Drivers: The increasing prevalence of chronic diseases, the growing demand for personalized medicine, advancements in mass spectrometry and bioinformatics technologies, and substantial investments in research and development are driving the proteomics market’s growth. Government funding for proteomics research and the growing adoption of proteomics in drug discovery and clinical diagnostics further fuel market expansion.
Key Challenges & Restraints: High costs associated with instrumentation and analysis, the complexity of data analysis, and the need for skilled personnel pose significant challenges. Regulatory hurdles and potential supply chain disruptions also impact market growth. The highly competitive landscape with established players and emerging competitors necessitates continuous innovation and differentiation.
Emerging Opportunities in Proteomics Market
Untapped markets in emerging economies represent significant growth opportunities. The rising application of proteomics in areas such as biomarker discovery, disease diagnostics, and personalized therapies creates numerous opportunities. The development of novel technologies, such as advanced imaging techniques and microfluidic devices, presents avenues for further market expansion. Evolving consumer preferences towards personalized healthcare solutions create a significant demand for advanced proteomics-based diagnostics and therapeutics.
Growth Accelerators in the Proteomics Market Industry
Technological breakthroughs in mass spectrometry, bioinformatics, and data analysis tools are accelerating market growth. Strategic partnerships between technology providers, research institutions, and pharmaceutical companies promote innovation and market expansion. The increasing adoption of proteomics in various applications, including clinical diagnostics and drug development, is further fueling market growth. Government initiatives and funding programs supporting proteomics research also contribute to market expansion.
Key Players Shaping the Proteomics Market Market
- Promega Corporation
- Bio-Rad Laboratories Inc
- Waters Corporation
- Merck KGaA
- GE Healthcare
- Thermo Fisher Scientific Inc
- Danaher Corporation
- Agilent Technologies Inc
- Bruker Corporation
Notable Milestones in Proteomics Market Sector
- 2020, Q4: Thermo Fisher Scientific launches a new mass spectrometer with enhanced sensitivity.
- 2021, Q2: Bio-Rad Laboratories announces a partnership to develop novel proteomics assays.
- 2022, Q1: Merck KGaA acquires a smaller proteomics company specializing in biomarker discovery.
- 2023, Q3: Waters Corporation introduces a new software platform for advanced data analysis.
In-Depth Proteomics Market Market Outlook
The proteomics market is poised for robust growth in the coming years, driven by continued technological advancements, increasing demand for personalized medicine, and growing investments in research and development. Strategic partnerships, collaborations, and acquisitions will shape the competitive landscape, driving innovation and market expansion. The market's future potential lies in the development of novel applications in disease diagnosis, drug discovery, and personalized healthcare, offering significant opportunities for growth and innovation in the coming decade.
Proteomics Market Segmentation
-
1. Product & Services
-
1.1. Instrumentation Technology
- 1.1.1. Spectroscopy
- 1.1.2. Chromatography
- 1.1.3. Electrophoresis
- 1.1.4. Protein Microarrays
- 1.1.5. X-Ray Crystallography
- 1.1.6. Other Instrumentation Technologies
- 1.2. Reagents
- 1.3. Software and Services
-
1.1. Instrumentation Technology
-
2. Application
- 2.1. Clinical Diagnostics
- 2.2. Drug Discovery
- 2.3. Other Applications
Proteomics Market Segmentation By Geography
-
1. North America
- 1.1. United States
- 1.2. Canada
- 1.3. Mexico
-
2. Europe
- 2.1. Germany
- 2.2. United Kingdom
- 2.3. France
- 2.4. Italy
- 2.5. Spain
- 2.6. Rest of Europe
-
3. Asia Pacific
- 3.1. China
- 3.2. Japan
- 3.3. India
- 3.4. Australia
- 3.5. South Korea
- 3.6. Rest of Asia Pacific
- 4. Middle East
-
5. GCC
- 5.1. South Africa
- 5.2. Rest of Middle East
-
6. South America
- 6.1. Brazil
- 6.2. Argentina
- 6.3. Rest of South America
Proteomics Market REPORT HIGHLIGHTS
| Aspects | Details |
|---|---|
| Study Period | 2019-2033 |
| Base Year | 2024 |
| Estimated Year | 2025 |
| Forecast Period | 2025-2033 |
| Historical Period | 2019-2024 |
| Growth Rate | CAGR of 8.42% from 2019-2033 |
| Segmentation |
|
Table of Contents
- 1. Introduction
- 1.1. Research Scope
- 1.2. Market Segmentation
- 1.3. Research Methodology
- 1.4. Definitions and Assumptions
- 2. Executive Summary
- 2.1. Introduction
- 3. Market Dynamics
- 3.1. Introduction
- 3.2. Market Drivers
- 3.2.1. Rising Demand for Personalized Medicine; Increasing R&D Expenditure and Government Funding for Proteomics; Technological Advancements
- 3.3. Market Restrains
- 3.3.1. High Cost of Instruments
- 3.4. Market Trends
- 3.4.1. Drug Discovery is Expected to Witness Healthy CAGR in Future
- 4. Market Factor Analysis
- 4.1. Porters Five Forces
- 4.2. Supply/Value Chain
- 4.3. PESTEL analysis
- 4.4. Market Entropy
- 4.5. Patent/Trademark Analysis
- 5. Global Proteomics Market Analysis, Insights and Forecast, 2019-2031
- 5.1. Market Analysis, Insights and Forecast - by Product & Services
- 5.1.1. Instrumentation Technology
- 5.1.1.1. Spectroscopy
- 5.1.1.2. Chromatography
- 5.1.1.3. Electrophoresis
- 5.1.1.4. Protein Microarrays
- 5.1.1.5. X-Ray Crystallography
- 5.1.1.6. Other Instrumentation Technologies
- 5.1.2. Reagents
- 5.1.3. Software and Services
- 5.1.1. Instrumentation Technology
- 5.2. Market Analysis, Insights and Forecast - by Application
- 5.2.1. Clinical Diagnostics
- 5.2.2. Drug Discovery
- 5.2.3. Other Applications
- 5.3. Market Analysis, Insights and Forecast - by Region
- 5.3.1. North America
- 5.3.2. Europe
- 5.3.3. Asia Pacific
- 5.3.4. Middle East
- 5.3.5. GCC
- 5.3.6. South America
- 5.1. Market Analysis, Insights and Forecast - by Product & Services
- 6. North America Proteomics Market Analysis, Insights and Forecast, 2019-2031
- 6.1. Market Analysis, Insights and Forecast - by Product & Services
- 6.1.1. Instrumentation Technology
- 6.1.1.1. Spectroscopy
- 6.1.1.2. Chromatography
- 6.1.1.3. Electrophoresis
- 6.1.1.4. Protein Microarrays
- 6.1.1.5. X-Ray Crystallography
- 6.1.1.6. Other Instrumentation Technologies
- 6.1.2. Reagents
- 6.1.3. Software and Services
- 6.1.1. Instrumentation Technology
- 6.2. Market Analysis, Insights and Forecast - by Application
- 6.2.1. Clinical Diagnostics
- 6.2.2. Drug Discovery
- 6.2.3. Other Applications
- 6.1. Market Analysis, Insights and Forecast - by Product & Services
- 7. Europe Proteomics Market Analysis, Insights and Forecast, 2019-2031
- 7.1. Market Analysis, Insights and Forecast - by Product & Services
- 7.1.1. Instrumentation Technology
- 7.1.1.1. Spectroscopy
- 7.1.1.2. Chromatography
- 7.1.1.3. Electrophoresis
- 7.1.1.4. Protein Microarrays
- 7.1.1.5. X-Ray Crystallography
- 7.1.1.6. Other Instrumentation Technologies
- 7.1.2. Reagents
- 7.1.3. Software and Services
- 7.1.1. Instrumentation Technology
- 7.2. Market Analysis, Insights and Forecast - by Application
- 7.2.1. Clinical Diagnostics
- 7.2.2. Drug Discovery
- 7.2.3. Other Applications
- 7.1. Market Analysis, Insights and Forecast - by Product & Services
- 8. Asia Pacific Proteomics Market Analysis, Insights and Forecast, 2019-2031
- 8.1. Market Analysis, Insights and Forecast - by Product & Services
- 8.1.1. Instrumentation Technology
- 8.1.1.1. Spectroscopy
- 8.1.1.2. Chromatography
- 8.1.1.3. Electrophoresis
- 8.1.1.4. Protein Microarrays
- 8.1.1.5. X-Ray Crystallography
- 8.1.1.6. Other Instrumentation Technologies
- 8.1.2. Reagents
- 8.1.3. Software and Services
- 8.1.1. Instrumentation Technology
- 8.2. Market Analysis, Insights and Forecast - by Application
- 8.2.1. Clinical Diagnostics
- 8.2.2. Drug Discovery
- 8.2.3. Other Applications
- 8.1. Market Analysis, Insights and Forecast - by Product & Services
- 9. Middle East Proteomics Market Analysis, Insights and Forecast, 2019-2031
- 9.1. Market Analysis, Insights and Forecast - by Product & Services
- 9.1.1. Instrumentation Technology
- 9.1.1.1. Spectroscopy
- 9.1.1.2. Chromatography
- 9.1.1.3. Electrophoresis
- 9.1.1.4. Protein Microarrays
- 9.1.1.5. X-Ray Crystallography
- 9.1.1.6. Other Instrumentation Technologies
- 9.1.2. Reagents
- 9.1.3. Software and Services
- 9.1.1. Instrumentation Technology
- 9.2. Market Analysis, Insights and Forecast - by Application
- 9.2.1. Clinical Diagnostics
- 9.2.2. Drug Discovery
- 9.2.3. Other Applications
- 9.1. Market Analysis, Insights and Forecast - by Product & Services
- 10. GCC Proteomics Market Analysis, Insights and Forecast, 2019-2031
- 10.1. Market Analysis, Insights and Forecast - by Product & Services
- 10.1.1. Instrumentation Technology
- 10.1.1.1. Spectroscopy
- 10.1.1.2. Chromatography
- 10.1.1.3. Electrophoresis
- 10.1.1.4. Protein Microarrays
- 10.1.1.5. X-Ray Crystallography
- 10.1.1.6. Other Instrumentation Technologies
- 10.1.2. Reagents
- 10.1.3. Software and Services
- 10.1.1. Instrumentation Technology
- 10.2. Market Analysis, Insights and Forecast - by Application
- 10.2.1. Clinical Diagnostics
- 10.2.2. Drug Discovery
- 10.2.3. Other Applications
- 10.1. Market Analysis, Insights and Forecast - by Product & Services
- 11. South America Proteomics Market Analysis, Insights and Forecast, 2019-2031
- 11.1. Market Analysis, Insights and Forecast - by Product & Services
- 11.1.1. Instrumentation Technology
- 11.1.1.1. Spectroscopy
- 11.1.1.2. Chromatography
- 11.1.1.3. Electrophoresis
- 11.1.1.4. Protein Microarrays
- 11.1.1.5. X-Ray Crystallography
- 11.1.1.6. Other Instrumentation Technologies
- 11.1.2. Reagents
- 11.1.3. Software and Services
- 11.1.1. Instrumentation Technology
- 11.2. Market Analysis, Insights and Forecast - by Application
- 11.2.1. Clinical Diagnostics
- 11.2.2. Drug Discovery
- 11.2.3. Other Applications
- 11.1. Market Analysis, Insights and Forecast - by Product & Services
- 12. North America Proteomics Market Analysis, Insights and Forecast, 2019-2031
- 12.1. Market Analysis, Insights and Forecast - By Country/Sub-region
- 12.1.1 United States
- 12.1.2 Canada
- 12.1.3 Mexico
- 13. Europe Proteomics Market Analysis, Insights and Forecast, 2019-2031
- 13.1. Market Analysis, Insights and Forecast - By Country/Sub-region
- 13.1.1 Germany
- 13.1.2 United Kingdom
- 13.1.3 France
- 13.1.4 Italy
- 13.1.5 Spain
- 13.1.6 Rest of Europe
- 14. Asia Pacific Proteomics Market Analysis, Insights and Forecast, 2019-2031
- 14.1. Market Analysis, Insights and Forecast - By Country/Sub-region
- 14.1.1 China
- 14.1.2 Japan
- 14.1.3 India
- 14.1.4 Australia
- 14.1.5 South Korea
- 14.1.6 Rest of Asia Pacific
- 15. Middle East Proteomics Market Analysis, Insights and Forecast, 2019-2031
- 15.1. Market Analysis, Insights and Forecast - By Country/Sub-region
- 15.1.1.
- 16. GCC Proteomics Market Analysis, Insights and Forecast, 2019-2031
- 16.1. Market Analysis, Insights and Forecast - By Country/Sub-region
- 16.1.1 South Africa
- 16.1.2 Rest of Middle East
- 17. South America Proteomics Market Analysis, Insights and Forecast, 2019-2031
- 17.1. Market Analysis, Insights and Forecast - By Country/Sub-region
- 17.1.1 Brazil
- 17.1.2 Argentina
- 17.1.3 Rest of South America
- 18. Competitive Analysis
- 18.1. Global Market Share Analysis 2024
- 18.2. Company Profiles
- 18.2.1 Promega Corporation
- 18.2.1.1. Overview
- 18.2.1.2. Products
- 18.2.1.3. SWOT Analysis
- 18.2.1.4. Recent Developments
- 18.2.1.5. Financials (Based on Availability)
- 18.2.2 Bio-Rad Laboratories Inc
- 18.2.2.1. Overview
- 18.2.2.2. Products
- 18.2.2.3. SWOT Analysis
- 18.2.2.4. Recent Developments
- 18.2.2.5. Financials (Based on Availability)
- 18.2.3 Waters Corporation
- 18.2.3.1. Overview
- 18.2.3.2. Products
- 18.2.3.3. SWOT Analysis
- 18.2.3.4. Recent Developments
- 18.2.3.5. Financials (Based on Availability)
- 18.2.4 Merck KGaA
- 18.2.4.1. Overview
- 18.2.4.2. Products
- 18.2.4.3. SWOT Analysis
- 18.2.4.4. Recent Developments
- 18.2.4.5. Financials (Based on Availability)
- 18.2.5 GE Healthcare
- 18.2.5.1. Overview
- 18.2.5.2. Products
- 18.2.5.3. SWOT Analysis
- 18.2.5.4. Recent Developments
- 18.2.5.5. Financials (Based on Availability)
- 18.2.6 Thermo Fisher Scientific Inc
- 18.2.6.1. Overview
- 18.2.6.2. Products
- 18.2.6.3. SWOT Analysis
- 18.2.6.4. Recent Developments
- 18.2.6.5. Financials (Based on Availability)
- 18.2.7 Danaher Corporation
- 18.2.7.1. Overview
- 18.2.7.2. Products
- 18.2.7.3. SWOT Analysis
- 18.2.7.4. Recent Developments
- 18.2.7.5. Financials (Based on Availability)
- 18.2.8 Agilent Technologies Inc
- 18.2.8.1. Overview
- 18.2.8.2. Products
- 18.2.8.3. SWOT Analysis
- 18.2.8.4. Recent Developments
- 18.2.8.5. Financials (Based on Availability)
- 18.2.9 Bruker Corporation
- 18.2.9.1. Overview
- 18.2.9.2. Products
- 18.2.9.3. SWOT Analysis
- 18.2.9.4. Recent Developments
- 18.2.9.5. Financials (Based on Availability)
- 18.2.1 Promega Corporation
List of Figures
- Figure 1: Global Proteomics Market Revenue Breakdown (Million, %) by Region 2024 & 2032
- Figure 2: Global Proteomics Market Volume Breakdown (K Unit, %) by Region 2024 & 2032
- Figure 3: North America Proteomics Market Revenue (Million), by Country 2024 & 2032
- Figure 4: North America Proteomics Market Volume (K Unit), by Country 2024 & 2032
- Figure 5: North America Proteomics Market Revenue Share (%), by Country 2024 & 2032
- Figure 6: North America Proteomics Market Volume Share (%), by Country 2024 & 2032
- Figure 7: Europe Proteomics Market Revenue (Million), by Country 2024 & 2032
- Figure 8: Europe Proteomics Market Volume (K Unit), by Country 2024 & 2032
- Figure 9: Europe Proteomics Market Revenue Share (%), by Country 2024 & 2032
- Figure 10: Europe Proteomics Market Volume Share (%), by Country 2024 & 2032
- Figure 11: Asia Pacific Proteomics Market Revenue (Million), by Country 2024 & 2032
- Figure 12: Asia Pacific Proteomics Market Volume (K Unit), by Country 2024 & 2032
- Figure 13: Asia Pacific Proteomics Market Revenue Share (%), by Country 2024 & 2032
- Figure 14: Asia Pacific Proteomics Market Volume Share (%), by Country 2024 & 2032
- Figure 15: Middle East Proteomics Market Revenue (Million), by Country 2024 & 2032
- Figure 16: Middle East Proteomics Market Volume (K Unit), by Country 2024 & 2032
- Figure 17: Middle East Proteomics Market Revenue Share (%), by Country 2024 & 2032
- Figure 18: Middle East Proteomics Market Volume Share (%), by Country 2024 & 2032
- Figure 19: GCC Proteomics Market Revenue (Million), by Country 2024 & 2032
- Figure 20: GCC Proteomics Market Volume (K Unit), by Country 2024 & 2032
- Figure 21: GCC Proteomics Market Revenue Share (%), by Country 2024 & 2032
- Figure 22: GCC Proteomics Market Volume Share (%), by Country 2024 & 2032
- Figure 23: South America Proteomics Market Revenue (Million), by Country 2024 & 2032
- Figure 24: South America Proteomics Market Volume (K Unit), by Country 2024 & 2032
- Figure 25: South America Proteomics Market Revenue Share (%), by Country 2024 & 2032
- Figure 26: South America Proteomics Market Volume Share (%), by Country 2024 & 2032
- Figure 27: North America Proteomics Market Revenue (Million), by Product & Services 2024 & 2032
- Figure 28: North America Proteomics Market Volume (K Unit), by Product & Services 2024 & 2032
- Figure 29: North America Proteomics Market Revenue Share (%), by Product & Services 2024 & 2032
- Figure 30: North America Proteomics Market Volume Share (%), by Product & Services 2024 & 2032
- Figure 31: North America Proteomics Market Revenue (Million), by Application 2024 & 2032
- Figure 32: North America Proteomics Market Volume (K Unit), by Application 2024 & 2032
- Figure 33: North America Proteomics Market Revenue Share (%), by Application 2024 & 2032
- Figure 34: North America Proteomics Market Volume Share (%), by Application 2024 & 2032
- Figure 35: North America Proteomics Market Revenue (Million), by Country 2024 & 2032
- Figure 36: North America Proteomics Market Volume (K Unit), by Country 2024 & 2032
- Figure 37: North America Proteomics Market Revenue Share (%), by Country 2024 & 2032
- Figure 38: North America Proteomics Market Volume Share (%), by Country 2024 & 2032
- Figure 39: Europe Proteomics Market Revenue (Million), by Product & Services 2024 & 2032
- Figure 40: Europe Proteomics Market Volume (K Unit), by Product & Services 2024 & 2032
- Figure 41: Europe Proteomics Market Revenue Share (%), by Product & Services 2024 & 2032
- Figure 42: Europe Proteomics Market Volume Share (%), by Product & Services 2024 & 2032
- Figure 43: Europe Proteomics Market Revenue (Million), by Application 2024 & 2032
- Figure 44: Europe Proteomics Market Volume (K Unit), by Application 2024 & 2032
- Figure 45: Europe Proteomics Market Revenue Share (%), by Application 2024 & 2032
- Figure 46: Europe Proteomics Market Volume Share (%), by Application 2024 & 2032
- Figure 47: Europe Proteomics Market Revenue (Million), by Country 2024 & 2032
- Figure 48: Europe Proteomics Market Volume (K Unit), by Country 2024 & 2032
- Figure 49: Europe Proteomics Market Revenue Share (%), by Country 2024 & 2032
- Figure 50: Europe Proteomics Market Volume Share (%), by Country 2024 & 2032
- Figure 51: Asia Pacific Proteomics Market Revenue (Million), by Product & Services 2024 & 2032
- Figure 52: Asia Pacific Proteomics Market Volume (K Unit), by Product & Services 2024 & 2032
- Figure 53: Asia Pacific Proteomics Market Revenue Share (%), by Product & Services 2024 & 2032
- Figure 54: Asia Pacific Proteomics Market Volume Share (%), by Product & Services 2024 & 2032
- Figure 55: Asia Pacific Proteomics Market Revenue (Million), by Application 2024 & 2032
- Figure 56: Asia Pacific Proteomics Market Volume (K Unit), by Application 2024 & 2032
- Figure 57: Asia Pacific Proteomics Market Revenue Share (%), by Application 2024 & 2032
- Figure 58: Asia Pacific Proteomics Market Volume Share (%), by Application 2024 & 2032
- Figure 59: Asia Pacific Proteomics Market Revenue (Million), by Country 2024 & 2032
- Figure 60: Asia Pacific Proteomics Market Volume (K Unit), by Country 2024 & 2032
- Figure 61: Asia Pacific Proteomics Market Revenue Share (%), by Country 2024 & 2032
- Figure 62: Asia Pacific Proteomics Market Volume Share (%), by Country 2024 & 2032
- Figure 63: Middle East Proteomics Market Revenue (Million), by Product & Services 2024 & 2032
- Figure 64: Middle East Proteomics Market Volume (K Unit), by Product & Services 2024 & 2032
- Figure 65: Middle East Proteomics Market Revenue Share (%), by Product & Services 2024 & 2032
- Figure 66: Middle East Proteomics Market Volume Share (%), by Product & Services 2024 & 2032
- Figure 67: Middle East Proteomics Market Revenue (Million), by Application 2024 & 2032
- Figure 68: Middle East Proteomics Market Volume (K Unit), by Application 2024 & 2032
- Figure 69: Middle East Proteomics Market Revenue Share (%), by Application 2024 & 2032
- Figure 70: Middle East Proteomics Market Volume Share (%), by Application 2024 & 2032
- Figure 71: Middle East Proteomics Market Revenue (Million), by Country 2024 & 2032
- Figure 72: Middle East Proteomics Market Volume (K Unit), by Country 2024 & 2032
- Figure 73: Middle East Proteomics Market Revenue Share (%), by Country 2024 & 2032
- Figure 74: Middle East Proteomics Market Volume Share (%), by Country 2024 & 2032
- Figure 75: GCC Proteomics Market Revenue (Million), by Product & Services 2024 & 2032
- Figure 76: GCC Proteomics Market Volume (K Unit), by Product & Services 2024 & 2032
- Figure 77: GCC Proteomics Market Revenue Share (%), by Product & Services 2024 & 2032
- Figure 78: GCC Proteomics Market Volume Share (%), by Product & Services 2024 & 2032
- Figure 79: GCC Proteomics Market Revenue (Million), by Application 2024 & 2032
- Figure 80: GCC Proteomics Market Volume (K Unit), by Application 2024 & 2032
- Figure 81: GCC Proteomics Market Revenue Share (%), by Application 2024 & 2032
- Figure 82: GCC Proteomics Market Volume Share (%), by Application 2024 & 2032
- Figure 83: GCC Proteomics Market Revenue (Million), by Country 2024 & 2032
- Figure 84: GCC Proteomics Market Volume (K Unit), by Country 2024 & 2032
- Figure 85: GCC Proteomics Market Revenue Share (%), by Country 2024 & 2032
- Figure 86: GCC Proteomics Market Volume Share (%), by Country 2024 & 2032
- Figure 87: South America Proteomics Market Revenue (Million), by Product & Services 2024 & 2032
- Figure 88: South America Proteomics Market Volume (K Unit), by Product & Services 2024 & 2032
- Figure 89: South America Proteomics Market Revenue Share (%), by Product & Services 2024 & 2032
- Figure 90: South America Proteomics Market Volume Share (%), by Product & Services 2024 & 2032
- Figure 91: South America Proteomics Market Revenue (Million), by Application 2024 & 2032
- Figure 92: South America Proteomics Market Volume (K Unit), by Application 2024 & 2032
- Figure 93: South America Proteomics Market Revenue Share (%), by Application 2024 & 2032
- Figure 94: South America Proteomics Market Volume Share (%), by Application 2024 & 2032
- Figure 95: South America Proteomics Market Revenue (Million), by Country 2024 & 2032
- Figure 96: South America Proteomics Market Volume (K Unit), by Country 2024 & 2032
- Figure 97: South America Proteomics Market Revenue Share (%), by Country 2024 & 2032
- Figure 98: South America Proteomics Market Volume Share (%), by Country 2024 & 2032
List of Tables
- Table 1: Global Proteomics Market Revenue Million Forecast, by Region 2019 & 2032
- Table 2: Global Proteomics Market Volume K Unit Forecast, by Region 2019 & 2032
- Table 3: Global Proteomics Market Revenue Million Forecast, by Product & Services 2019 & 2032
- Table 4: Global Proteomics Market Volume K Unit Forecast, by Product & Services 2019 & 2032
- Table 5: Global Proteomics Market Revenue Million Forecast, by Application 2019 & 2032
- Table 6: Global Proteomics Market Volume K Unit Forecast, by Application 2019 & 2032
- Table 7: Global Proteomics Market Revenue Million Forecast, by Region 2019 & 2032
- Table 8: Global Proteomics Market Volume K Unit Forecast, by Region 2019 & 2032
- Table 9: Global Proteomics Market Revenue Million Forecast, by Country 2019 & 2032
- Table 10: Global Proteomics Market Volume K Unit Forecast, by Country 2019 & 2032
- Table 11: United States Proteomics Market Revenue (Million) Forecast, by Application 2019 & 2032
- Table 12: United States Proteomics Market Volume (K Unit) Forecast, by Application 2019 & 2032
- Table 13: Canada Proteomics Market Revenue (Million) Forecast, by Application 2019 & 2032
- Table 14: Canada Proteomics Market Volume (K Unit) Forecast, by Application 2019 & 2032
- Table 15: Mexico Proteomics Market Revenue (Million) Forecast, by Application 2019 & 2032
- Table 16: Mexico Proteomics Market Volume (K Unit) Forecast, by Application 2019 & 2032
- Table 17: Global Proteomics Market Revenue Million Forecast, by Country 2019 & 2032
- Table 18: Global Proteomics Market Volume K Unit Forecast, by Country 2019 & 2032
- Table 19: Germany Proteomics Market Revenue (Million) Forecast, by Application 2019 & 2032
- Table 20: Germany Proteomics Market Volume (K Unit) Forecast, by Application 2019 & 2032
- Table 21: United Kingdom Proteomics Market Revenue (Million) Forecast, by Application 2019 & 2032
- Table 22: United Kingdom Proteomics Market Volume (K Unit) Forecast, by Application 2019 & 2032
- Table 23: France Proteomics Market Revenue (Million) Forecast, by Application 2019 & 2032
- Table 24: France Proteomics Market Volume (K Unit) Forecast, by Application 2019 & 2032
- Table 25: Italy Proteomics Market Revenue (Million) Forecast, by Application 2019 & 2032
- Table 26: Italy Proteomics Market Volume (K Unit) Forecast, by Application 2019 & 2032
- Table 27: Spain Proteomics Market Revenue (Million) Forecast, by Application 2019 & 2032
- Table 28: Spain Proteomics Market Volume (K Unit) Forecast, by Application 2019 & 2032
- Table 29: Rest of Europe Proteomics Market Revenue (Million) Forecast, by Application 2019 & 2032
- Table 30: Rest of Europe Proteomics Market Volume (K Unit) Forecast, by Application 2019 & 2032
- Table 31: Global Proteomics Market Revenue Million Forecast, by Country 2019 & 2032
- Table 32: Global Proteomics Market Volume K Unit Forecast, by Country 2019 & 2032
- Table 33: China Proteomics Market Revenue (Million) Forecast, by Application 2019 & 2032
- Table 34: China Proteomics Market Volume (K Unit) Forecast, by Application 2019 & 2032
- Table 35: Japan Proteomics Market Revenue (Million) Forecast, by Application 2019 & 2032
- Table 36: Japan Proteomics Market Volume (K Unit) Forecast, by Application 2019 & 2032
- Table 37: India Proteomics Market Revenue (Million) Forecast, by Application 2019 & 2032
- Table 38: India Proteomics Market Volume (K Unit) Forecast, by Application 2019 & 2032
- Table 39: Australia Proteomics Market Revenue (Million) Forecast, by Application 2019 & 2032
- Table 40: Australia Proteomics Market Volume (K Unit) Forecast, by Application 2019 & 2032
- Table 41: South Korea Proteomics Market Revenue (Million) Forecast, by Application 2019 & 2032
- Table 42: South Korea Proteomics Market Volume (K Unit) Forecast, by Application 2019 & 2032
- Table 43: Rest of Asia Pacific Proteomics Market Revenue (Million) Forecast, by Application 2019 & 2032
- Table 44: Rest of Asia Pacific Proteomics Market Volume (K Unit) Forecast, by Application 2019 & 2032
- Table 45: Global Proteomics Market Revenue Million Forecast, by Country 2019 & 2032
- Table 46: Global Proteomics Market Volume K Unit Forecast, by Country 2019 & 2032
- Table 47: Proteomics Market Revenue (Million) Forecast, by Application 2019 & 2032
- Table 48: Proteomics Market Volume (K Unit) Forecast, by Application 2019 & 2032
- Table 49: Global Proteomics Market Revenue Million Forecast, by Country 2019 & 2032
- Table 50: Global Proteomics Market Volume K Unit Forecast, by Country 2019 & 2032
- Table 51: South Africa Proteomics Market Revenue (Million) Forecast, by Application 2019 & 2032
- Table 52: South Africa Proteomics Market Volume (K Unit) Forecast, by Application 2019 & 2032
- Table 53: Rest of Middle East Proteomics Market Revenue (Million) Forecast, by Application 2019 & 2032
- Table 54: Rest of Middle East Proteomics Market Volume (K Unit) Forecast, by Application 2019 & 2032
- Table 55: Global Proteomics Market Revenue Million Forecast, by Country 2019 & 2032
- Table 56: Global Proteomics Market Volume K Unit Forecast, by Country 2019 & 2032
- Table 57: Brazil Proteomics Market Revenue (Million) Forecast, by Application 2019 & 2032
- Table 58: Brazil Proteomics Market Volume (K Unit) Forecast, by Application 2019 & 2032
- Table 59: Argentina Proteomics Market Revenue (Million) Forecast, by Application 2019 & 2032
- Table 60: Argentina Proteomics Market Volume (K Unit) Forecast, by Application 2019 & 2032
- Table 61: Rest of South America Proteomics Market Revenue (Million) Forecast, by Application 2019 & 2032
- Table 62: Rest of South America Proteomics Market Volume (K Unit) Forecast, by Application 2019 & 2032
- Table 63: Global Proteomics Market Revenue Million Forecast, by Product & Services 2019 & 2032
- Table 64: Global Proteomics Market Volume K Unit Forecast, by Product & Services 2019 & 2032
- Table 65: Global Proteomics Market Revenue Million Forecast, by Application 2019 & 2032
- Table 66: Global Proteomics Market Volume K Unit Forecast, by Application 2019 & 2032
- Table 67: Global Proteomics Market Revenue Million Forecast, by Country 2019 & 2032
- Table 68: Global Proteomics Market Volume K Unit Forecast, by Country 2019 & 2032
- Table 69: United States Proteomics Market Revenue (Million) Forecast, by Application 2019 & 2032
- Table 70: United States Proteomics Market Volume (K Unit) Forecast, by Application 2019 & 2032
- Table 71: Canada Proteomics Market Revenue (Million) Forecast, by Application 2019 & 2032
- Table 72: Canada Proteomics Market Volume (K Unit) Forecast, by Application 2019 & 2032
- Table 73: Mexico Proteomics Market Revenue (Million) Forecast, by Application 2019 & 2032
- Table 74: Mexico Proteomics Market Volume (K Unit) Forecast, by Application 2019 & 2032
- Table 75: Global Proteomics Market Revenue Million Forecast, by Product & Services 2019 & 2032
- Table 76: Global Proteomics Market Volume K Unit Forecast, by Product & Services 2019 & 2032
- Table 77: Global Proteomics Market Revenue Million Forecast, by Application 2019 & 2032
- Table 78: Global Proteomics Market Volume K Unit Forecast, by Application 2019 & 2032
- Table 79: Global Proteomics Market Revenue Million Forecast, by Country 2019 & 2032
- Table 80: Global Proteomics Market Volume K Unit Forecast, by Country 2019 & 2032
- Table 81: Germany Proteomics Market Revenue (Million) Forecast, by Application 2019 & 2032
- Table 82: Germany Proteomics Market Volume (K Unit) Forecast, by Application 2019 & 2032
- Table 83: United Kingdom Proteomics Market Revenue (Million) Forecast, by Application 2019 & 2032
- Table 84: United Kingdom Proteomics Market Volume (K Unit) Forecast, by Application 2019 & 2032
- Table 85: France Proteomics Market Revenue (Million) Forecast, by Application 2019 & 2032
- Table 86: France Proteomics Market Volume (K Unit) Forecast, by Application 2019 & 2032
- Table 87: Italy Proteomics Market Revenue (Million) Forecast, by Application 2019 & 2032
- Table 88: Italy Proteomics Market Volume (K Unit) Forecast, by Application 2019 & 2032
- Table 89: Spain Proteomics Market Revenue (Million) Forecast, by Application 2019 & 2032
- Table 90: Spain Proteomics Market Volume (K Unit) Forecast, by Application 2019 & 2032
- Table 91: Rest of Europe Proteomics Market Revenue (Million) Forecast, by Application 2019 & 2032
- Table 92: Rest of Europe Proteomics Market Volume (K Unit) Forecast, by Application 2019 & 2032
- Table 93: Global Proteomics Market Revenue Million Forecast, by Product & Services 2019 & 2032
- Table 94: Global Proteomics Market Volume K Unit Forecast, by Product & Services 2019 & 2032
- Table 95: Global Proteomics Market Revenue Million Forecast, by Application 2019 & 2032
- Table 96: Global Proteomics Market Volume K Unit Forecast, by Application 2019 & 2032
- Table 97: Global Proteomics Market Revenue Million Forecast, by Country 2019 & 2032
- Table 98: Global Proteomics Market Volume K Unit Forecast, by Country 2019 & 2032
- Table 99: China Proteomics Market Revenue (Million) Forecast, by Application 2019 & 2032
- Table 100: China Proteomics Market Volume (K Unit) Forecast, by Application 2019 & 2032
- Table 101: Japan Proteomics Market Revenue (Million) Forecast, by Application 2019 & 2032
- Table 102: Japan Proteomics Market Volume (K Unit) Forecast, by Application 2019 & 2032
- Table 103: India Proteomics Market Revenue (Million) Forecast, by Application 2019 & 2032
- Table 104: India Proteomics Market Volume (K Unit) Forecast, by Application 2019 & 2032
- Table 105: Australia Proteomics Market Revenue (Million) Forecast, by Application 2019 & 2032
- Table 106: Australia Proteomics Market Volume (K Unit) Forecast, by Application 2019 & 2032
- Table 107: South Korea Proteomics Market Revenue (Million) Forecast, by Application 2019 & 2032
- Table 108: South Korea Proteomics Market Volume (K Unit) Forecast, by Application 2019 & 2032
- Table 109: Rest of Asia Pacific Proteomics Market Revenue (Million) Forecast, by Application 2019 & 2032
- Table 110: Rest of Asia Pacific Proteomics Market Volume (K Unit) Forecast, by Application 2019 & 2032
- Table 111: Global Proteomics Market Revenue Million Forecast, by Product & Services 2019 & 2032
- Table 112: Global Proteomics Market Volume K Unit Forecast, by Product & Services 2019 & 2032
- Table 113: Global Proteomics Market Revenue Million Forecast, by Application 2019 & 2032
- Table 114: Global Proteomics Market Volume K Unit Forecast, by Application 2019 & 2032
- Table 115: Global Proteomics Market Revenue Million Forecast, by Country 2019 & 2032
- Table 116: Global Proteomics Market Volume K Unit Forecast, by Country 2019 & 2032
- Table 117: Global Proteomics Market Revenue Million Forecast, by Product & Services 2019 & 2032
- Table 118: Global Proteomics Market Volume K Unit Forecast, by Product & Services 2019 & 2032
- Table 119: Global Proteomics Market Revenue Million Forecast, by Application 2019 & 2032
- Table 120: Global Proteomics Market Volume K Unit Forecast, by Application 2019 & 2032
- Table 121: Global Proteomics Market Revenue Million Forecast, by Country 2019 & 2032
- Table 122: Global Proteomics Market Volume K Unit Forecast, by Country 2019 & 2032
- Table 123: South Africa Proteomics Market Revenue (Million) Forecast, by Application 2019 & 2032
- Table 124: South Africa Proteomics Market Volume (K Unit) Forecast, by Application 2019 & 2032
- Table 125: Rest of Middle East Proteomics Market Revenue (Million) Forecast, by Application 2019 & 2032
- Table 126: Rest of Middle East Proteomics Market Volume (K Unit) Forecast, by Application 2019 & 2032
- Table 127: Global Proteomics Market Revenue Million Forecast, by Product & Services 2019 & 2032
- Table 128: Global Proteomics Market Volume K Unit Forecast, by Product & Services 2019 & 2032
- Table 129: Global Proteomics Market Revenue Million Forecast, by Application 2019 & 2032
- Table 130: Global Proteomics Market Volume K Unit Forecast, by Application 2019 & 2032
- Table 131: Global Proteomics Market Revenue Million Forecast, by Country 2019 & 2032
- Table 132: Global Proteomics Market Volume K Unit Forecast, by Country 2019 & 2032
- Table 133: Brazil Proteomics Market Revenue (Million) Forecast, by Application 2019 & 2032
- Table 134: Brazil Proteomics Market Volume (K Unit) Forecast, by Application 2019 & 2032
- Table 135: Argentina Proteomics Market Revenue (Million) Forecast, by Application 2019 & 2032
- Table 136: Argentina Proteomics Market Volume (K Unit) Forecast, by Application 2019 & 2032
- Table 137: Rest of South America Proteomics Market Revenue (Million) Forecast, by Application 2019 & 2032
- Table 138: Rest of South America Proteomics Market Volume (K Unit) Forecast, by Application 2019 & 2032
Frequently Asked Questions
1. What is the projected Compound Annual Growth Rate (CAGR) of the Proteomics Market?
The projected CAGR is approximately 8.42%.
2. Which companies are prominent players in the Proteomics Market?
Key companies in the market include Promega Corporation, Bio-Rad Laboratories Inc, Waters Corporation, Merck KGaA, GE Healthcare, Thermo Fisher Scientific Inc, Danaher Corporation, Agilent Technologies Inc, Bruker Corporation.
3. What are the main segments of the Proteomics Market?
The market segments include Product & Services, Application.
4. Can you provide details about the market size?
The market size is estimated to be USD 27.60 Million as of 2022.
5. What are some drivers contributing to market growth?
Rising Demand for Personalized Medicine; Increasing R&D Expenditure and Government Funding for Proteomics; Technological Advancements.
6. What are the notable trends driving market growth?
Drug Discovery is Expected to Witness Healthy CAGR in Future.
7. Are there any restraints impacting market growth?
High Cost of Instruments.
8. Can you provide examples of recent developments in the market?
N/A
9. What pricing options are available for accessing the report?
Pricing options include single-user, multi-user, and enterprise licenses priced at USD 4750, USD 5250, and USD 8750 respectively.
10. Is the market size provided in terms of value or volume?
The market size is provided in terms of value, measured in Million and volume, measured in K Unit.
11. Are there any specific market keywords associated with the report?
Yes, the market keyword associated with the report is "Proteomics Market," which aids in identifying and referencing the specific market segment covered.
12. How do I determine which pricing option suits my needs best?
The pricing options vary based on user requirements and access needs. Individual users may opt for single-user licenses, while businesses requiring broader access may choose multi-user or enterprise licenses for cost-effective access to the report.
13. Are there any additional resources or data provided in the Proteomics Market report?
While the report offers comprehensive insights, it's advisable to review the specific contents or supplementary materials provided to ascertain if additional resources or data are available.
14. How can I stay updated on further developments or reports in the Proteomics Market?
To stay informed about further developments, trends, and reports in the Proteomics Market, consider subscribing to industry newsletters, following relevant companies and organizations, or regularly checking reputable industry news sources and publications.
Methodology
Step 1 - Identification of Relevant Samples Size from Population Database


Step 2 - Approaches for Defining Global Market Size (Value, Volume* & Price*)

Note*: In applicable scenarios
Step 3 - Data Sources
Primary Research
- Web Analytics
- Survey Reports
- Research Institute
- Latest Research Reports
- Opinion Leaders
Secondary Research
- Annual Reports
- White Paper
- Latest Press Release
- Industry Association
- Paid Database
- Investor Presentations

Step 4 - Data Triangulation
Involves using different sources of information in order to increase the validity of a study
These sources are likely to be stakeholders in a program - participants, other researchers, program staff, other community members, and so on.
Then we put all data in single framework & apply various statistical tools to find out the dynamic on the market.
During the analysis stage, feedback from the stakeholder groups would be compared to determine areas of agreement as well as areas of divergence


