
Key Insights
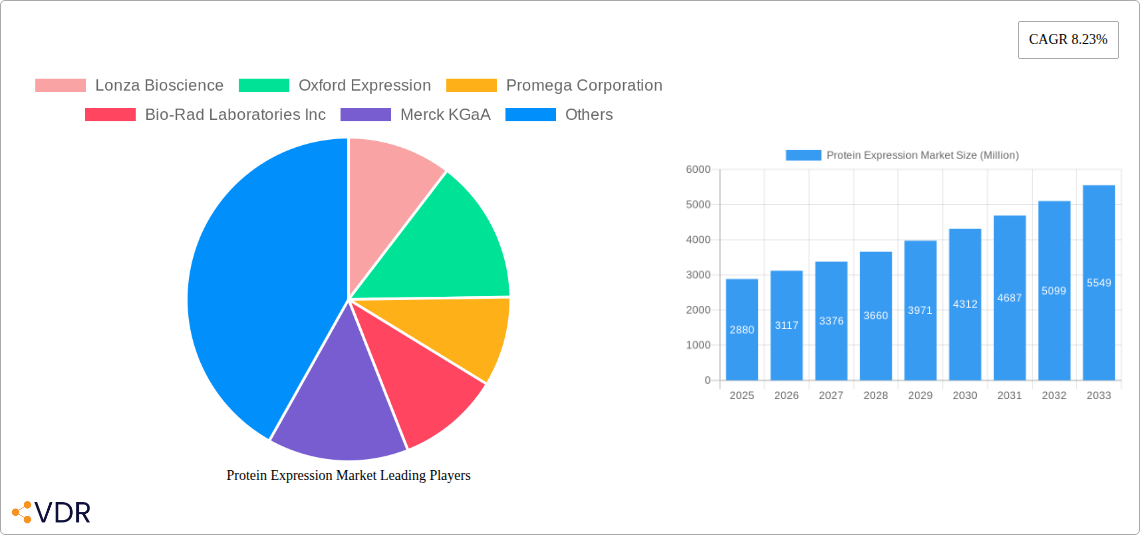
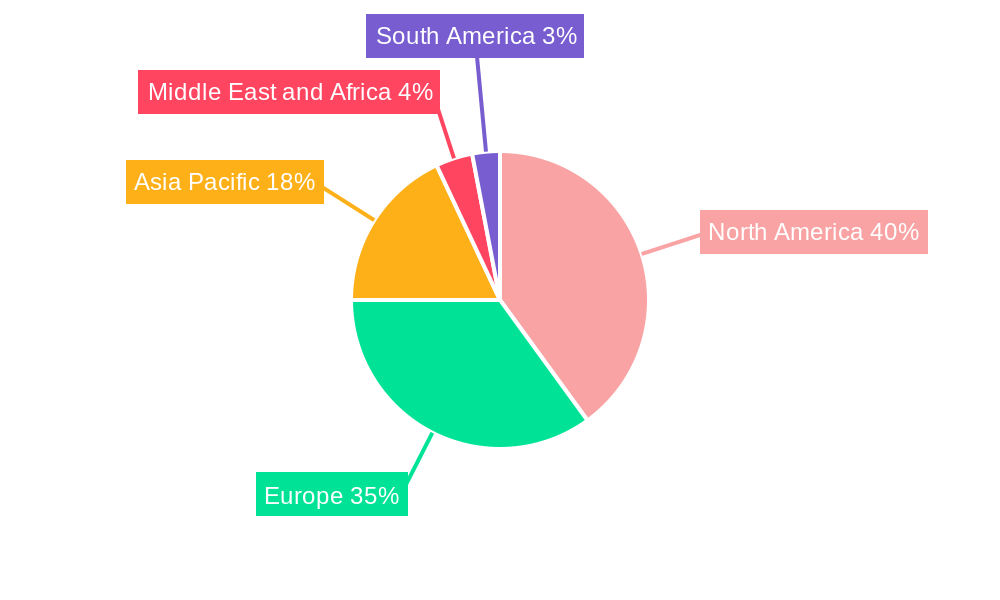
The global protein expression market, valued at $2.88 billion in 2025, is projected to experience robust growth, driven by a compound annual growth rate (CAGR) of 8.23% from 2025 to 2033. This expansion is fueled by several key factors. The burgeoning biopharmaceutical industry, with its increasing demand for novel therapeutic proteins and advanced research tools, is a primary driver. The rising prevalence of chronic diseases necessitates the development of innovative protein-based therapies, further bolstering market growth. Technological advancements in protein expression systems, such as improved efficiency and scalability of existing methods and the emergence of novel approaches like cell-free expression systems, contribute significantly. Furthermore, the growing adoption of contract research organizations (CROs) by pharmaceutical and biotechnology companies to accelerate drug discovery and development processes fuels market expansion. The therapeutic application segment holds the largest market share, followed by research and industrial applications. Within the end-user segment, biotechnology and pharmaceutical companies dominate, owing to their extensive research and development activities. The reagents and kits segment represents a significant portion of the product market, reflecting the high demand for these essential tools. Geographically, North America and Europe currently hold the largest market shares, attributed to strong research infrastructure and high healthcare expenditure. However, Asia Pacific is poised for significant growth, driven by increasing investments in biotechnology and pharmaceuticals within rapidly developing economies.
The market, however, faces certain challenges. High research and development costs associated with new protein expression technologies and the stringent regulatory environment surrounding biopharmaceutical products can act as restraints. The potential for market saturation in mature regions like North America and Europe could also impact growth. Nevertheless, the ongoing advancements in technology, coupled with increasing demand for personalized medicine and biosimilars, are expected to overcome these challenges and sustain the market’s robust growth trajectory over the forecast period. The competitive landscape is characterized by a mix of large multinational corporations and specialized smaller companies, leading to continuous innovation and competitive pricing. The market is expected to see further consolidation through mergers and acquisitions in the coming years.
Protein Expression Market: A Comprehensive Report (2019-2033)
This in-depth report provides a comprehensive analysis of the Protein Expression Market, encompassing market dynamics, growth trends, regional segmentation, product landscape, key players, and future outlook. The study period covers 2019-2033, with 2025 as the base and estimated year. The forecast period spans 2025-2033, and the historical period encompasses 2019-2024. The report is crucial for stakeholders across the parent market (Life Sciences) and child markets (Biotechnology, Pharmaceuticals, and Research) seeking strategic insights and informed decision-making. The market size is projected to reach xx Million by 2033.
Protein Expression Market Market Dynamics & Structure
The Protein Expression Market is characterized by moderate concentration, with key players like Thermo Fisher Scientific Inc, Merck KGaA, and Bio-Rad Laboratories Inc holding significant market share. Technological advancements, particularly in CRISPR technology and automation, are major growth drivers. Stringent regulatory frameworks for therapeutic applications influence market dynamics. Competitive substitutes include alternative protein production methods, impacting market penetration. End-user demographics are shifting towards increased adoption by CROs and biotechnology companies. M&A activity in the sector is moderate, with approximately xx deals recorded in the past five years, indicating consolidation and expansion strategies.
- Market Concentration: Moderately concentrated, with top 5 players holding xx% market share (2024).
- Technological Innovation: CRISPR technology, automation, and high-throughput screening are key drivers.
- Regulatory Landscape: Stringent regulations for therapeutic applications, impacting time-to-market.
- Competitive Substitutes: Alternative protein production methods pose a moderate competitive threat.
- End-User Demographics: Growing adoption by CROs and biotechnology companies.
- M&A Activity: Approximately xx M&A deals recorded between 2019 and 2024.
Protein Expression Market Growth Trends & Insights
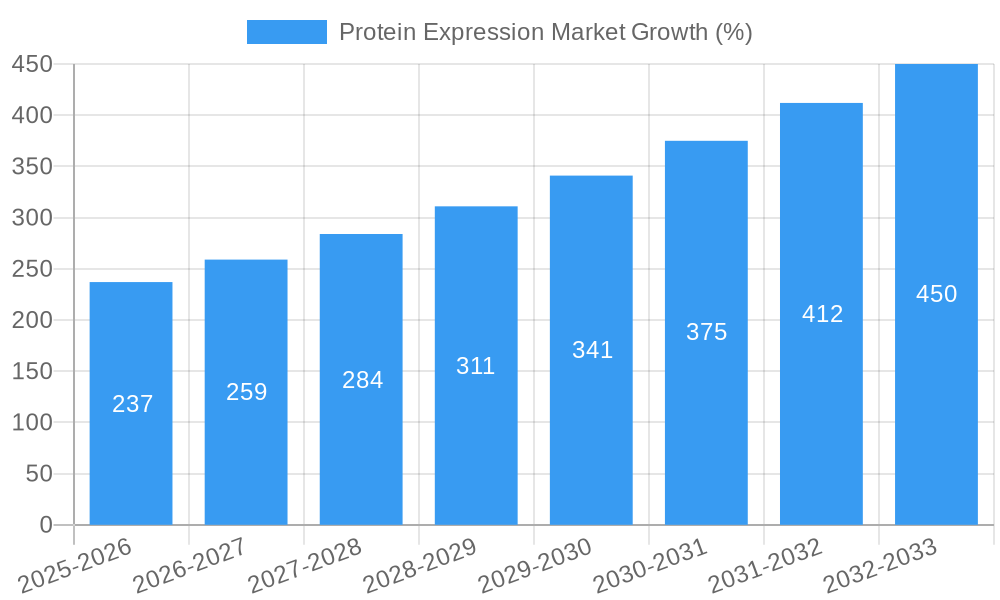
The Protein Expression Market has witnessed consistent growth, driven by increased demand for therapeutic proteins, research applications, and industrial enzymes. The market size grew from xx Million in 2019 to xx Million in 2024, exhibiting a CAGR of xx%. This growth is fueled by technological advancements, rising research funding, and increased outsourcing to CROs. The market penetration of advanced expression systems, such as mammalian cell lines, is increasing, while adoption of simpler systems is stabilizing. Shifting consumer behavior towards personalized medicine and faster drug development further accelerates market expansion. Future growth is projected to be driven by the increasing adoption of CRISPR gene editing technologies, along with the expansion of contract research services.
Dominant Regions, Countries, or Segments in Protein Expression Market
North America currently dominates the Protein Expression Market, driven by robust research funding, a strong presence of key players, and advanced healthcare infrastructure. However, the Asia-Pacific region exhibits the highest growth potential due to increasing healthcare spending and a burgeoning biotechnology sector. Within segments, the therapeutic applications segment holds the largest market share, followed by research and industrial applications. Biotechnology and pharmaceutical companies are the major end users, with CROs witnessing rapid growth.
- North America: Dominates the market due to robust R&D investment and presence of major players.
- Asia-Pacific: Fastest-growing region due to expanding healthcare infrastructure and rising R&D investments.
- Therapeutic Applications: Holds the largest market share, driven by the biopharmaceutical industry’s growth.
- Biotechnology and Pharmaceutical Companies: Major end users, driving significant market demand.
- CROs: Fastest-growing end-user segment, fueled by outsourcing trends.
Protein Expression Market Product Landscape
The Protein Expression Market offers a diverse range of products, including reagents and kits, expression systems (bacterial, mammalian, yeast), and services. Recent innovations focus on enhancing efficiency, reducing costs, and improving protein yield. Reagents and kits are experiencing significant growth driven by their ease of use and standardization, whilst services are experiencing steady growth fueled by increased outsourcing. Unique selling propositions include high-throughput screening capabilities, automation, and customized solutions tailored to specific research needs.
Key Drivers, Barriers & Challenges in Protein Expression Market
Key Drivers:
- Increased demand for therapeutic proteins and biopharmaceuticals.
- Rising R&D spending in life sciences.
- Technological advancements like CRISPR-Cas9 and next-generation sequencing.
- Growth of contract research organizations (CROs).
Challenges & Restraints:
- High cost of reagents and specialized equipment.
- Stringent regulatory requirements for therapeutic applications.
- Potential for contamination and downstream processing challenges.
- Intense competition among established and emerging players. This leads to reduced profit margins and an increase in M&A activity to gain market share.
Emerging Opportunities in Protein Expression Market
Emerging opportunities exist in personalized medicine, cell and gene therapy, and the development of novel protein therapeutics. Untapped markets include emerging economies with growing healthcare sectors. Innovations in protein engineering and synthetic biology will further expand application possibilities. The development of efficient, cost-effective expression systems for challenging proteins represents a significant opportunity for market growth.
Growth Accelerators in the Protein Expression Market Industry
Strategic partnerships between research institutions and industry players, along with government initiatives promoting biotech innovation, are accelerating market growth. Technological breakthroughs in high-throughput screening, automation, and advanced analytics significantly improve efficiency and reduce costs. Expansion into new geographic markets, particularly in emerging economies, presents lucrative opportunities for market leaders.
Key Players Shaping the Protein Expression Market Market
- Lonza Bioscience
- Oxford Expression
- Promega Corporation
- Bio-Rad Laboratories Inc
- Merck KGaA
- Sino Biological Inc
- Thermo Fisher Scientific Inc
- Takara Bio Inc
- Agilent Technologies Inc
- New England Biolabs Inc
- Qiagen NV
- Synthetic Genomics Inc
- Bioneer Corporation
Notable Milestones in Protein Expression Market Sector
- September 2021: Aviva Systems Biology launched its "Protein on Demand" portfolio.
- June 2021: Qiagen launched CRISPR products (QIAprep CRISPR Kit and CRISPR Q-Primer Solution).
In-Depth Protein Expression Market Market Outlook
The Protein Expression Market is poised for significant growth over the next decade, driven by continued innovation, expanding applications, and increased demand from various sectors. Strategic partnerships, investments in R&D, and geographical expansion will shape the market landscape. The development of novel expression systems and advanced analytical techniques will further unlock market potential, creating opportunities for both established and emerging players to capitalize on this promising market.
Protein Expression Market Segmentation
-
1. Product
-
1.1. Reagents and Kits
- 1.1.1. Cell-free Expression
- 1.1.2. Bacterial Expression
- 1.1.3. Yeast Expression
- 1.1.4. Algal Expression
- 1.1.5. Insect Expression
- 1.1.6. Mammalian Expression
- 1.1.7. Other Expression Systems
- 1.2. Service
- 1.3. Other Products
-
1.1. Reagents and Kits
-
2. Application
- 2.1. Therapeutic
- 2.2. Industrial
- 2.3. Research
-
3. End User
- 3.1. Academia
- 3.2. Biotechnology and Pharmaceuticals Companies
- 3.3. Contract Research Organizations (CROs)
Protein Expression Market Segmentation By Geography
-
1. North America
- 1.1. United States
- 1.2. Canada
- 1.3. Mexico
-
2. Europe
- 2.1. Germany
- 2.2. United Kingdom
- 2.3. France
- 2.4. Italy
- 2.5. Spain
- 2.6. Rest of Europe
-
3. Asia Pacific
- 3.1. China
- 3.2. Japan
- 3.3. India
- 3.4. Australia
- 3.5. South Korea
- 3.6. Rest of Asia Pacific
-
4. Middle East and Africa
- 4.1. GCC
- 4.2. South Africa
- 4.3. Rest of Middle East and Africa
-
5. South America
- 5.1. Brazil
- 5.2. Argentina
- 5.3. Rest of South America
Protein Expression Market REPORT HIGHLIGHTS
| Aspects | Details |
|---|---|
| Study Period | 2019-2033 |
| Base Year | 2024 |
| Estimated Year | 2025 |
| Forecast Period | 2025-2033 |
| Historical Period | 2019-2024 |
| Growth Rate | CAGR of 8.23% from 2019-2033 |
| Segmentation |
|
Table of Contents
- 1. Introduction
- 1.1. Research Scope
- 1.2. Market Segmentation
- 1.3. Research Methodology
- 1.4. Definitions and Assumptions
- 2. Executive Summary
- 2.1. Introduction
- 3. Market Dynamics
- 3.1. Introduction
- 3.2. Market Drivers
- 3.2.1. Rising R&D Activity in the Pharmaceutical Sector; Escalation in the Biologics Market; Government Support for Proteomics and Genomics Research
- 3.3. Market Restrains
- 3.3.1. High Cost of Protein Expression Systems; Lack of Effective Systems for Post-translational Modifications
- 3.4. Market Trends
- 3.4.1. Cell-free Expression is Expected to Hold a Major Market Share in the Protein Expression Market
- 4. Market Factor Analysis
- 4.1. Porters Five Forces
- 4.2. Supply/Value Chain
- 4.3. PESTEL analysis
- 4.4. Market Entropy
- 4.5. Patent/Trademark Analysis
- 5. Global Protein Expression Market Analysis, Insights and Forecast, 2019-2031
- 5.1. Market Analysis, Insights and Forecast - by Product
- 5.1.1. Reagents and Kits
- 5.1.1.1. Cell-free Expression
- 5.1.1.2. Bacterial Expression
- 5.1.1.3. Yeast Expression
- 5.1.1.4. Algal Expression
- 5.1.1.5. Insect Expression
- 5.1.1.6. Mammalian Expression
- 5.1.1.7. Other Expression Systems
- 5.1.2. Service
- 5.1.3. Other Products
- 5.1.1. Reagents and Kits
- 5.2. Market Analysis, Insights and Forecast - by Application
- 5.2.1. Therapeutic
- 5.2.2. Industrial
- 5.2.3. Research
- 5.3. Market Analysis, Insights and Forecast - by End User
- 5.3.1. Academia
- 5.3.2. Biotechnology and Pharmaceuticals Companies
- 5.3.3. Contract Research Organizations (CROs)
- 5.4. Market Analysis, Insights and Forecast - by Region
- 5.4.1. North America
- 5.4.2. Europe
- 5.4.3. Asia Pacific
- 5.4.4. Middle East and Africa
- 5.4.5. South America
- 5.1. Market Analysis, Insights and Forecast - by Product
- 6. North America Protein Expression Market Analysis, Insights and Forecast, 2019-2031
- 6.1. Market Analysis, Insights and Forecast - by Product
- 6.1.1. Reagents and Kits
- 6.1.1.1. Cell-free Expression
- 6.1.1.2. Bacterial Expression
- 6.1.1.3. Yeast Expression
- 6.1.1.4. Algal Expression
- 6.1.1.5. Insect Expression
- 6.1.1.6. Mammalian Expression
- 6.1.1.7. Other Expression Systems
- 6.1.2. Service
- 6.1.3. Other Products
- 6.1.1. Reagents and Kits
- 6.2. Market Analysis, Insights and Forecast - by Application
- 6.2.1. Therapeutic
- 6.2.2. Industrial
- 6.2.3. Research
- 6.3. Market Analysis, Insights and Forecast - by End User
- 6.3.1. Academia
- 6.3.2. Biotechnology and Pharmaceuticals Companies
- 6.3.3. Contract Research Organizations (CROs)
- 6.1. Market Analysis, Insights and Forecast - by Product
- 7. Europe Protein Expression Market Analysis, Insights and Forecast, 2019-2031
- 7.1. Market Analysis, Insights and Forecast - by Product
- 7.1.1. Reagents and Kits
- 7.1.1.1. Cell-free Expression
- 7.1.1.2. Bacterial Expression
- 7.1.1.3. Yeast Expression
- 7.1.1.4. Algal Expression
- 7.1.1.5. Insect Expression
- 7.1.1.6. Mammalian Expression
- 7.1.1.7. Other Expression Systems
- 7.1.2. Service
- 7.1.3. Other Products
- 7.1.1. Reagents and Kits
- 7.2. Market Analysis, Insights and Forecast - by Application
- 7.2.1. Therapeutic
- 7.2.2. Industrial
- 7.2.3. Research
- 7.3. Market Analysis, Insights and Forecast - by End User
- 7.3.1. Academia
- 7.3.2. Biotechnology and Pharmaceuticals Companies
- 7.3.3. Contract Research Organizations (CROs)
- 7.1. Market Analysis, Insights and Forecast - by Product
- 8. Asia Pacific Protein Expression Market Analysis, Insights and Forecast, 2019-2031
- 8.1. Market Analysis, Insights and Forecast - by Product
- 8.1.1. Reagents and Kits
- 8.1.1.1. Cell-free Expression
- 8.1.1.2. Bacterial Expression
- 8.1.1.3. Yeast Expression
- 8.1.1.4. Algal Expression
- 8.1.1.5. Insect Expression
- 8.1.1.6. Mammalian Expression
- 8.1.1.7. Other Expression Systems
- 8.1.2. Service
- 8.1.3. Other Products
- 8.1.1. Reagents and Kits
- 8.2. Market Analysis, Insights and Forecast - by Application
- 8.2.1. Therapeutic
- 8.2.2. Industrial
- 8.2.3. Research
- 8.3. Market Analysis, Insights and Forecast - by End User
- 8.3.1. Academia
- 8.3.2. Biotechnology and Pharmaceuticals Companies
- 8.3.3. Contract Research Organizations (CROs)
- 8.1. Market Analysis, Insights and Forecast - by Product
- 9. Middle East and Africa Protein Expression Market Analysis, Insights and Forecast, 2019-2031
- 9.1. Market Analysis, Insights and Forecast - by Product
- 9.1.1. Reagents and Kits
- 9.1.1.1. Cell-free Expression
- 9.1.1.2. Bacterial Expression
- 9.1.1.3. Yeast Expression
- 9.1.1.4. Algal Expression
- 9.1.1.5. Insect Expression
- 9.1.1.6. Mammalian Expression
- 9.1.1.7. Other Expression Systems
- 9.1.2. Service
- 9.1.3. Other Products
- 9.1.1. Reagents and Kits
- 9.2. Market Analysis, Insights and Forecast - by Application
- 9.2.1. Therapeutic
- 9.2.2. Industrial
- 9.2.3. Research
- 9.3. Market Analysis, Insights and Forecast - by End User
- 9.3.1. Academia
- 9.3.2. Biotechnology and Pharmaceuticals Companies
- 9.3.3. Contract Research Organizations (CROs)
- 9.1. Market Analysis, Insights and Forecast - by Product
- 10. South America Protein Expression Market Analysis, Insights and Forecast, 2019-2031
- 10.1. Market Analysis, Insights and Forecast - by Product
- 10.1.1. Reagents and Kits
- 10.1.1.1. Cell-free Expression
- 10.1.1.2. Bacterial Expression
- 10.1.1.3. Yeast Expression
- 10.1.1.4. Algal Expression
- 10.1.1.5. Insect Expression
- 10.1.1.6. Mammalian Expression
- 10.1.1.7. Other Expression Systems
- 10.1.2. Service
- 10.1.3. Other Products
- 10.1.1. Reagents and Kits
- 10.2. Market Analysis, Insights and Forecast - by Application
- 10.2.1. Therapeutic
- 10.2.2. Industrial
- 10.2.3. Research
- 10.3. Market Analysis, Insights and Forecast - by End User
- 10.3.1. Academia
- 10.3.2. Biotechnology and Pharmaceuticals Companies
- 10.3.3. Contract Research Organizations (CROs)
- 10.1. Market Analysis, Insights and Forecast - by Product
- 11. North America Protein Expression Market Analysis, Insights and Forecast, 2019-2031
- 11.1. Market Analysis, Insights and Forecast - By Country/Sub-region
- 11.1.1 United States
- 11.1.2 Canada
- 11.1.3 Mexico
- 12. Europe Protein Expression Market Analysis, Insights and Forecast, 2019-2031
- 12.1. Market Analysis, Insights and Forecast - By Country/Sub-region
- 12.1.1 Germany
- 12.1.2 United Kingdom
- 12.1.3 France
- 12.1.4 Italy
- 12.1.5 Spain
- 12.1.6 Rest of Europe
- 13. Asia Pacific Protein Expression Market Analysis, Insights and Forecast, 2019-2031
- 13.1. Market Analysis, Insights and Forecast - By Country/Sub-region
- 13.1.1 China
- 13.1.2 Japan
- 13.1.3 India
- 13.1.4 Australia
- 13.1.5 South Korea
- 13.1.6 Rest of Asia Pacific
- 14. Middle East and Africa Protein Expression Market Analysis, Insights and Forecast, 2019-2031
- 14.1. Market Analysis, Insights and Forecast - By Country/Sub-region
- 14.1.1 GCC
- 14.1.2 South Africa
- 14.1.3 Rest of Middle East and Africa
- 15. South America Protein Expression Market Analysis, Insights and Forecast, 2019-2031
- 15.1. Market Analysis, Insights and Forecast - By Country/Sub-region
- 15.1.1 Brazil
- 15.1.2 Argentina
- 15.1.3 Rest of South America
- 16. Competitive Analysis
- 16.1. Global Market Share Analysis 2024
- 16.2. Company Profiles
- 16.2.1 Lonza Bioscience
- 16.2.1.1. Overview
- 16.2.1.2. Products
- 16.2.1.3. SWOT Analysis
- 16.2.1.4. Recent Developments
- 16.2.1.5. Financials (Based on Availability)
- 16.2.2 Oxford Expression
- 16.2.2.1. Overview
- 16.2.2.2. Products
- 16.2.2.3. SWOT Analysis
- 16.2.2.4. Recent Developments
- 16.2.2.5. Financials (Based on Availability)
- 16.2.3 Promega Corporation
- 16.2.3.1. Overview
- 16.2.3.2. Products
- 16.2.3.3. SWOT Analysis
- 16.2.3.4. Recent Developments
- 16.2.3.5. Financials (Based on Availability)
- 16.2.4 Bio-Rad Laboratories Inc
- 16.2.4.1. Overview
- 16.2.4.2. Products
- 16.2.4.3. SWOT Analysis
- 16.2.4.4. Recent Developments
- 16.2.4.5. Financials (Based on Availability)
- 16.2.5 Merck KGaA
- 16.2.5.1. Overview
- 16.2.5.2. Products
- 16.2.5.3. SWOT Analysis
- 16.2.5.4. Recent Developments
- 16.2.5.5. Financials (Based on Availability)
- 16.2.6 Sino Biological Inc
- 16.2.6.1. Overview
- 16.2.6.2. Products
- 16.2.6.3. SWOT Analysis
- 16.2.6.4. Recent Developments
- 16.2.6.5. Financials (Based on Availability)
- 16.2.7 Thermo Fisher Scientific Inc
- 16.2.7.1. Overview
- 16.2.7.2. Products
- 16.2.7.3. SWOT Analysis
- 16.2.7.4. Recent Developments
- 16.2.7.5. Financials (Based on Availability)
- 16.2.8 Takara Bio Inc
- 16.2.8.1. Overview
- 16.2.8.2. Products
- 16.2.8.3. SWOT Analysis
- 16.2.8.4. Recent Developments
- 16.2.8.5. Financials (Based on Availability)
- 16.2.9 Agilent Technologies Inc
- 16.2.9.1. Overview
- 16.2.9.2. Products
- 16.2.9.3. SWOT Analysis
- 16.2.9.4. Recent Developments
- 16.2.9.5. Financials (Based on Availability)
- 16.2.10 New England Biolabs Inc
- 16.2.10.1. Overview
- 16.2.10.2. Products
- 16.2.10.3. SWOT Analysis
- 16.2.10.4. Recent Developments
- 16.2.10.5. Financials (Based on Availability)
- 16.2.11 Qiagen NV
- 16.2.11.1. Overview
- 16.2.11.2. Products
- 16.2.11.3. SWOT Analysis
- 16.2.11.4. Recent Developments
- 16.2.11.5. Financials (Based on Availability)
- 16.2.12 Synthetic Genomics Inc
- 16.2.12.1. Overview
- 16.2.12.2. Products
- 16.2.12.3. SWOT Analysis
- 16.2.12.4. Recent Developments
- 16.2.12.5. Financials (Based on Availability)
- 16.2.13 Bioneer Corporation
- 16.2.13.1. Overview
- 16.2.13.2. Products
- 16.2.13.3. SWOT Analysis
- 16.2.13.4. Recent Developments
- 16.2.13.5. Financials (Based on Availability)
- 16.2.1 Lonza Bioscience
List of Figures
- Figure 1: Global Protein Expression Market Revenue Breakdown (Million, %) by Region 2024 & 2032
- Figure 2: Global Protein Expression Market Volume Breakdown (K Unit, %) by Region 2024 & 2032
- Figure 3: North America Protein Expression Market Revenue (Million), by Country 2024 & 2032
- Figure 4: North America Protein Expression Market Volume (K Unit), by Country 2024 & 2032
- Figure 5: North America Protein Expression Market Revenue Share (%), by Country 2024 & 2032
- Figure 6: North America Protein Expression Market Volume Share (%), by Country 2024 & 2032
- Figure 7: Europe Protein Expression Market Revenue (Million), by Country 2024 & 2032
- Figure 8: Europe Protein Expression Market Volume (K Unit), by Country 2024 & 2032
- Figure 9: Europe Protein Expression Market Revenue Share (%), by Country 2024 & 2032
- Figure 10: Europe Protein Expression Market Volume Share (%), by Country 2024 & 2032
- Figure 11: Asia Pacific Protein Expression Market Revenue (Million), by Country 2024 & 2032
- Figure 12: Asia Pacific Protein Expression Market Volume (K Unit), by Country 2024 & 2032
- Figure 13: Asia Pacific Protein Expression Market Revenue Share (%), by Country 2024 & 2032
- Figure 14: Asia Pacific Protein Expression Market Volume Share (%), by Country 2024 & 2032
- Figure 15: Middle East and Africa Protein Expression Market Revenue (Million), by Country 2024 & 2032
- Figure 16: Middle East and Africa Protein Expression Market Volume (K Unit), by Country 2024 & 2032
- Figure 17: Middle East and Africa Protein Expression Market Revenue Share (%), by Country 2024 & 2032
- Figure 18: Middle East and Africa Protein Expression Market Volume Share (%), by Country 2024 & 2032
- Figure 19: South America Protein Expression Market Revenue (Million), by Country 2024 & 2032
- Figure 20: South America Protein Expression Market Volume (K Unit), by Country 2024 & 2032
- Figure 21: South America Protein Expression Market Revenue Share (%), by Country 2024 & 2032
- Figure 22: South America Protein Expression Market Volume Share (%), by Country 2024 & 2032
- Figure 23: North America Protein Expression Market Revenue (Million), by Product 2024 & 2032
- Figure 24: North America Protein Expression Market Volume (K Unit), by Product 2024 & 2032
- Figure 25: North America Protein Expression Market Revenue Share (%), by Product 2024 & 2032
- Figure 26: North America Protein Expression Market Volume Share (%), by Product 2024 & 2032
- Figure 27: North America Protein Expression Market Revenue (Million), by Application 2024 & 2032
- Figure 28: North America Protein Expression Market Volume (K Unit), by Application 2024 & 2032
- Figure 29: North America Protein Expression Market Revenue Share (%), by Application 2024 & 2032
- Figure 30: North America Protein Expression Market Volume Share (%), by Application 2024 & 2032
- Figure 31: North America Protein Expression Market Revenue (Million), by End User 2024 & 2032
- Figure 32: North America Protein Expression Market Volume (K Unit), by End User 2024 & 2032
- Figure 33: North America Protein Expression Market Revenue Share (%), by End User 2024 & 2032
- Figure 34: North America Protein Expression Market Volume Share (%), by End User 2024 & 2032
- Figure 35: North America Protein Expression Market Revenue (Million), by Country 2024 & 2032
- Figure 36: North America Protein Expression Market Volume (K Unit), by Country 2024 & 2032
- Figure 37: North America Protein Expression Market Revenue Share (%), by Country 2024 & 2032
- Figure 38: North America Protein Expression Market Volume Share (%), by Country 2024 & 2032
- Figure 39: Europe Protein Expression Market Revenue (Million), by Product 2024 & 2032
- Figure 40: Europe Protein Expression Market Volume (K Unit), by Product 2024 & 2032
- Figure 41: Europe Protein Expression Market Revenue Share (%), by Product 2024 & 2032
- Figure 42: Europe Protein Expression Market Volume Share (%), by Product 2024 & 2032
- Figure 43: Europe Protein Expression Market Revenue (Million), by Application 2024 & 2032
- Figure 44: Europe Protein Expression Market Volume (K Unit), by Application 2024 & 2032
- Figure 45: Europe Protein Expression Market Revenue Share (%), by Application 2024 & 2032
- Figure 46: Europe Protein Expression Market Volume Share (%), by Application 2024 & 2032
- Figure 47: Europe Protein Expression Market Revenue (Million), by End User 2024 & 2032
- Figure 48: Europe Protein Expression Market Volume (K Unit), by End User 2024 & 2032
- Figure 49: Europe Protein Expression Market Revenue Share (%), by End User 2024 & 2032
- Figure 50: Europe Protein Expression Market Volume Share (%), by End User 2024 & 2032
- Figure 51: Europe Protein Expression Market Revenue (Million), by Country 2024 & 2032
- Figure 52: Europe Protein Expression Market Volume (K Unit), by Country 2024 & 2032
- Figure 53: Europe Protein Expression Market Revenue Share (%), by Country 2024 & 2032
- Figure 54: Europe Protein Expression Market Volume Share (%), by Country 2024 & 2032
- Figure 55: Asia Pacific Protein Expression Market Revenue (Million), by Product 2024 & 2032
- Figure 56: Asia Pacific Protein Expression Market Volume (K Unit), by Product 2024 & 2032
- Figure 57: Asia Pacific Protein Expression Market Revenue Share (%), by Product 2024 & 2032
- Figure 58: Asia Pacific Protein Expression Market Volume Share (%), by Product 2024 & 2032
- Figure 59: Asia Pacific Protein Expression Market Revenue (Million), by Application 2024 & 2032
- Figure 60: Asia Pacific Protein Expression Market Volume (K Unit), by Application 2024 & 2032
- Figure 61: Asia Pacific Protein Expression Market Revenue Share (%), by Application 2024 & 2032
- Figure 62: Asia Pacific Protein Expression Market Volume Share (%), by Application 2024 & 2032
- Figure 63: Asia Pacific Protein Expression Market Revenue (Million), by End User 2024 & 2032
- Figure 64: Asia Pacific Protein Expression Market Volume (K Unit), by End User 2024 & 2032
- Figure 65: Asia Pacific Protein Expression Market Revenue Share (%), by End User 2024 & 2032
- Figure 66: Asia Pacific Protein Expression Market Volume Share (%), by End User 2024 & 2032
- Figure 67: Asia Pacific Protein Expression Market Revenue (Million), by Country 2024 & 2032
- Figure 68: Asia Pacific Protein Expression Market Volume (K Unit), by Country 2024 & 2032
- Figure 69: Asia Pacific Protein Expression Market Revenue Share (%), by Country 2024 & 2032
- Figure 70: Asia Pacific Protein Expression Market Volume Share (%), by Country 2024 & 2032
- Figure 71: Middle East and Africa Protein Expression Market Revenue (Million), by Product 2024 & 2032
- Figure 72: Middle East and Africa Protein Expression Market Volume (K Unit), by Product 2024 & 2032
- Figure 73: Middle East and Africa Protein Expression Market Revenue Share (%), by Product 2024 & 2032
- Figure 74: Middle East and Africa Protein Expression Market Volume Share (%), by Product 2024 & 2032
- Figure 75: Middle East and Africa Protein Expression Market Revenue (Million), by Application 2024 & 2032
- Figure 76: Middle East and Africa Protein Expression Market Volume (K Unit), by Application 2024 & 2032
- Figure 77: Middle East and Africa Protein Expression Market Revenue Share (%), by Application 2024 & 2032
- Figure 78: Middle East and Africa Protein Expression Market Volume Share (%), by Application 2024 & 2032
- Figure 79: Middle East and Africa Protein Expression Market Revenue (Million), by End User 2024 & 2032
- Figure 80: Middle East and Africa Protein Expression Market Volume (K Unit), by End User 2024 & 2032
- Figure 81: Middle East and Africa Protein Expression Market Revenue Share (%), by End User 2024 & 2032
- Figure 82: Middle East and Africa Protein Expression Market Volume Share (%), by End User 2024 & 2032
- Figure 83: Middle East and Africa Protein Expression Market Revenue (Million), by Country 2024 & 2032
- Figure 84: Middle East and Africa Protein Expression Market Volume (K Unit), by Country 2024 & 2032
- Figure 85: Middle East and Africa Protein Expression Market Revenue Share (%), by Country 2024 & 2032
- Figure 86: Middle East and Africa Protein Expression Market Volume Share (%), by Country 2024 & 2032
- Figure 87: South America Protein Expression Market Revenue (Million), by Product 2024 & 2032
- Figure 88: South America Protein Expression Market Volume (K Unit), by Product 2024 & 2032
- Figure 89: South America Protein Expression Market Revenue Share (%), by Product 2024 & 2032
- Figure 90: South America Protein Expression Market Volume Share (%), by Product 2024 & 2032
- Figure 91: South America Protein Expression Market Revenue (Million), by Application 2024 & 2032
- Figure 92: South America Protein Expression Market Volume (K Unit), by Application 2024 & 2032
- Figure 93: South America Protein Expression Market Revenue Share (%), by Application 2024 & 2032
- Figure 94: South America Protein Expression Market Volume Share (%), by Application 2024 & 2032
- Figure 95: South America Protein Expression Market Revenue (Million), by End User 2024 & 2032
- Figure 96: South America Protein Expression Market Volume (K Unit), by End User 2024 & 2032
- Figure 97: South America Protein Expression Market Revenue Share (%), by End User 2024 & 2032
- Figure 98: South America Protein Expression Market Volume Share (%), by End User 2024 & 2032
- Figure 99: South America Protein Expression Market Revenue (Million), by Country 2024 & 2032
- Figure 100: South America Protein Expression Market Volume (K Unit), by Country 2024 & 2032
- Figure 101: South America Protein Expression Market Revenue Share (%), by Country 2024 & 2032
- Figure 102: South America Protein Expression Market Volume Share (%), by Country 2024 & 2032
List of Tables
- Table 1: Global Protein Expression Market Revenue Million Forecast, by Region 2019 & 2032
- Table 2: Global Protein Expression Market Volume K Unit Forecast, by Region 2019 & 2032
- Table 3: Global Protein Expression Market Revenue Million Forecast, by Product 2019 & 2032
- Table 4: Global Protein Expression Market Volume K Unit Forecast, by Product 2019 & 2032
- Table 5: Global Protein Expression Market Revenue Million Forecast, by Application 2019 & 2032
- Table 6: Global Protein Expression Market Volume K Unit Forecast, by Application 2019 & 2032
- Table 7: Global Protein Expression Market Revenue Million Forecast, by End User 2019 & 2032
- Table 8: Global Protein Expression Market Volume K Unit Forecast, by End User 2019 & 2032
- Table 9: Global Protein Expression Market Revenue Million Forecast, by Region 2019 & 2032
- Table 10: Global Protein Expression Market Volume K Unit Forecast, by Region 2019 & 2032
- Table 11: Global Protein Expression Market Revenue Million Forecast, by Country 2019 & 2032
- Table 12: Global Protein Expression Market Volume K Unit Forecast, by Country 2019 & 2032
- Table 13: United States Protein Expression Market Revenue (Million) Forecast, by Application 2019 & 2032
- Table 14: United States Protein Expression Market Volume (K Unit) Forecast, by Application 2019 & 2032
- Table 15: Canada Protein Expression Market Revenue (Million) Forecast, by Application 2019 & 2032
- Table 16: Canada Protein Expression Market Volume (K Unit) Forecast, by Application 2019 & 2032
- Table 17: Mexico Protein Expression Market Revenue (Million) Forecast, by Application 2019 & 2032
- Table 18: Mexico Protein Expression Market Volume (K Unit) Forecast, by Application 2019 & 2032
- Table 19: Global Protein Expression Market Revenue Million Forecast, by Country 2019 & 2032
- Table 20: Global Protein Expression Market Volume K Unit Forecast, by Country 2019 & 2032
- Table 21: Germany Protein Expression Market Revenue (Million) Forecast, by Application 2019 & 2032
- Table 22: Germany Protein Expression Market Volume (K Unit) Forecast, by Application 2019 & 2032
- Table 23: United Kingdom Protein Expression Market Revenue (Million) Forecast, by Application 2019 & 2032
- Table 24: United Kingdom Protein Expression Market Volume (K Unit) Forecast, by Application 2019 & 2032
- Table 25: France Protein Expression Market Revenue (Million) Forecast, by Application 2019 & 2032
- Table 26: France Protein Expression Market Volume (K Unit) Forecast, by Application 2019 & 2032
- Table 27: Italy Protein Expression Market Revenue (Million) Forecast, by Application 2019 & 2032
- Table 28: Italy Protein Expression Market Volume (K Unit) Forecast, by Application 2019 & 2032
- Table 29: Spain Protein Expression Market Revenue (Million) Forecast, by Application 2019 & 2032
- Table 30: Spain Protein Expression Market Volume (K Unit) Forecast, by Application 2019 & 2032
- Table 31: Rest of Europe Protein Expression Market Revenue (Million) Forecast, by Application 2019 & 2032
- Table 32: Rest of Europe Protein Expression Market Volume (K Unit) Forecast, by Application 2019 & 2032
- Table 33: Global Protein Expression Market Revenue Million Forecast, by Country 2019 & 2032
- Table 34: Global Protein Expression Market Volume K Unit Forecast, by Country 2019 & 2032
- Table 35: China Protein Expression Market Revenue (Million) Forecast, by Application 2019 & 2032
- Table 36: China Protein Expression Market Volume (K Unit) Forecast, by Application 2019 & 2032
- Table 37: Japan Protein Expression Market Revenue (Million) Forecast, by Application 2019 & 2032
- Table 38: Japan Protein Expression Market Volume (K Unit) Forecast, by Application 2019 & 2032
- Table 39: India Protein Expression Market Revenue (Million) Forecast, by Application 2019 & 2032
- Table 40: India Protein Expression Market Volume (K Unit) Forecast, by Application 2019 & 2032
- Table 41: Australia Protein Expression Market Revenue (Million) Forecast, by Application 2019 & 2032
- Table 42: Australia Protein Expression Market Volume (K Unit) Forecast, by Application 2019 & 2032
- Table 43: South Korea Protein Expression Market Revenue (Million) Forecast, by Application 2019 & 2032
- Table 44: South Korea Protein Expression Market Volume (K Unit) Forecast, by Application 2019 & 2032
- Table 45: Rest of Asia Pacific Protein Expression Market Revenue (Million) Forecast, by Application 2019 & 2032
- Table 46: Rest of Asia Pacific Protein Expression Market Volume (K Unit) Forecast, by Application 2019 & 2032
- Table 47: Global Protein Expression Market Revenue Million Forecast, by Country 2019 & 2032
- Table 48: Global Protein Expression Market Volume K Unit Forecast, by Country 2019 & 2032
- Table 49: GCC Protein Expression Market Revenue (Million) Forecast, by Application 2019 & 2032
- Table 50: GCC Protein Expression Market Volume (K Unit) Forecast, by Application 2019 & 2032
- Table 51: South Africa Protein Expression Market Revenue (Million) Forecast, by Application 2019 & 2032
- Table 52: South Africa Protein Expression Market Volume (K Unit) Forecast, by Application 2019 & 2032
- Table 53: Rest of Middle East and Africa Protein Expression Market Revenue (Million) Forecast, by Application 2019 & 2032
- Table 54: Rest of Middle East and Africa Protein Expression Market Volume (K Unit) Forecast, by Application 2019 & 2032
- Table 55: Global Protein Expression Market Revenue Million Forecast, by Country 2019 & 2032
- Table 56: Global Protein Expression Market Volume K Unit Forecast, by Country 2019 & 2032
- Table 57: Brazil Protein Expression Market Revenue (Million) Forecast, by Application 2019 & 2032
- Table 58: Brazil Protein Expression Market Volume (K Unit) Forecast, by Application 2019 & 2032
- Table 59: Argentina Protein Expression Market Revenue (Million) Forecast, by Application 2019 & 2032
- Table 60: Argentina Protein Expression Market Volume (K Unit) Forecast, by Application 2019 & 2032
- Table 61: Rest of South America Protein Expression Market Revenue (Million) Forecast, by Application 2019 & 2032
- Table 62: Rest of South America Protein Expression Market Volume (K Unit) Forecast, by Application 2019 & 2032
- Table 63: Global Protein Expression Market Revenue Million Forecast, by Product 2019 & 2032
- Table 64: Global Protein Expression Market Volume K Unit Forecast, by Product 2019 & 2032
- Table 65: Global Protein Expression Market Revenue Million Forecast, by Application 2019 & 2032
- Table 66: Global Protein Expression Market Volume K Unit Forecast, by Application 2019 & 2032
- Table 67: Global Protein Expression Market Revenue Million Forecast, by End User 2019 & 2032
- Table 68: Global Protein Expression Market Volume K Unit Forecast, by End User 2019 & 2032
- Table 69: Global Protein Expression Market Revenue Million Forecast, by Country 2019 & 2032
- Table 70: Global Protein Expression Market Volume K Unit Forecast, by Country 2019 & 2032
- Table 71: United States Protein Expression Market Revenue (Million) Forecast, by Application 2019 & 2032
- Table 72: United States Protein Expression Market Volume (K Unit) Forecast, by Application 2019 & 2032
- Table 73: Canada Protein Expression Market Revenue (Million) Forecast, by Application 2019 & 2032
- Table 74: Canada Protein Expression Market Volume (K Unit) Forecast, by Application 2019 & 2032
- Table 75: Mexico Protein Expression Market Revenue (Million) Forecast, by Application 2019 & 2032
- Table 76: Mexico Protein Expression Market Volume (K Unit) Forecast, by Application 2019 & 2032
- Table 77: Global Protein Expression Market Revenue Million Forecast, by Product 2019 & 2032
- Table 78: Global Protein Expression Market Volume K Unit Forecast, by Product 2019 & 2032
- Table 79: Global Protein Expression Market Revenue Million Forecast, by Application 2019 & 2032
- Table 80: Global Protein Expression Market Volume K Unit Forecast, by Application 2019 & 2032
- Table 81: Global Protein Expression Market Revenue Million Forecast, by End User 2019 & 2032
- Table 82: Global Protein Expression Market Volume K Unit Forecast, by End User 2019 & 2032
- Table 83: Global Protein Expression Market Revenue Million Forecast, by Country 2019 & 2032
- Table 84: Global Protein Expression Market Volume K Unit Forecast, by Country 2019 & 2032
- Table 85: Germany Protein Expression Market Revenue (Million) Forecast, by Application 2019 & 2032
- Table 86: Germany Protein Expression Market Volume (K Unit) Forecast, by Application 2019 & 2032
- Table 87: United Kingdom Protein Expression Market Revenue (Million) Forecast, by Application 2019 & 2032
- Table 88: United Kingdom Protein Expression Market Volume (K Unit) Forecast, by Application 2019 & 2032
- Table 89: France Protein Expression Market Revenue (Million) Forecast, by Application 2019 & 2032
- Table 90: France Protein Expression Market Volume (K Unit) Forecast, by Application 2019 & 2032
- Table 91: Italy Protein Expression Market Revenue (Million) Forecast, by Application 2019 & 2032
- Table 92: Italy Protein Expression Market Volume (K Unit) Forecast, by Application 2019 & 2032
- Table 93: Spain Protein Expression Market Revenue (Million) Forecast, by Application 2019 & 2032
- Table 94: Spain Protein Expression Market Volume (K Unit) Forecast, by Application 2019 & 2032
- Table 95: Rest of Europe Protein Expression Market Revenue (Million) Forecast, by Application 2019 & 2032
- Table 96: Rest of Europe Protein Expression Market Volume (K Unit) Forecast, by Application 2019 & 2032
- Table 97: Global Protein Expression Market Revenue Million Forecast, by Product 2019 & 2032
- Table 98: Global Protein Expression Market Volume K Unit Forecast, by Product 2019 & 2032
- Table 99: Global Protein Expression Market Revenue Million Forecast, by Application 2019 & 2032
- Table 100: Global Protein Expression Market Volume K Unit Forecast, by Application 2019 & 2032
- Table 101: Global Protein Expression Market Revenue Million Forecast, by End User 2019 & 2032
- Table 102: Global Protein Expression Market Volume K Unit Forecast, by End User 2019 & 2032
- Table 103: Global Protein Expression Market Revenue Million Forecast, by Country 2019 & 2032
- Table 104: Global Protein Expression Market Volume K Unit Forecast, by Country 2019 & 2032
- Table 105: China Protein Expression Market Revenue (Million) Forecast, by Application 2019 & 2032
- Table 106: China Protein Expression Market Volume (K Unit) Forecast, by Application 2019 & 2032
- Table 107: Japan Protein Expression Market Revenue (Million) Forecast, by Application 2019 & 2032
- Table 108: Japan Protein Expression Market Volume (K Unit) Forecast, by Application 2019 & 2032
- Table 109: India Protein Expression Market Revenue (Million) Forecast, by Application 2019 & 2032
- Table 110: India Protein Expression Market Volume (K Unit) Forecast, by Application 2019 & 2032
- Table 111: Australia Protein Expression Market Revenue (Million) Forecast, by Application 2019 & 2032
- Table 112: Australia Protein Expression Market Volume (K Unit) Forecast, by Application 2019 & 2032
- Table 113: South Korea Protein Expression Market Revenue (Million) Forecast, by Application 2019 & 2032
- Table 114: South Korea Protein Expression Market Volume (K Unit) Forecast, by Application 2019 & 2032
- Table 115: Rest of Asia Pacific Protein Expression Market Revenue (Million) Forecast, by Application 2019 & 2032
- Table 116: Rest of Asia Pacific Protein Expression Market Volume (K Unit) Forecast, by Application 2019 & 2032
- Table 117: Global Protein Expression Market Revenue Million Forecast, by Product 2019 & 2032
- Table 118: Global Protein Expression Market Volume K Unit Forecast, by Product 2019 & 2032
- Table 119: Global Protein Expression Market Revenue Million Forecast, by Application 2019 & 2032
- Table 120: Global Protein Expression Market Volume K Unit Forecast, by Application 2019 & 2032
- Table 121: Global Protein Expression Market Revenue Million Forecast, by End User 2019 & 2032
- Table 122: Global Protein Expression Market Volume K Unit Forecast, by End User 2019 & 2032
- Table 123: Global Protein Expression Market Revenue Million Forecast, by Country 2019 & 2032
- Table 124: Global Protein Expression Market Volume K Unit Forecast, by Country 2019 & 2032
- Table 125: GCC Protein Expression Market Revenue (Million) Forecast, by Application 2019 & 2032
- Table 126: GCC Protein Expression Market Volume (K Unit) Forecast, by Application 2019 & 2032
- Table 127: South Africa Protein Expression Market Revenue (Million) Forecast, by Application 2019 & 2032
- Table 128: South Africa Protein Expression Market Volume (K Unit) Forecast, by Application 2019 & 2032
- Table 129: Rest of Middle East and Africa Protein Expression Market Revenue (Million) Forecast, by Application 2019 & 2032
- Table 130: Rest of Middle East and Africa Protein Expression Market Volume (K Unit) Forecast, by Application 2019 & 2032
- Table 131: Global Protein Expression Market Revenue Million Forecast, by Product 2019 & 2032
- Table 132: Global Protein Expression Market Volume K Unit Forecast, by Product 2019 & 2032
- Table 133: Global Protein Expression Market Revenue Million Forecast, by Application 2019 & 2032
- Table 134: Global Protein Expression Market Volume K Unit Forecast, by Application 2019 & 2032
- Table 135: Global Protein Expression Market Revenue Million Forecast, by End User 2019 & 2032
- Table 136: Global Protein Expression Market Volume K Unit Forecast, by End User 2019 & 2032
- Table 137: Global Protein Expression Market Revenue Million Forecast, by Country 2019 & 2032
- Table 138: Global Protein Expression Market Volume K Unit Forecast, by Country 2019 & 2032
- Table 139: Brazil Protein Expression Market Revenue (Million) Forecast, by Application 2019 & 2032
- Table 140: Brazil Protein Expression Market Volume (K Unit) Forecast, by Application 2019 & 2032
- Table 141: Argentina Protein Expression Market Revenue (Million) Forecast, by Application 2019 & 2032
- Table 142: Argentina Protein Expression Market Volume (K Unit) Forecast, by Application 2019 & 2032
- Table 143: Rest of South America Protein Expression Market Revenue (Million) Forecast, by Application 2019 & 2032
- Table 144: Rest of South America Protein Expression Market Volume (K Unit) Forecast, by Application 2019 & 2032
Frequently Asked Questions
1. What is the projected Compound Annual Growth Rate (CAGR) of the Protein Expression Market?
The projected CAGR is approximately 8.23%.
2. Which companies are prominent players in the Protein Expression Market?
Key companies in the market include Lonza Bioscience, Oxford Expression, Promega Corporation, Bio-Rad Laboratories Inc, Merck KGaA, Sino Biological Inc, Thermo Fisher Scientific Inc, Takara Bio Inc, Agilent Technologies Inc, New England Biolabs Inc, Qiagen NV, Synthetic Genomics Inc, Bioneer Corporation.
3. What are the main segments of the Protein Expression Market?
The market segments include Product, Application, End User.
4. Can you provide details about the market size?
The market size is estimated to be USD 2.88 Million as of 2022.
5. What are some drivers contributing to market growth?
Rising R&D Activity in the Pharmaceutical Sector; Escalation in the Biologics Market; Government Support for Proteomics and Genomics Research.
6. What are the notable trends driving market growth?
Cell-free Expression is Expected to Hold a Major Market Share in the Protein Expression Market.
7. Are there any restraints impacting market growth?
High Cost of Protein Expression Systems; Lack of Effective Systems for Post-translational Modifications.
8. Can you provide examples of recent developments in the market?
In September 2021, Aviva Systems Biology, one of the market leaders in antibodies, immunoassay kits, and recombinant proteins for life science research, launched its new Protein on Demand, a semi-custom recombinant protein portfolio for life scientists conducting basic research and preclinical studies.
9. What pricing options are available for accessing the report?
Pricing options include single-user, multi-user, and enterprise licenses priced at USD 4750, USD 5250, and USD 8750 respectively.
10. Is the market size provided in terms of value or volume?
The market size is provided in terms of value, measured in Million and volume, measured in K Unit.
11. Are there any specific market keywords associated with the report?
Yes, the market keyword associated with the report is "Protein Expression Market," which aids in identifying and referencing the specific market segment covered.
12. How do I determine which pricing option suits my needs best?
The pricing options vary based on user requirements and access needs. Individual users may opt for single-user licenses, while businesses requiring broader access may choose multi-user or enterprise licenses for cost-effective access to the report.
13. Are there any additional resources or data provided in the Protein Expression Market report?
While the report offers comprehensive insights, it's advisable to review the specific contents or supplementary materials provided to ascertain if additional resources or data are available.
14. How can I stay updated on further developments or reports in the Protein Expression Market?
To stay informed about further developments, trends, and reports in the Protein Expression Market, consider subscribing to industry newsletters, following relevant companies and organizations, or regularly checking reputable industry news sources and publications.
Methodology
Step 1 - Identification of Relevant Samples Size from Population Database


Step 2 - Approaches for Defining Global Market Size (Value, Volume* & Price*)

Note*: In applicable scenarios
Step 3 - Data Sources
Primary Research
- Web Analytics
- Survey Reports
- Research Institute
- Latest Research Reports
- Opinion Leaders
Secondary Research
- Annual Reports
- White Paper
- Latest Press Release
- Industry Association
- Paid Database
- Investor Presentations

Step 4 - Data Triangulation
Involves using different sources of information in order to increase the validity of a study
These sources are likely to be stakeholders in a program - participants, other researchers, program staff, other community members, and so on.
Then we put all data in single framework & apply various statistical tools to find out the dynamic on the market.
During the analysis stage, feedback from the stakeholder groups would be compared to determine areas of agreement as well as areas of divergence


