

Key Insights
The preclinical contract research organization (CRO) market, valued at $7.10 billion in 2025, is projected to experience robust growth, driven by the increasing demand for outsourced preclinical services from biopharmaceutical companies and research institutions. This surge is fueled by several factors: the escalating complexity of drug development, necessitating specialized expertise and infrastructure beyond the capabilities of many internal teams; the growing adoption of advanced preclinical models like Patient-Derived Organoids (PDOs) and Patient-Derived Xenografts (PDXs), offering more accurate and predictive results; and the rising prevalence of chronic diseases globally, stimulating greater investment in drug discovery and development. The market is segmented by service type (toxicology testing, bioanalysis, safety pharmacology, etc.), model type (PDO, PDX), and end-user (biopharmaceutical companies, research institutes, etc.). North America currently holds a significant market share, but Asia-Pacific is expected to witness the fastest growth, driven by expanding pharmaceutical industries and increasing government support for research and development.
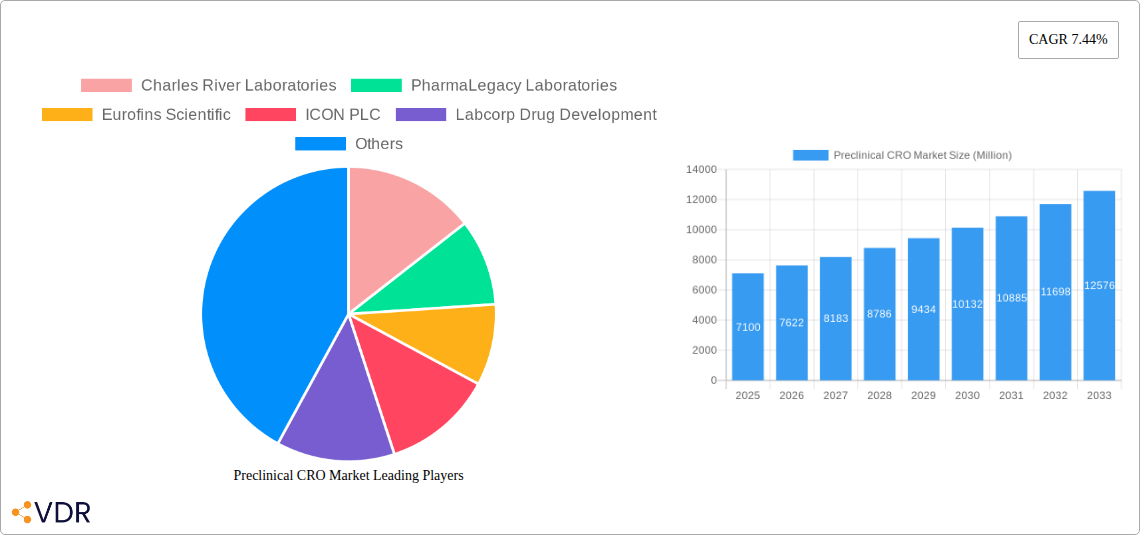
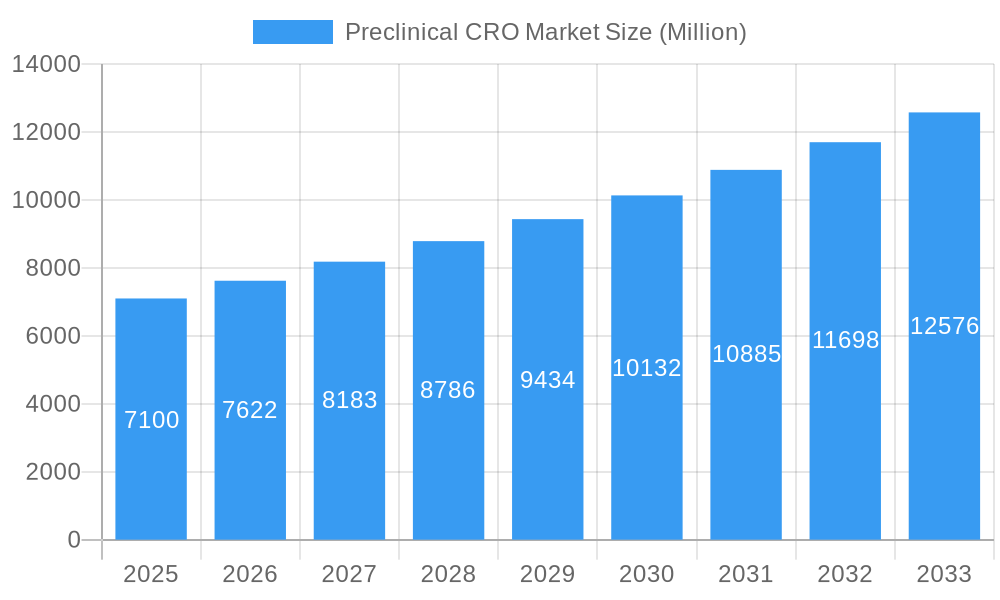
Preclinical CRO Market Market Size (In Billion)
Competition is intense, with major players like Charles River Laboratories, Eurofins Scientific, and Labcorp Drug Development vying for market share. However, the market also accommodates smaller, specialized CROs offering niche services or expertise in specific preclinical models. The market's growth trajectory is projected to continue over the forecast period (2025-2033), influenced by ongoing technological advancements (e.g., AI-driven drug discovery), increasing regulatory scrutiny demanding rigorous preclinical testing, and a growing focus on personalized medicine, further boosting the demand for sophisticated preclinical models. While cost constraints and the potential for regulatory changes pose some challenges, the overall outlook for the preclinical CRO market remains highly promising. The 7.44% CAGR suggests substantial expansion over the next decade, signifying lucrative opportunities for existing and emerging market participants.
Preclinical CRO Market Company Market Share
Preclinical CRO Market Report: 2019-2033
This comprehensive report provides an in-depth analysis of the Preclinical CRO market, encompassing market dynamics, growth trends, regional segmentation, product landscape, key players, and future outlook. With a study period spanning 2019-2033, a base year of 2025, and a forecast period of 2025-2033, this report is an invaluable resource for industry professionals, investors, and strategic decision-makers. The market is segmented by service, mode type, and end-user, providing granular insights into various market aspects. The total market value in 2025 is estimated at xx Million.
Preclinical CRO Market Market Dynamics & Structure
The Preclinical CRO market is characterized by moderate concentration, with a few large players holding significant market share. Technological advancements, particularly in areas like Patient Derived Organoid (PDO) and Patient Derived Xenograft (PDX) models, are driving market growth. Stringent regulatory frameworks influence operational procedures and compliance, creating both opportunities and challenges. The market faces competition from internal R&D departments of larger pharmaceutical companies, but the specialized expertise and cost-effectiveness of CROs sustain the market. Mergers and acquisitions (M&A) activities are frequent, shaping the competitive landscape. Over the historical period (2019-2024), approximately xx M&A deals were recorded, resulting in a xx% increase in market consolidation.
- Market Concentration: Moderately concentrated, with top 5 players holding approximately xx% market share in 2025.
- Technological Innovation: Rapid advancements in PDO/PDX models, AI-driven data analysis, and automation are key drivers.
- Regulatory Framework: Stringent GLP and GCP compliance requirements shape operational practices.
- Competitive Substitutes: Internal R&D capabilities of large pharmaceutical companies pose a competitive threat.
- End-User Demographics: Primarily driven by biopharmaceutical companies, with increasing contributions from research institutes.
- M&A Trends: High M&A activity leads to market consolidation and increased service offerings.
Preclinical CRO Market Growth Trends & Insights
The Preclinical CRO market experienced robust growth during the historical period (2019-2024), with a CAGR of xx%. This growth is attributed to increasing R&D spending by pharmaceutical companies, a growing pipeline of novel drugs, and the increasing adoption of preclinical CRO services for faster and more cost-effective drug development. The market penetration of PDO and PDX models is steadily increasing, driven by their ability to better mimic in vivo conditions. The shift towards personalized medicine is further fueling demand. The market is projected to maintain a healthy CAGR of xx% during the forecast period (2025-2033), reaching a projected value of xx Million by 2033. Technological disruptions, such as the integration of AI and automation, will continue to enhance efficiency and accelerate drug development timelines.
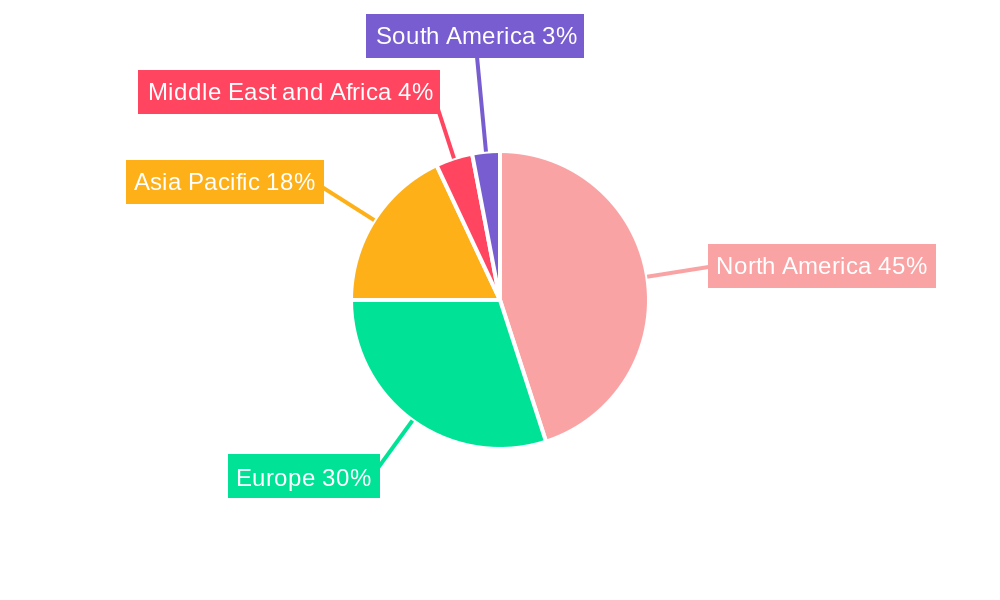
Dominant Regions, Countries, or Segments in Preclinical CRO Market
North America currently holds the largest market share in the Preclinical CRO market, driven by robust pharmaceutical R&D spending and a high concentration of biopharmaceutical companies. Europe follows as a significant market, fueled by strong regulatory frameworks and a growing biotechnology sector. Within services, Toxicology Testing holds the largest segment, followed by Bioanalysis and Drug Metabolism and Pharmacokinetics Studies. The Patient Derived Xenograft (PDX) Models segment is experiencing the fastest growth rate due to its superior predictive power compared to traditional models.
- Key Drivers in North America: High R&D investment, presence of major CRO players, stringent regulatory environment.
- Key Drivers in Europe: Well-established regulatory framework, presence of leading pharmaceutical and biotech companies.
- Segment Dominance: Toxicology Testing is the largest segment by revenue, while PDX models are experiencing the fastest growth.
- Growth Potential: Asia-Pacific region presents significant growth opportunities due to rising R&D investment and expanding pharmaceutical industries.
Preclinical CRO Market Product Landscape
The Preclinical CRO market offers a diverse range of services, encompassing toxicology testing, bioanalysis, pharmacokinetic and pharmacodynamic studies, safety pharmacology, and other specialized services. Recent innovations include the incorporation of advanced technologies such as AI and machine learning for data analysis, high-throughput screening platforms, and the development of more sophisticated in vitro and in vivo models including PDO and PDX. These advancements improve efficiency, accuracy, and reduce the time and cost associated with preclinical drug development. Unique selling propositions often revolve around specialized expertise in specific therapeutic areas, rapid turnaround times, and advanced analytical capabilities.
Key Drivers, Barriers & Challenges in Preclinical CRO Market
Key Drivers:
- Increased R&D spending by pharmaceutical and biotechnology companies.
- Rising demand for faster and cost-effective drug development processes.
- Growing adoption of advanced preclinical models (PDO/PDX).
- Stringent regulatory requirements driving outsourcing to specialized CROs.
Key Challenges:
- Intense competition among CRO providers.
- Maintaining high quality and data integrity across diverse services.
- Managing complex regulatory requirements and compliance.
- Supply chain disruptions affecting the availability of essential reagents and materials. (estimated impact of xx million in 2024)
Emerging Opportunities in Preclinical CRO Market
Emerging opportunities include the growing demand for personalized medicine, increased focus on immuno-oncology and cell therapy research, and the expansion into emerging markets. Further growth lies in the development of innovative preclinical models that better predict clinical outcomes and the integration of AI and big data analytics to optimize drug development strategies. Untapped markets in developing economies represent significant potential for market expansion.
Growth Accelerators in the Preclinical CRO Market Industry
Strategic partnerships between CROs and technology providers are accelerating growth by incorporating cutting-edge technologies into preclinical services. Technological breakthroughs in areas like AI and automation are improving efficiency, accuracy, and reducing costs, enhancing the overall market appeal. Expansion into new therapeutic areas like gene therapy and advanced biologics is driving demand for specialized CRO services.
Key Players Shaping the Preclinical CRO Market Market
- Charles River Laboratories
- PharmaLegacy Laboratories
- Eurofins Scientific
- ICON PLC
- Labcorp Drug Development
- NorthEast BioAnalytical Laboratories LLC
- SGS SA
- Altasciences Company Inc
- Parexel International Corporation
- WuXi AppTec
- Thermo Fisher Scientific Inc (Pharmaceutical Product Development (PPD))
- Medpace
Notable Milestones in Preclinical CRO Market Sector
- March 2023: GTP Bioways and Texcell partnered to offer comprehensive preclinical to clinical phase services. This collaboration expands service offerings and strengthens the competitive landscape.
- November 2023: CEBIS International expanded its preclinical and clinical trial services in North America and India, increasing market access and potentially impacting the competitive landscape in these regions.
In-Depth Preclinical CRO Market Market Outlook
The Preclinical CRO market is poised for sustained growth, driven by continuous technological advancements, increasing R&D investments, and the expanding need for efficient drug development strategies. Strategic partnerships, expansion into emerging markets, and a focus on innovative preclinical models will continue to shape the market's trajectory. The market's future potential lies in its ability to adapt to evolving scientific breakthroughs and regulatory demands, offering cost-effective, high-quality services to accelerate the drug development process.
Preclinical CRO Market Segmentation
-
1. Service
- 1.1. Toxicology Testing
- 1.2. Bioanaly
- 1.3. Safety Pharmacology
- 1.4. Other Services
-
2. Mode Type
- 2.1. Patient Derived Organoid (PDO) Models
- 2.2. Patient Derived Xenograft (PDX) Models
-
3. End Users
- 3.1. Biopharmaceutical Companies
- 3.2. Research Institutes and Universities
- 3.3. Other End Users
Preclinical CRO Market Segmentation By Geography
-
1. North America
- 1.1. United States
- 1.2. Canada
- 1.3. Mexico
-
2. Europe
- 2.1. Germany
- 2.2. United Kingdom
- 2.3. France
- 2.4. Italy
- 2.5. Spain
- 2.6. Rest of Europe
-
3. Asia Pacific
- 3.1. China
- 3.2. Japan
- 3.3. India
- 3.4. Australia
- 3.5. South Korea
- 3.6. Rest of Asia Pacific
-
4. Middle East and Africa
- 4.1. GCC
- 4.2. South Africa
- 4.3. Rest of Middle East and Africa
-
5. South America
- 5.1. Brazil
- 5.2. Argentina
- 5.3. Rest of South America
Preclinical CRO Market Regional Market Share
Geographic Coverage of Preclinical CRO Market
Preclinical CRO Market REPORT HIGHLIGHTS
| Aspects | Details |
|---|---|
| Study Period | 2020-2034 |
| Base Year | 2025 |
| Estimated Year | 2026 |
| Forecast Period | 2026-2034 |
| Historical Period | 2020-2025 |
| Growth Rate | CAGR of 7.56% from 2020-2034 |
| Segmentation |
|
Table of Contents
- 1. Introduction
- 1.1. Research Scope
- 1.2. Market Segmentation
- 1.3. Research Objective
- 1.4. Definitions and Assumptions
- 2. Executive Summary
- 2.1. Market Snapshot
- 3. Market Dynamics
- 3.1. Market Drivers
- 3.2. Market Restrains
- 3.3. Market Trends
- 3.4. Market Opportunities
- 4. Market Factor Analysis
- 4.1. Porters Five Forces
- 4.1.1. Bargaining Power of Suppliers
- 4.1.2. Bargaining Power of Buyers
- 4.1.3. Threat of New Entrants
- 4.1.4. Threat of Substitutes
- 4.1.5. Competitive Rivalry
- 4.2. PESTEL analysis
- 4.3. BCG Analysis
- 4.3.1. Stars (High Growth, High Market Share)
- 4.3.2. Cash Cows (Low Growth, High Market Share)
- 4.3.3. Question Mark (High Growth, Low Market Share)
- 4.3.4. Dogs (Low Growth, Low Market Share)
- 4.4. Ansoff Matrix Analysis
- 4.5. Supply Chain Analysis
- 4.6. Regulatory Landscape
- 4.7. Current Market Potential and Opportunity Assessment (TAM–SAM–SOM Framework)
- 4.8. VDR Analyst Note
- 4.1. Porters Five Forces
- 5. Market Analysis, Insights and Forecast 2021-2033
- 5.1. Market Analysis, Insights and Forecast - by Service
- 5.1.1. Toxicology Testing
- 5.1.2. Bioanaly
- 5.1.3. Safety Pharmacology
- 5.1.4. Other Services
- 5.2. Market Analysis, Insights and Forecast - by Mode Type
- 5.2.1. Patient Derived Organoid (PDO) Models
- 5.2.2. Patient Derived Xenograft (PDX) Models
- 5.3. Market Analysis, Insights and Forecast - by End Users
- 5.3.1. Biopharmaceutical Companies
- 5.3.2. Research Institutes and Universities
- 5.3.3. Other End Users
- 5.4. Market Analysis, Insights and Forecast - by Region
- 5.4.1. North America
- 5.4.2. Europe
- 5.4.3. Asia Pacific
- 5.4.4. Middle East and Africa
- 5.4.5. South America
- 5.1. Market Analysis, Insights and Forecast - by Service
- 6. Global Preclinical CRO Market Analysis, Insights and Forecast, 2021-2033
- 6.1. Market Analysis, Insights and Forecast - by Service
- 6.1.1. Toxicology Testing
- 6.1.2. Bioanaly
- 6.1.3. Safety Pharmacology
- 6.1.4. Other Services
- 6.2. Market Analysis, Insights and Forecast - by Mode Type
- 6.2.1. Patient Derived Organoid (PDO) Models
- 6.2.2. Patient Derived Xenograft (PDX) Models
- 6.3. Market Analysis, Insights and Forecast - by End Users
- 6.3.1. Biopharmaceutical Companies
- 6.3.2. Research Institutes and Universities
- 6.3.3. Other End Users
- 6.1. Market Analysis, Insights and Forecast - by Service
- 7. North America Preclinical CRO Market Analysis, Insights and Forecast, 2021-2033
- 7.1. Market Analysis, Insights and Forecast - by Service
- 7.1.1. Toxicology Testing
- 7.1.2. Bioanaly
- 7.1.3. Safety Pharmacology
- 7.1.4. Other Services
- 7.2. Market Analysis, Insights and Forecast - by Mode Type
- 7.2.1. Patient Derived Organoid (PDO) Models
- 7.2.2. Patient Derived Xenograft (PDX) Models
- 7.3. Market Analysis, Insights and Forecast - by End Users
- 7.3.1. Biopharmaceutical Companies
- 7.3.2. Research Institutes and Universities
- 7.3.3. Other End Users
- 7.1. Market Analysis, Insights and Forecast - by Service
- 8. Europe Preclinical CRO Market Analysis, Insights and Forecast, 2021-2033
- 8.1. Market Analysis, Insights and Forecast - by Service
- 8.1.1. Toxicology Testing
- 8.1.2. Bioanaly
- 8.1.3. Safety Pharmacology
- 8.1.4. Other Services
- 8.2. Market Analysis, Insights and Forecast - by Mode Type
- 8.2.1. Patient Derived Organoid (PDO) Models
- 8.2.2. Patient Derived Xenograft (PDX) Models
- 8.3. Market Analysis, Insights and Forecast - by End Users
- 8.3.1. Biopharmaceutical Companies
- 8.3.2. Research Institutes and Universities
- 8.3.3. Other End Users
- 8.1. Market Analysis, Insights and Forecast - by Service
- 9. Asia Pacific Preclinical CRO Market Analysis, Insights and Forecast, 2021-2033
- 9.1. Market Analysis, Insights and Forecast - by Service
- 9.1.1. Toxicology Testing
- 9.1.2. Bioanaly
- 9.1.3. Safety Pharmacology
- 9.1.4. Other Services
- 9.2. Market Analysis, Insights and Forecast - by Mode Type
- 9.2.1. Patient Derived Organoid (PDO) Models
- 9.2.2. Patient Derived Xenograft (PDX) Models
- 9.3. Market Analysis, Insights and Forecast - by End Users
- 9.3.1. Biopharmaceutical Companies
- 9.3.2. Research Institutes and Universities
- 9.3.3. Other End Users
- 9.1. Market Analysis, Insights and Forecast - by Service
- 10. Middle East and Africa Preclinical CRO Market Analysis, Insights and Forecast, 2021-2033
- 10.1. Market Analysis, Insights and Forecast - by Service
- 10.1.1. Toxicology Testing
- 10.1.2. Bioanaly
- 10.1.3. Safety Pharmacology
- 10.1.4. Other Services
- 10.2. Market Analysis, Insights and Forecast - by Mode Type
- 10.2.1. Patient Derived Organoid (PDO) Models
- 10.2.2. Patient Derived Xenograft (PDX) Models
- 10.3. Market Analysis, Insights and Forecast - by End Users
- 10.3.1. Biopharmaceutical Companies
- 10.3.2. Research Institutes and Universities
- 10.3.3. Other End Users
- 10.1. Market Analysis, Insights and Forecast - by Service
- 11. South America Preclinical CRO Market Analysis, Insights and Forecast, 2021-2033
- 11.1. Market Analysis, Insights and Forecast - by Service
- 11.1.1. Toxicology Testing
- 11.1.2. Bioanaly
- 11.1.3. Safety Pharmacology
- 11.1.4. Other Services
- 11.2. Market Analysis, Insights and Forecast - by Mode Type
- 11.2.1. Patient Derived Organoid (PDO) Models
- 11.2.2. Patient Derived Xenograft (PDX) Models
- 11.3. Market Analysis, Insights and Forecast - by End Users
- 11.3.1. Biopharmaceutical Companies
- 11.3.2. Research Institutes and Universities
- 11.3.3. Other End Users
- 11.1. Market Analysis, Insights and Forecast - by Service
- 12. Competitive Analysis
- 12.1. Company Profiles
- 12.1.1 Charles River Laboratories
- 12.1.1.1. Company Overview
- 12.1.1.2. Products
- 12.1.1.3. Company Financials
- 12.1.1.4. SWOT Analysis
- 12.1.2 PharmaLegacy Laboratories
- 12.1.2.1. Company Overview
- 12.1.2.2. Products
- 12.1.2.3. Company Financials
- 12.1.2.4. SWOT Analysis
- 12.1.3 Eurofins Scientific
- 12.1.3.1. Company Overview
- 12.1.3.2. Products
- 12.1.3.3. Company Financials
- 12.1.3.4. SWOT Analysis
- 12.1.4 ICON PLC
- 12.1.4.1. Company Overview
- 12.1.4.2. Products
- 12.1.4.3. Company Financials
- 12.1.4.4. SWOT Analysis
- 12.1.5 Labcorp Drug Development
- 12.1.5.1. Company Overview
- 12.1.5.2. Products
- 12.1.5.3. Company Financials
- 12.1.5.4. SWOT Analysis
- 12.1.6 NorthEast BioAnalytical Laboratories LLC
- 12.1.6.1. Company Overview
- 12.1.6.2. Products
- 12.1.6.3. Company Financials
- 12.1.6.4. SWOT Analysis
- 12.1.7 SGS SA
- 12.1.7.1. Company Overview
- 12.1.7.2. Products
- 12.1.7.3. Company Financials
- 12.1.7.4. SWOT Analysis
- 12.1.8 Altasciences Company Inc
- 12.1.8.1. Company Overview
- 12.1.8.2. Products
- 12.1.8.3. Company Financials
- 12.1.8.4. SWOT Analysis
- 12.1.9 Parexel International Corporation
- 12.1.9.1. Company Overview
- 12.1.9.2. Products
- 12.1.9.3. Company Financials
- 12.1.9.4. SWOT Analysis
- 12.1.10 WuXi App Tec
- 12.1.10.1. Company Overview
- 12.1.10.2. Products
- 12.1.10.3. Company Financials
- 12.1.10.4. SWOT Analysis
- 12.1.11 Thermo Fisher Scientific Inc (Pharmaceutical Product Development (PPD))
- 12.1.11.1. Company Overview
- 12.1.11.2. Products
- 12.1.11.3. Company Financials
- 12.1.11.4. SWOT Analysis
- 12.1.12 Medpace
- 12.1.12.1. Company Overview
- 12.1.12.2. Products
- 12.1.12.3. Company Financials
- 12.1.12.4. SWOT Analysis
- 12.1.1 Charles River Laboratories
- 12.2. Market Entropy
- 12.2.1 Company's Key Areas Served
- 12.2.2 Recent Developments
- 12.3. Company Market Share Analysis 2025
- 12.3.1 Top 5 Companies Market Share Analysis
- 12.3.2 Top 3 Companies Market Share Analysis
- 12.4. List of Potential Customers
- 13. Research Methodology
List of Figures
- Figure 1: Global Preclinical CRO Market Revenue Breakdown (billion, %) by Region 2025 & 2033
- Figure 2: North America Preclinical CRO Market Revenue (billion), by Service 2025 & 2033
- Figure 3: North America Preclinical CRO Market Revenue Share (%), by Service 2025 & 2033
- Figure 4: North America Preclinical CRO Market Revenue (billion), by Mode Type 2025 & 2033
- Figure 5: North America Preclinical CRO Market Revenue Share (%), by Mode Type 2025 & 2033
- Figure 6: North America Preclinical CRO Market Revenue (billion), by End Users 2025 & 2033
- Figure 7: North America Preclinical CRO Market Revenue Share (%), by End Users 2025 & 2033
- Figure 8: North America Preclinical CRO Market Revenue (billion), by Country 2025 & 2033
- Figure 9: North America Preclinical CRO Market Revenue Share (%), by Country 2025 & 2033
- Figure 10: Europe Preclinical CRO Market Revenue (billion), by Service 2025 & 2033
- Figure 11: Europe Preclinical CRO Market Revenue Share (%), by Service 2025 & 2033
- Figure 12: Europe Preclinical CRO Market Revenue (billion), by Mode Type 2025 & 2033
- Figure 13: Europe Preclinical CRO Market Revenue Share (%), by Mode Type 2025 & 2033
- Figure 14: Europe Preclinical CRO Market Revenue (billion), by End Users 2025 & 2033
- Figure 15: Europe Preclinical CRO Market Revenue Share (%), by End Users 2025 & 2033
- Figure 16: Europe Preclinical CRO Market Revenue (billion), by Country 2025 & 2033
- Figure 17: Europe Preclinical CRO Market Revenue Share (%), by Country 2025 & 2033
- Figure 18: Asia Pacific Preclinical CRO Market Revenue (billion), by Service 2025 & 2033
- Figure 19: Asia Pacific Preclinical CRO Market Revenue Share (%), by Service 2025 & 2033
- Figure 20: Asia Pacific Preclinical CRO Market Revenue (billion), by Mode Type 2025 & 2033
- Figure 21: Asia Pacific Preclinical CRO Market Revenue Share (%), by Mode Type 2025 & 2033
- Figure 22: Asia Pacific Preclinical CRO Market Revenue (billion), by End Users 2025 & 2033
- Figure 23: Asia Pacific Preclinical CRO Market Revenue Share (%), by End Users 2025 & 2033
- Figure 24: Asia Pacific Preclinical CRO Market Revenue (billion), by Country 2025 & 2033
- Figure 25: Asia Pacific Preclinical CRO Market Revenue Share (%), by Country 2025 & 2033
- Figure 26: Middle East and Africa Preclinical CRO Market Revenue (billion), by Service 2025 & 2033
- Figure 27: Middle East and Africa Preclinical CRO Market Revenue Share (%), by Service 2025 & 2033
- Figure 28: Middle East and Africa Preclinical CRO Market Revenue (billion), by Mode Type 2025 & 2033
- Figure 29: Middle East and Africa Preclinical CRO Market Revenue Share (%), by Mode Type 2025 & 2033
- Figure 30: Middle East and Africa Preclinical CRO Market Revenue (billion), by End Users 2025 & 2033
- Figure 31: Middle East and Africa Preclinical CRO Market Revenue Share (%), by End Users 2025 & 2033
- Figure 32: Middle East and Africa Preclinical CRO Market Revenue (billion), by Country 2025 & 2033
- Figure 33: Middle East and Africa Preclinical CRO Market Revenue Share (%), by Country 2025 & 2033
- Figure 34: South America Preclinical CRO Market Revenue (billion), by Service 2025 & 2033
- Figure 35: South America Preclinical CRO Market Revenue Share (%), by Service 2025 & 2033
- Figure 36: South America Preclinical CRO Market Revenue (billion), by Mode Type 2025 & 2033
- Figure 37: South America Preclinical CRO Market Revenue Share (%), by Mode Type 2025 & 2033
- Figure 38: South America Preclinical CRO Market Revenue (billion), by End Users 2025 & 2033
- Figure 39: South America Preclinical CRO Market Revenue Share (%), by End Users 2025 & 2033
- Figure 40: South America Preclinical CRO Market Revenue (billion), by Country 2025 & 2033
- Figure 41: South America Preclinical CRO Market Revenue Share (%), by Country 2025 & 2033
List of Tables
- Table 1: Global Preclinical CRO Market Revenue billion Forecast, by Service 2020 & 2033
- Table 2: Global Preclinical CRO Market Revenue billion Forecast, by Mode Type 2020 & 2033
- Table 3: Global Preclinical CRO Market Revenue billion Forecast, by End Users 2020 & 2033
- Table 4: Global Preclinical CRO Market Revenue billion Forecast, by Region 2020 & 2033
- Table 5: Global Preclinical CRO Market Revenue billion Forecast, by Service 2020 & 2033
- Table 6: Global Preclinical CRO Market Revenue billion Forecast, by Mode Type 2020 & 2033
- Table 7: Global Preclinical CRO Market Revenue billion Forecast, by End Users 2020 & 2033
- Table 8: Global Preclinical CRO Market Revenue billion Forecast, by Country 2020 & 2033
- Table 9: United States Preclinical CRO Market Revenue (billion) Forecast, by Application 2020 & 2033
- Table 10: Canada Preclinical CRO Market Revenue (billion) Forecast, by Application 2020 & 2033
- Table 11: Mexico Preclinical CRO Market Revenue (billion) Forecast, by Application 2020 & 2033
- Table 12: Global Preclinical CRO Market Revenue billion Forecast, by Service 2020 & 2033
- Table 13: Global Preclinical CRO Market Revenue billion Forecast, by Mode Type 2020 & 2033
- Table 14: Global Preclinical CRO Market Revenue billion Forecast, by End Users 2020 & 2033
- Table 15: Global Preclinical CRO Market Revenue billion Forecast, by Country 2020 & 2033
- Table 16: Germany Preclinical CRO Market Revenue (billion) Forecast, by Application 2020 & 2033
- Table 17: United Kingdom Preclinical CRO Market Revenue (billion) Forecast, by Application 2020 & 2033
- Table 18: France Preclinical CRO Market Revenue (billion) Forecast, by Application 2020 & 2033
- Table 19: Italy Preclinical CRO Market Revenue (billion) Forecast, by Application 2020 & 2033
- Table 20: Spain Preclinical CRO Market Revenue (billion) Forecast, by Application 2020 & 2033
- Table 21: Rest of Europe Preclinical CRO Market Revenue (billion) Forecast, by Application 2020 & 2033
- Table 22: Global Preclinical CRO Market Revenue billion Forecast, by Service 2020 & 2033
- Table 23: Global Preclinical CRO Market Revenue billion Forecast, by Mode Type 2020 & 2033
- Table 24: Global Preclinical CRO Market Revenue billion Forecast, by End Users 2020 & 2033
- Table 25: Global Preclinical CRO Market Revenue billion Forecast, by Country 2020 & 2033
- Table 26: China Preclinical CRO Market Revenue (billion) Forecast, by Application 2020 & 2033
- Table 27: Japan Preclinical CRO Market Revenue (billion) Forecast, by Application 2020 & 2033
- Table 28: India Preclinical CRO Market Revenue (billion) Forecast, by Application 2020 & 2033
- Table 29: Australia Preclinical CRO Market Revenue (billion) Forecast, by Application 2020 & 2033
- Table 30: South Korea Preclinical CRO Market Revenue (billion) Forecast, by Application 2020 & 2033
- Table 31: Rest of Asia Pacific Preclinical CRO Market Revenue (billion) Forecast, by Application 2020 & 2033
- Table 32: Global Preclinical CRO Market Revenue billion Forecast, by Service 2020 & 2033
- Table 33: Global Preclinical CRO Market Revenue billion Forecast, by Mode Type 2020 & 2033
- Table 34: Global Preclinical CRO Market Revenue billion Forecast, by End Users 2020 & 2033
- Table 35: Global Preclinical CRO Market Revenue billion Forecast, by Country 2020 & 2033
- Table 36: GCC Preclinical CRO Market Revenue (billion) Forecast, by Application 2020 & 2033
- Table 37: South Africa Preclinical CRO Market Revenue (billion) Forecast, by Application 2020 & 2033
- Table 38: Rest of Middle East and Africa Preclinical CRO Market Revenue (billion) Forecast, by Application 2020 & 2033
- Table 39: Global Preclinical CRO Market Revenue billion Forecast, by Service 2020 & 2033
- Table 40: Global Preclinical CRO Market Revenue billion Forecast, by Mode Type 2020 & 2033
- Table 41: Global Preclinical CRO Market Revenue billion Forecast, by End Users 2020 & 2033
- Table 42: Global Preclinical CRO Market Revenue billion Forecast, by Country 2020 & 2033
- Table 43: Brazil Preclinical CRO Market Revenue (billion) Forecast, by Application 2020 & 2033
- Table 44: Argentina Preclinical CRO Market Revenue (billion) Forecast, by Application 2020 & 2033
- Table 45: Rest of South America Preclinical CRO Market Revenue (billion) Forecast, by Application 2020 & 2033
Frequently Asked Questions
1. What is the projected Compound Annual Growth Rate (CAGR) of the Preclinical CRO Market?
The projected CAGR is approximately 7.56%.
2. Which companies are prominent players in the Preclinical CRO Market?
Key companies in the market include Charles River Laboratories, PharmaLegacy Laboratories, Eurofins Scientific, ICON PLC, Labcorp Drug Development, NorthEast BioAnalytical Laboratories LLC, SGS SA, Altasciences Company Inc, Parexel International Corporation, WuXi App Tec, Thermo Fisher Scientific Inc (Pharmaceutical Product Development (PPD)), Medpace.
3. What are the main segments of the Preclinical CRO Market?
The market segments include Service, Mode Type, End Users.
4. Can you provide details about the market size?
The market size is estimated to be USD 6.76 billion as of 2022.
5. What are some drivers contributing to market growth?
Increasing Research and Development (R&D) Expenditure Worldwide; Increase in Number of Drugs in Preclinical Trials; High Demand for Medicines Uptake by Chronically Ill Patients.
6. What are the notable trends driving market growth?
The Toxicology Testing Segment is Predicted to Witness Significant Growth Between 2024 and 2029.
7. Are there any restraints impacting market growth?
Lack of Standardization and Monitoring Issue; Stringent Regulatory Policies.
8. Can you provide examples of recent developments in the market?
March 2023: GTP Bioways, a contract development and manufacturing organization (CDMO) dedicated to biotherapeutics manufacturing, and Texcell, a contract research organization (CRO) specialized in viral safety, assay development, and GMP banking, partnered to provide comprehensive pre-clinical to clinal phases services to biopharmaceutical companies.
9. What pricing options are available for accessing the report?
Pricing options include single-user, multi-user, and enterprise licenses priced at USD 4750, USD 5250, and USD 8750 respectively.
10. Is the market size provided in terms of value or volume?
The market size is provided in terms of value, measured in billion.
11. Are there any specific market keywords associated with the report?
Yes, the market keyword associated with the report is "Preclinical CRO Market," which aids in identifying and referencing the specific market segment covered.
12. How do I determine which pricing option suits my needs best?
The pricing options vary based on user requirements and access needs. Individual users may opt for single-user licenses, while businesses requiring broader access may choose multi-user or enterprise licenses for cost-effective access to the report.
13. Are there any additional resources or data provided in the Preclinical CRO Market report?
While the report offers comprehensive insights, it's advisable to review the specific contents or supplementary materials provided to ascertain if additional resources or data are available.
14. How can I stay updated on further developments or reports in the Preclinical CRO Market?
To stay informed about further developments, trends, and reports in the Preclinical CRO Market, consider subscribing to industry newsletters, following relevant companies and organizations, or regularly checking reputable industry news sources and publications.
Methodology
Step 1 - Identification of Relevant Samples Size from Population Database


Step 2 - Approaches for Defining Global Market Size (Value, Volume* & Price*)

Note*: In applicable scenarios
Step 3 - Data Sources
Primary Research
- Web Analytics
- Survey Reports
- Research Institute
- Latest Research Reports
- Opinion Leaders
Secondary Research
- Annual Reports
- White Paper
- Latest Press Release
- Industry Association
- Paid Database
- Investor Presentations

Step 4 - Data Triangulation
Involves using different sources of information in order to increase the validity of a study
These sources are likely to be stakeholders in a program - participants, other researchers, program staff, other community members, and so on.
Then we put all data in single framework & apply various statistical tools to find out the dynamic on the market.
During the analysis stage, feedback from the stakeholder groups would be compared to determine areas of agreement as well as areas of divergence