
Key Insights
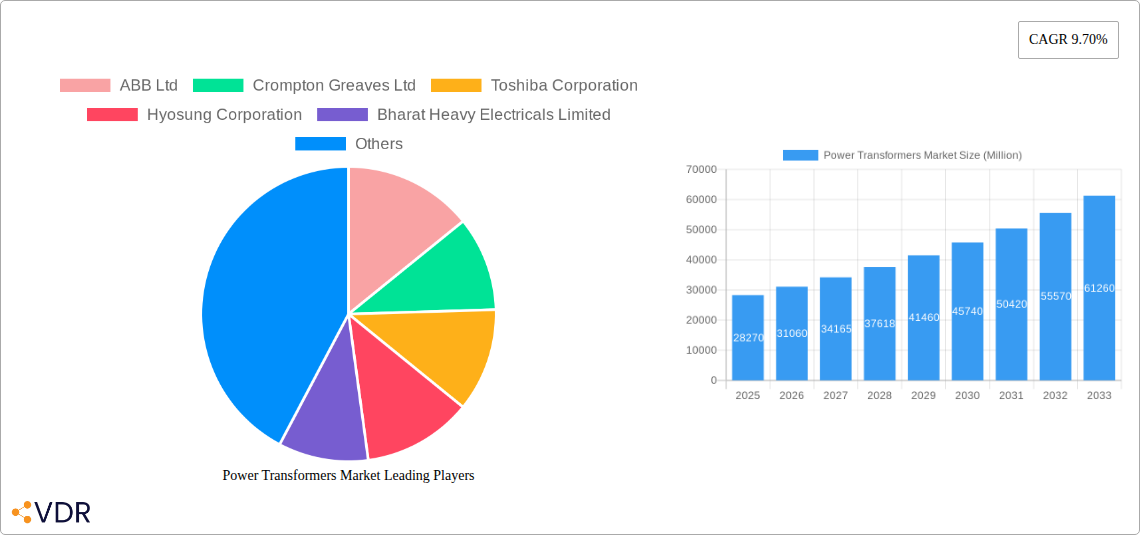
The global power transformers market, valued at $28.27 billion in 2025, is projected to experience robust growth, driven by the increasing demand for electricity across residential, commercial, and industrial sectors. This expansion is fueled by the global energy transition, necessitating upgrades to aging infrastructure and the integration of renewable energy sources like solar and wind power. The market is segmented by transformer size (large, medium, and small), reflecting diverse applications ranging from high-voltage transmission networks to localized distribution. Key players like ABB, Siemens, and GE are actively investing in research and development to improve transformer efficiency, reliability, and sustainability, contributing to the market's growth trajectory. Technological advancements, such as the adoption of smart grid technologies and digitalization initiatives within power utilities, are further stimulating demand for advanced power transformers with enhanced monitoring and control capabilities. Regional variations in market growth are expected, with Asia-Pacific and North America leading the expansion due to robust economic growth and ongoing infrastructure development projects.
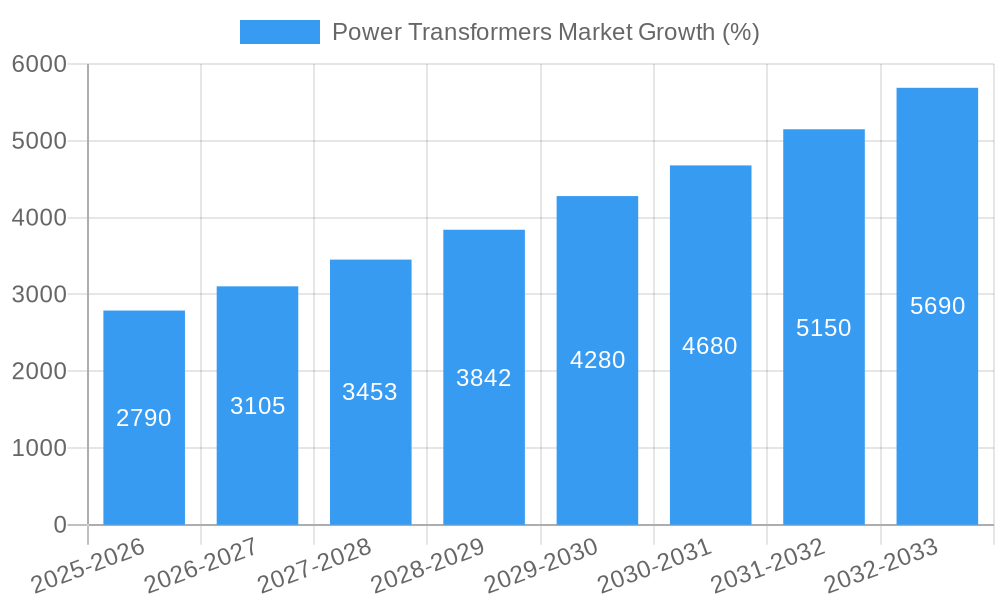
However, the market faces certain challenges. The high initial investment costs associated with power transformer procurement and installation can act as a restraint, particularly for smaller utilities and developing economies. Furthermore, fluctuating raw material prices, particularly for copper and steel, can impact manufacturing costs and profitability. Stringent environmental regulations regarding transformer disposal and the need for environmentally friendly materials are also shaping the industry landscape, encouraging manufacturers to focus on sustainable solutions. Competitive pressures from emerging players in Asia are also influencing market dynamics. Despite these challenges, the long-term outlook for the power transformers market remains positive, driven by the sustained need for reliable and efficient power transmission and distribution globally. The consistent CAGR of 9.70% indicates a substantial expansion throughout the forecast period (2025-2033).
This in-depth report provides a comprehensive analysis of the global Power Transformers Market, encompassing market dynamics, growth trends, regional dominance, product landscape, key players, and future outlook. The study period covers 2019-2033, with 2025 as the base and estimated year. This report is invaluable for industry professionals, investors, and strategic decision-makers seeking to navigate the complexities of this crucial sector. The market is segmented by size into Large, Medium, and Small Power Transformers, offering granular insights into each segment's performance and growth trajectory.
Power Transformers Market Dynamics & Structure
The Power Transformers market is characterized by a moderately concentrated landscape with several major players competing fiercely. Market concentration is influenced by factors like technological advancements, economies of scale, and geographic reach. The market is witnessing significant technological innovation driven by the need for higher efficiency, improved reliability, and smart grid integration. Stringent regulatory frameworks focused on energy efficiency and environmental concerns are reshaping the market, pushing manufacturers towards adopting sustainable materials and designs. Furthermore, competitive pressure from product substitutes, such as high-voltage direct current (HVDC) transmission, and the evolving end-user demographics are shaping market dynamics. Mergers and acquisitions (M&A) activity plays a significant role in consolidating market share and accelerating innovation.
- Market Concentration: Moderately concentrated, with top 10 players holding approximately xx% market share in 2025.
- Technological Innovation: Focus on smart grid integration, higher efficiency designs (amorphous steel cores), and digitalization.
- Regulatory Framework: Increasing emphasis on energy efficiency standards, leading to higher adoption of advanced technologies.
- Competitive Substitutes: HVDC transmission poses a competitive threat, impacting the growth of traditional AC power transformers.
- M&A Activity: Average of xx M&A deals per year observed during the historical period (2019-2024), indicating significant consolidation.
- Innovation Barriers: High R&D investment requirements, stringent regulatory approvals, and long lead times for product development and deployment.
Power Transformers Market Growth Trends & Insights
The global Power Transformers market experienced robust growth during the historical period (2019-2024), driven by factors such as expanding electricity infrastructure, particularly in developing economies, and increasing demand from renewable energy sources. The market is projected to maintain its growth momentum during the forecast period (2025-2033), although at a potentially moderated rate. Technological disruptions, including the adoption of smart grid technologies and digitalization, are influencing market evolution. Consumer behavior shifts, with an increasing preference for energy-efficient solutions, are further shaping demand.
- Market Size Evolution: The market size expanded from xx million units in 2019 to xx million units in 2024, exhibiting a CAGR of xx%.
- Adoption Rates: Adoption of advanced technologies such as amorphous core transformers is increasing gradually, driven by stringent energy efficiency standards.
- Technological Disruptions: Smart grid integration and the rise of renewable energy sources are driving significant technological changes within the Power Transformers market.
- Consumer Behavior Shifts: Growing emphasis on energy efficiency and sustainability is pushing adoption of eco-friendly designs and materials.
Dominant Regions, Countries, or Segments in Power Transformers Market
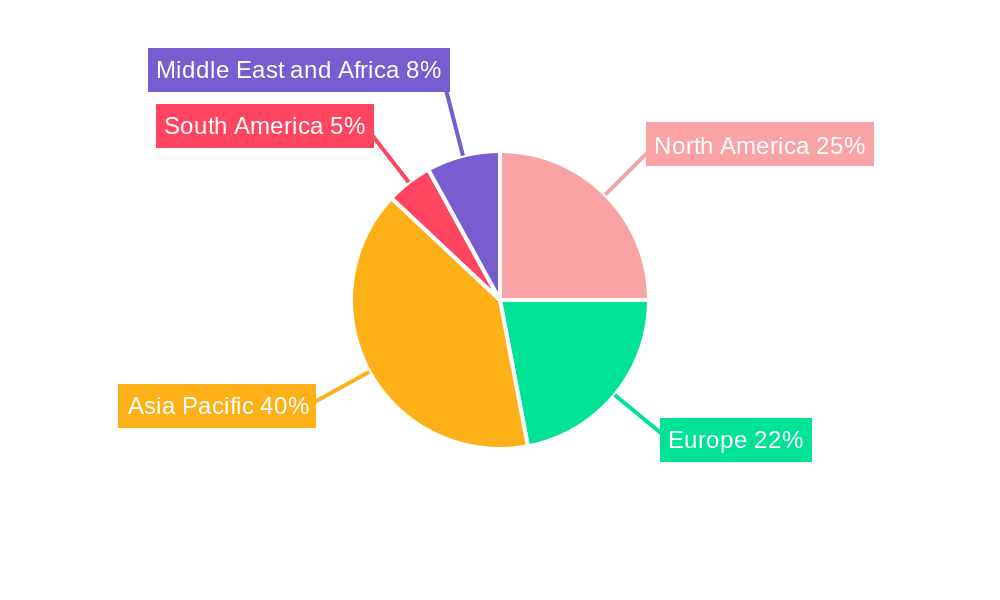
Asia-Pacific, particularly China and India, dominates the Power Transformers market, fueled by rapid infrastructure development and increasing electricity demand. Europe and North America are also significant markets, driven by ongoing grid modernization and renewable energy integration projects. Among the segment sizes, Large Power Transformers holds the largest market share due to their critical role in high-capacity power transmission.
- Key Drivers (Asia-Pacific): Rapid urbanization, industrialization, and government investments in power infrastructure.
- Key Drivers (Europe & North America): Grid modernization initiatives, investments in renewable energy, and increasing focus on grid reliability.
- Large Power Transformers Dominance: Highest market share due to their use in high-capacity transmission lines.
- Market Share & Growth Potential: Asia-Pacific dominates with approximately xx% market share in 2025. Significant growth potential exists in developing economies of Africa and South America.
Power Transformers Market Product Landscape
Power transformers are witnessing continuous innovation, with advancements in materials science leading to improved efficiency, durability, and reduced environmental impact. The adoption of amorphous steel cores, for example, significantly improves energy efficiency compared to traditional grain-oriented steel cores. New designs are also focusing on enhanced reliability, reduced maintenance requirements, and improved thermal management. These innovations, along with the use of advanced cooling systems, are extending the lifespan of power transformers and minimizing operational costs.
Key Drivers, Barriers & Challenges in Power Transformers Market
Key Drivers:
- Increasing global electricity demand.
- Expansion of renewable energy sources (solar, wind).
- Smart grid initiatives and modernization of existing grids.
- Growing adoption of electric vehicles.
- Stringent government regulations promoting energy efficiency.
Challenges & Restraints:
- High initial investment costs associated with advanced technologies.
- Fluctuations in raw material prices (e.g., copper, steel).
- Supply chain disruptions impacting lead times and production costs.
- Stringent regulatory compliance requirements.
- Intense competition among established players.
Emerging Opportunities in Power Transformers Market
- Untapped markets in developing economies.
- Growing demand for transformers with increased capacity and efficiency.
- Integration of smart grid technologies and digitalization.
- Opportunities in HVDC transmission systems.
- Development of eco-friendly and sustainable transformer designs.
Growth Accelerators in the Power Transformers Market Industry
Technological breakthroughs in materials science and cooling systems are enhancing power transformer efficiency and longevity. Strategic partnerships between manufacturers and utility companies are facilitating the adoption of advanced technologies. The expansion into new geographic markets, particularly in developing economies, is driving further growth, while sustained investments in research and development are expected to fuel continuous innovation within the sector.
Key Players Shaping the Power Transformers Market Market
- ABB Ltd
- Crompton Greaves Ltd
- Toshiba Corporation
- Hyosung Corporation
- Bharat Heavy Electricals Limited
- Mitsubishi Electric Corporation
- Siemens AG
- SPX Transformer Solutions Inc
- Hyundai Heavy Industries Co Ltd
- JiangSu HuaPeng Transformer Co Ltd
- General Electric Company
Notable Milestones in Power Transformers Market Sector
- August 2023: The US Department of Energy (DOE) announced USD 20 million to support energy-efficient distribution transformers.
- June 2023: The DOE proposed new energy-efficiency standards for distribution transformers, potentially costing the industry USD 342.1 million in conversion costs by 2027.
In-Depth Power Transformers Market Market Outlook
The Power Transformers market is poised for sustained growth over the forecast period, driven by the factors outlined above. Strategic investments in research and development, alongside collaborations to foster innovation, are expected to drive significant advancements in efficiency, reliability, and sustainability. The ongoing modernization of power grids globally and increasing demand for renewable energy integration presents considerable opportunities for growth and expansion within this critical sector.
Power Transformers Market Segmentation
-
1. Size
- 1.1. Large Power Transformer
- 1.2. Medium Power Transformer
- 1.3. Small Power Transformer
Power Transformers Market Segmentation By Geography
-
1. North America
- 1.1. United States
- 1.2. Canada
- 1.3. Mexico
-
2. Asia Pacific
- 2.1. China
- 2.2. India
- 2.3. Japan
- 2.4. South Korea
- 2.5. Rest of Asia Pacific
-
3. Europe
- 3.1. Germany
- 3.2. United Kingdom
- 3.3. Spain
- 3.4. Italy
- 3.5. Rest of Europe
-
4. South America
- 4.1. Brazil
- 4.2. Argentina
- 4.3. Rest of South America
-
5. Middle East and Africa
- 5.1. Saudi Arabia
- 5.2. United Arab Emirates
- 5.3. South Africa
- 5.4. Rest of Middle East and Africa
Power Transformers Market REPORT HIGHLIGHTS
| Aspects | Details |
|---|---|
| Study Period | 2019-2033 |
| Base Year | 2024 |
| Estimated Year | 2025 |
| Forecast Period | 2025-2033 |
| Historical Period | 2019-2024 |
| Growth Rate | CAGR of 9.70% from 2019-2033 |
| Segmentation |
|
Table of Contents
- 1. Introduction
- 1.1. Research Scope
- 1.2. Market Segmentation
- 1.3. Research Methodology
- 1.4. Definitions and Assumptions
- 2. Executive Summary
- 2.1. Introduction
- 3. Market Dynamics
- 3.1. Introduction
- 3.2. Market Drivers
- 3.2.1. 4.; Increasing Integration Of Renewable Energy Generation4.; Aging Power Grids And Investments In Transmission And Distribution Infrastructure
- 3.3. Market Restrains
- 3.3.1. 4.; Lack Of Investor Confidence Due To Sociopolitical Instability In Some Countries
- 3.4. Market Trends
- 3.4.1. Large Power Transformers Segment to Witness Significant Growth
- 4. Market Factor Analysis
- 4.1. Porters Five Forces
- 4.2. Supply/Value Chain
- 4.3. PESTEL analysis
- 4.4. Market Entropy
- 4.5. Patent/Trademark Analysis
- 5. Global Power Transformers Market Analysis, Insights and Forecast, 2019-2031
- 5.1. Market Analysis, Insights and Forecast - by Size
- 5.1.1. Large Power Transformer
- 5.1.2. Medium Power Transformer
- 5.1.3. Small Power Transformer
- 5.2. Market Analysis, Insights and Forecast - by Region
- 5.2.1. North America
- 5.2.2. Asia Pacific
- 5.2.3. Europe
- 5.2.4. South America
- 5.2.5. Middle East and Africa
- 5.1. Market Analysis, Insights and Forecast - by Size
- 6. North America Power Transformers Market Analysis, Insights and Forecast, 2019-2031
- 6.1. Market Analysis, Insights and Forecast - by Size
- 6.1.1. Large Power Transformer
- 6.1.2. Medium Power Transformer
- 6.1.3. Small Power Transformer
- 6.1. Market Analysis, Insights and Forecast - by Size
- 7. Asia Pacific Power Transformers Market Analysis, Insights and Forecast, 2019-2031
- 7.1. Market Analysis, Insights and Forecast - by Size
- 7.1.1. Large Power Transformer
- 7.1.2. Medium Power Transformer
- 7.1.3. Small Power Transformer
- 7.1. Market Analysis, Insights and Forecast - by Size
- 8. Europe Power Transformers Market Analysis, Insights and Forecast, 2019-2031
- 8.1. Market Analysis, Insights and Forecast - by Size
- 8.1.1. Large Power Transformer
- 8.1.2. Medium Power Transformer
- 8.1.3. Small Power Transformer
- 8.1. Market Analysis, Insights and Forecast - by Size
- 9. South America Power Transformers Market Analysis, Insights and Forecast, 2019-2031
- 9.1. Market Analysis, Insights and Forecast - by Size
- 9.1.1. Large Power Transformer
- 9.1.2. Medium Power Transformer
- 9.1.3. Small Power Transformer
- 9.1. Market Analysis, Insights and Forecast - by Size
- 10. Middle East and Africa Power Transformers Market Analysis, Insights and Forecast, 2019-2031
- 10.1. Market Analysis, Insights and Forecast - by Size
- 10.1.1. Large Power Transformer
- 10.1.2. Medium Power Transformer
- 10.1.3. Small Power Transformer
- 10.1. Market Analysis, Insights and Forecast - by Size
- 11. North America Power Transformers Market Analysis, Insights and Forecast, 2019-2031
- 11.1. Market Analysis, Insights and Forecast - By Country/Sub-region
- 11.1.1 United States
- 11.1.2 Canada
- 11.1.3 Mexico
- 12. Asia Pacific Power Transformers Market Analysis, Insights and Forecast, 2019-2031
- 12.1. Market Analysis, Insights and Forecast - By Country/Sub-region
- 12.1.1 China
- 12.1.2 India
- 12.1.3 Japan
- 12.1.4 South Korea
- 12.1.5 Rest of Asia Pacific
- 13. Europe Power Transformers Market Analysis, Insights and Forecast, 2019-2031
- 13.1. Market Analysis, Insights and Forecast - By Country/Sub-region
- 13.1.1 Germany
- 13.1.2 United Kingdom
- 13.1.3 Spain
- 13.1.4 Italy
- 13.1.5 Rest of Europe
- 14. South America Power Transformers Market Analysis, Insights and Forecast, 2019-2031
- 14.1. Market Analysis, Insights and Forecast - By Country/Sub-region
- 14.1.1 Brazil
- 14.1.2 Argentina
- 14.1.3 Rest of South America
- 15. Middle East and Africa Power Transformers Market Analysis, Insights and Forecast, 2019-2031
- 15.1. Market Analysis, Insights and Forecast - By Country/Sub-region
- 15.1.1 Saudi Arabia
- 15.1.2 United Arab Emirates
- 15.1.3 South Africa
- 15.1.4 Rest of Middle East and Africa
- 16. Competitive Analysis
- 16.1. Global Market Share Analysis 2024
- 16.2. Company Profiles
- 16.2.1 ABB Ltd
- 16.2.1.1. Overview
- 16.2.1.2. Products
- 16.2.1.3. SWOT Analysis
- 16.2.1.4. Recent Developments
- 16.2.1.5. Financials (Based on Availability)
- 16.2.2 Crompton Greaves Ltd
- 16.2.2.1. Overview
- 16.2.2.2. Products
- 16.2.2.3. SWOT Analysis
- 16.2.2.4. Recent Developments
- 16.2.2.5. Financials (Based on Availability)
- 16.2.3 Toshiba Corporation
- 16.2.3.1. Overview
- 16.2.3.2. Products
- 16.2.3.3. SWOT Analysis
- 16.2.3.4. Recent Developments
- 16.2.3.5. Financials (Based on Availability)
- 16.2.4 Hyosung Corporation
- 16.2.4.1. Overview
- 16.2.4.2. Products
- 16.2.4.3. SWOT Analysis
- 16.2.4.4. Recent Developments
- 16.2.4.5. Financials (Based on Availability)
- 16.2.5 Bharat Heavy Electricals Limited
- 16.2.5.1. Overview
- 16.2.5.2. Products
- 16.2.5.3. SWOT Analysis
- 16.2.5.4. Recent Developments
- 16.2.5.5. Financials (Based on Availability)
- 16.2.6 Mitsubishi Electric Corporation
- 16.2.6.1. Overview
- 16.2.6.2. Products
- 16.2.6.3. SWOT Analysis
- 16.2.6.4. Recent Developments
- 16.2.6.5. Financials (Based on Availability)
- 16.2.7 Siemens AG
- 16.2.7.1. Overview
- 16.2.7.2. Products
- 16.2.7.3. SWOT Analysis
- 16.2.7.4. Recent Developments
- 16.2.7.5. Financials (Based on Availability)
- 16.2.8 SPX Transformer Solutions Inc
- 16.2.8.1. Overview
- 16.2.8.2. Products
- 16.2.8.3. SWOT Analysis
- 16.2.8.4. Recent Developments
- 16.2.8.5. Financials (Based on Availability)
- 16.2.9 Hyundai Heavy Industries Co Ltd
- 16.2.9.1. Overview
- 16.2.9.2. Products
- 16.2.9.3. SWOT Analysis
- 16.2.9.4. Recent Developments
- 16.2.9.5. Financials (Based on Availability)
- 16.2.10 JiangSu HuaPeng Transformer Co Ltd*List Not Exhaustive
- 16.2.10.1. Overview
- 16.2.10.2. Products
- 16.2.10.3. SWOT Analysis
- 16.2.10.4. Recent Developments
- 16.2.10.5. Financials (Based on Availability)
- 16.2.11 General Electric Company
- 16.2.11.1. Overview
- 16.2.11.2. Products
- 16.2.11.3. SWOT Analysis
- 16.2.11.4. Recent Developments
- 16.2.11.5. Financials (Based on Availability)
- 16.2.1 ABB Ltd
List of Figures
- Figure 1: Global Power Transformers Market Revenue Breakdown (Million, %) by Region 2024 & 2032
- Figure 2: North America Power Transformers Market Revenue (Million), by Country 2024 & 2032
- Figure 3: North America Power Transformers Market Revenue Share (%), by Country 2024 & 2032
- Figure 4: Asia Pacific Power Transformers Market Revenue (Million), by Country 2024 & 2032
- Figure 5: Asia Pacific Power Transformers Market Revenue Share (%), by Country 2024 & 2032
- Figure 6: Europe Power Transformers Market Revenue (Million), by Country 2024 & 2032
- Figure 7: Europe Power Transformers Market Revenue Share (%), by Country 2024 & 2032
- Figure 8: South America Power Transformers Market Revenue (Million), by Country 2024 & 2032
- Figure 9: South America Power Transformers Market Revenue Share (%), by Country 2024 & 2032
- Figure 10: Middle East and Africa Power Transformers Market Revenue (Million), by Country 2024 & 2032
- Figure 11: Middle East and Africa Power Transformers Market Revenue Share (%), by Country 2024 & 2032
- Figure 12: North America Power Transformers Market Revenue (Million), by Size 2024 & 2032
- Figure 13: North America Power Transformers Market Revenue Share (%), by Size 2024 & 2032
- Figure 14: North America Power Transformers Market Revenue (Million), by Country 2024 & 2032
- Figure 15: North America Power Transformers Market Revenue Share (%), by Country 2024 & 2032
- Figure 16: Asia Pacific Power Transformers Market Revenue (Million), by Size 2024 & 2032
- Figure 17: Asia Pacific Power Transformers Market Revenue Share (%), by Size 2024 & 2032
- Figure 18: Asia Pacific Power Transformers Market Revenue (Million), by Country 2024 & 2032
- Figure 19: Asia Pacific Power Transformers Market Revenue Share (%), by Country 2024 & 2032
- Figure 20: Europe Power Transformers Market Revenue (Million), by Size 2024 & 2032
- Figure 21: Europe Power Transformers Market Revenue Share (%), by Size 2024 & 2032
- Figure 22: Europe Power Transformers Market Revenue (Million), by Country 2024 & 2032
- Figure 23: Europe Power Transformers Market Revenue Share (%), by Country 2024 & 2032
- Figure 24: South America Power Transformers Market Revenue (Million), by Size 2024 & 2032
- Figure 25: South America Power Transformers Market Revenue Share (%), by Size 2024 & 2032
- Figure 26: South America Power Transformers Market Revenue (Million), by Country 2024 & 2032
- Figure 27: South America Power Transformers Market Revenue Share (%), by Country 2024 & 2032
- Figure 28: Middle East and Africa Power Transformers Market Revenue (Million), by Size 2024 & 2032
- Figure 29: Middle East and Africa Power Transformers Market Revenue Share (%), by Size 2024 & 2032
- Figure 30: Middle East and Africa Power Transformers Market Revenue (Million), by Country 2024 & 2032
- Figure 31: Middle East and Africa Power Transformers Market Revenue Share (%), by Country 2024 & 2032
List of Tables
- Table 1: Global Power Transformers Market Revenue Million Forecast, by Region 2019 & 2032
- Table 2: Global Power Transformers Market Revenue Million Forecast, by Size 2019 & 2032
- Table 3: Global Power Transformers Market Revenue Million Forecast, by Region 2019 & 2032
- Table 4: Global Power Transformers Market Revenue Million Forecast, by Country 2019 & 2032
- Table 5: United States Power Transformers Market Revenue (Million) Forecast, by Application 2019 & 2032
- Table 6: Canada Power Transformers Market Revenue (Million) Forecast, by Application 2019 & 2032
- Table 7: Mexico Power Transformers Market Revenue (Million) Forecast, by Application 2019 & 2032
- Table 8: Global Power Transformers Market Revenue Million Forecast, by Country 2019 & 2032
- Table 9: China Power Transformers Market Revenue (Million) Forecast, by Application 2019 & 2032
- Table 10: India Power Transformers Market Revenue (Million) Forecast, by Application 2019 & 2032
- Table 11: Japan Power Transformers Market Revenue (Million) Forecast, by Application 2019 & 2032
- Table 12: South Korea Power Transformers Market Revenue (Million) Forecast, by Application 2019 & 2032
- Table 13: Rest of Asia Pacific Power Transformers Market Revenue (Million) Forecast, by Application 2019 & 2032
- Table 14: Global Power Transformers Market Revenue Million Forecast, by Country 2019 & 2032
- Table 15: Germany Power Transformers Market Revenue (Million) Forecast, by Application 2019 & 2032
- Table 16: United Kingdom Power Transformers Market Revenue (Million) Forecast, by Application 2019 & 2032
- Table 17: Spain Power Transformers Market Revenue (Million) Forecast, by Application 2019 & 2032
- Table 18: Italy Power Transformers Market Revenue (Million) Forecast, by Application 2019 & 2032
- Table 19: Rest of Europe Power Transformers Market Revenue (Million) Forecast, by Application 2019 & 2032
- Table 20: Global Power Transformers Market Revenue Million Forecast, by Country 2019 & 2032
- Table 21: Brazil Power Transformers Market Revenue (Million) Forecast, by Application 2019 & 2032
- Table 22: Argentina Power Transformers Market Revenue (Million) Forecast, by Application 2019 & 2032
- Table 23: Rest of South America Power Transformers Market Revenue (Million) Forecast, by Application 2019 & 2032
- Table 24: Global Power Transformers Market Revenue Million Forecast, by Country 2019 & 2032
- Table 25: Saudi Arabia Power Transformers Market Revenue (Million) Forecast, by Application 2019 & 2032
- Table 26: United Arab Emirates Power Transformers Market Revenue (Million) Forecast, by Application 2019 & 2032
- Table 27: South Africa Power Transformers Market Revenue (Million) Forecast, by Application 2019 & 2032
- Table 28: Rest of Middle East and Africa Power Transformers Market Revenue (Million) Forecast, by Application 2019 & 2032
- Table 29: Global Power Transformers Market Revenue Million Forecast, by Size 2019 & 2032
- Table 30: Global Power Transformers Market Revenue Million Forecast, by Country 2019 & 2032
- Table 31: United States Power Transformers Market Revenue (Million) Forecast, by Application 2019 & 2032
- Table 32: Canada Power Transformers Market Revenue (Million) Forecast, by Application 2019 & 2032
- Table 33: Mexico Power Transformers Market Revenue (Million) Forecast, by Application 2019 & 2032
- Table 34: Global Power Transformers Market Revenue Million Forecast, by Size 2019 & 2032
- Table 35: Global Power Transformers Market Revenue Million Forecast, by Country 2019 & 2032
- Table 36: China Power Transformers Market Revenue (Million) Forecast, by Application 2019 & 2032
- Table 37: India Power Transformers Market Revenue (Million) Forecast, by Application 2019 & 2032
- Table 38: Japan Power Transformers Market Revenue (Million) Forecast, by Application 2019 & 2032
- Table 39: South Korea Power Transformers Market Revenue (Million) Forecast, by Application 2019 & 2032
- Table 40: Rest of Asia Pacific Power Transformers Market Revenue (Million) Forecast, by Application 2019 & 2032
- Table 41: Global Power Transformers Market Revenue Million Forecast, by Size 2019 & 2032
- Table 42: Global Power Transformers Market Revenue Million Forecast, by Country 2019 & 2032
- Table 43: Germany Power Transformers Market Revenue (Million) Forecast, by Application 2019 & 2032
- Table 44: United Kingdom Power Transformers Market Revenue (Million) Forecast, by Application 2019 & 2032
- Table 45: Spain Power Transformers Market Revenue (Million) Forecast, by Application 2019 & 2032
- Table 46: Italy Power Transformers Market Revenue (Million) Forecast, by Application 2019 & 2032
- Table 47: Rest of Europe Power Transformers Market Revenue (Million) Forecast, by Application 2019 & 2032
- Table 48: Global Power Transformers Market Revenue Million Forecast, by Size 2019 & 2032
- Table 49: Global Power Transformers Market Revenue Million Forecast, by Country 2019 & 2032
- Table 50: Brazil Power Transformers Market Revenue (Million) Forecast, by Application 2019 & 2032
- Table 51: Argentina Power Transformers Market Revenue (Million) Forecast, by Application 2019 & 2032
- Table 52: Rest of South America Power Transformers Market Revenue (Million) Forecast, by Application 2019 & 2032
- Table 53: Global Power Transformers Market Revenue Million Forecast, by Size 2019 & 2032
- Table 54: Global Power Transformers Market Revenue Million Forecast, by Country 2019 & 2032
- Table 55: Saudi Arabia Power Transformers Market Revenue (Million) Forecast, by Application 2019 & 2032
- Table 56: United Arab Emirates Power Transformers Market Revenue (Million) Forecast, by Application 2019 & 2032
- Table 57: South Africa Power Transformers Market Revenue (Million) Forecast, by Application 2019 & 2032
- Table 58: Rest of Middle East and Africa Power Transformers Market Revenue (Million) Forecast, by Application 2019 & 2032
Frequently Asked Questions
1. What is the projected Compound Annual Growth Rate (CAGR) of the Power Transformers Market?
The projected CAGR is approximately 9.70%.
2. Which companies are prominent players in the Power Transformers Market?
Key companies in the market include ABB Ltd, Crompton Greaves Ltd, Toshiba Corporation, Hyosung Corporation, Bharat Heavy Electricals Limited, Mitsubishi Electric Corporation, Siemens AG, SPX Transformer Solutions Inc, Hyundai Heavy Industries Co Ltd, JiangSu HuaPeng Transformer Co Ltd*List Not Exhaustive, General Electric Company.
3. What are the main segments of the Power Transformers Market?
The market segments include Size.
4. Can you provide details about the market size?
The market size is estimated to be USD 28.27 Million as of 2022.
5. What are some drivers contributing to market growth?
4.; Increasing Integration Of Renewable Energy Generation4.; Aging Power Grids And Investments In Transmission And Distribution Infrastructure.
6. What are the notable trends driving market growth?
Large Power Transformers Segment to Witness Significant Growth.
7. Are there any restraints impacting market growth?
4.; Lack Of Investor Confidence Due To Sociopolitical Instability In Some Countries.
8. Can you provide examples of recent developments in the market?
August 2023: As part of President Biden’s Investing in America agenda, the United States Department of Energy (DOE) announced USD 20 million to support the installation of energy-efficient distribution transformers and comprehensive product systems that utilize equipment with electric motors, such as pumps, air compressors, and fans.
9. What pricing options are available for accessing the report?
Pricing options include single-user, multi-user, and enterprise licenses priced at USD 4750, USD 5250, and USD 8750 respectively.
10. Is the market size provided in terms of value or volume?
The market size is provided in terms of value, measured in Million.
11. Are there any specific market keywords associated with the report?
Yes, the market keyword associated with the report is "Power Transformers Market," which aids in identifying and referencing the specific market segment covered.
12. How do I determine which pricing option suits my needs best?
The pricing options vary based on user requirements and access needs. Individual users may opt for single-user licenses, while businesses requiring broader access may choose multi-user or enterprise licenses for cost-effective access to the report.
13. Are there any additional resources or data provided in the Power Transformers Market report?
While the report offers comprehensive insights, it's advisable to review the specific contents or supplementary materials provided to ascertain if additional resources or data are available.
14. How can I stay updated on further developments or reports in the Power Transformers Market?
To stay informed about further developments, trends, and reports in the Power Transformers Market, consider subscribing to industry newsletters, following relevant companies and organizations, or regularly checking reputable industry news sources and publications.
Methodology
Step 1 - Identification of Relevant Samples Size from Population Database


Step 2 - Approaches for Defining Global Market Size (Value, Volume* & Price*)

Note*: In applicable scenarios
Step 3 - Data Sources
Primary Research
- Web Analytics
- Survey Reports
- Research Institute
- Latest Research Reports
- Opinion Leaders
Secondary Research
- Annual Reports
- White Paper
- Latest Press Release
- Industry Association
- Paid Database
- Investor Presentations

Step 4 - Data Triangulation
Involves using different sources of information in order to increase the validity of a study
These sources are likely to be stakeholders in a program - participants, other researchers, program staff, other community members, and so on.
Then we put all data in single framework & apply various statistical tools to find out the dynamic on the market.
During the analysis stage, feedback from the stakeholder groups would be compared to determine areas of agreement as well as areas of divergence


