
Key Insights
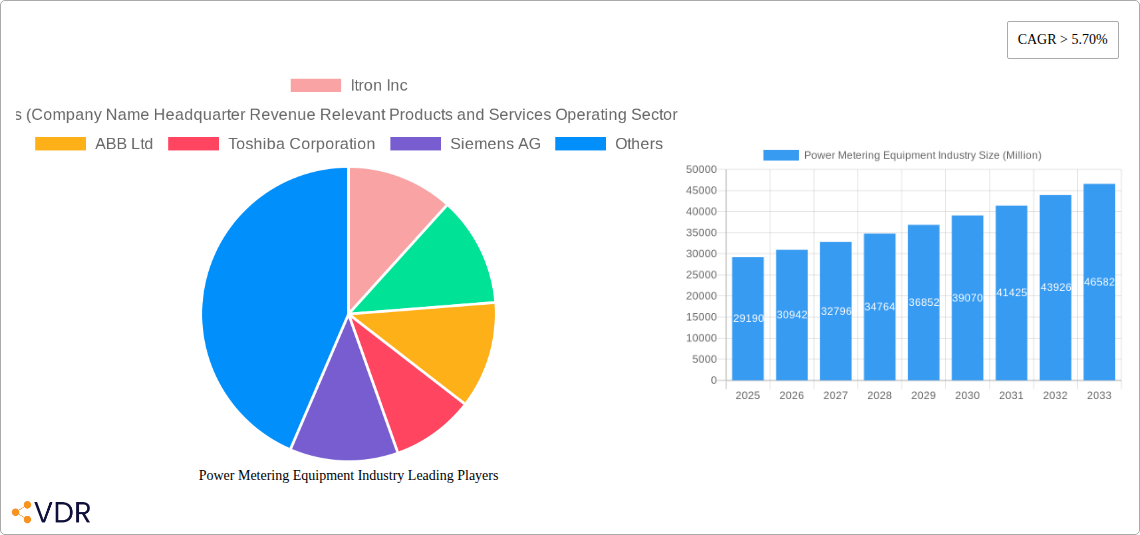
The global power metering equipment market, valued at $29.19 billion in 2025, is projected to experience robust growth, exhibiting a compound annual growth rate (CAGR) exceeding 5.70% from 2025 to 2033. This expansion is fueled by several key drivers. The increasing demand for energy efficiency and smart grids across residential, commercial, and industrial sectors is a primary catalyst. Governments worldwide are actively promoting smart metering initiatives to optimize energy distribution, reduce losses, and enhance grid reliability. Furthermore, the rising adoption of renewable energy sources necessitates advanced metering infrastructure capable of accurately measuring and monitoring diverse energy flows. Technological advancements, particularly the proliferation of smart meters with advanced communication capabilities and data analytics functionalities, are further driving market growth. Smart meters offer real-time consumption data, enabling better energy management and reducing overall energy costs. The transition from traditional analog meters to digital and smart meters is a significant trend shaping the market landscape.
However, market growth is not without its challenges. High initial investment costs associated with smart meter deployment, particularly in developing regions, represent a significant restraint. Concerns regarding data security and privacy related to smart meter data collection are also emerging. Nevertheless, the long-term benefits of improved energy management, reduced energy waste, and enhanced grid stability are expected to outweigh these challenges, ensuring continued growth of the power metering equipment market throughout the forecast period. The market is segmented by end-user (residential, commercial, industrial) and technology (analog, digital, smart meters), with smart meters witnessing the highest growth potential. Key players like Itron Inc., Honeywell International, ABB Ltd., Siemens AG, and Schneider Electric are at the forefront of innovation and market competition, continuously developing advanced metering solutions to meet evolving market needs. Geographical growth will be most pronounced in regions experiencing rapid urbanization and industrialization, such as Asia-Pacific.
Power Metering Equipment Industry: Market Report 2019-2033
This comprehensive report provides a detailed analysis of the Power Metering Equipment industry, covering market dynamics, growth trends, regional dominance, product landscape, key players, and future outlook. The study period spans from 2019 to 2033, with 2025 as the base and estimated year. The report utilizes data from 2019-2024 as the historical period and forecasts from 2025-2033. This report is invaluable for industry professionals, investors, and strategic decision-makers seeking insights into this rapidly evolving sector. The market is segmented by end-user (Residential, Commercial, Industrial) and technology (Analog Meters, Digital Meters, Smart Meters).
Power Metering Equipment Industry Market Dynamics & Structure
The power metering equipment market is characterized by moderate concentration, with several major players holding significant market share. Technological innovation, driven by the increasing adoption of smart meters and AMI (Advanced Metering Infrastructure), is a primary growth catalyst. Stringent government regulations promoting energy efficiency and grid modernization are further shaping the market landscape. Competition from alternative technologies remains minimal, but the increasing demand for advanced analytics and data management presents opportunities for new entrants. The market has witnessed several mergers and acquisitions (M&As) in recent years, with approximately xx deals valued at xx million USD in the past five years. This trend is expected to continue as companies seek to expand their product portfolios and geographic reach.
- Market Concentration: Moderately concentrated, with top 5 players holding approximately xx% market share.
- Technological Innovation: Smart meter adoption, AMI integration, and advanced data analytics are key drivers.
- Regulatory Frameworks: Government initiatives promoting energy efficiency and grid modernization are significant factors.
- Competitive Landscape: Relatively low competition from substitutes; focus on value-added services and data analytics is increasing.
- M&A Activity: Approx. xx M&A deals in the past five years, valued at xx million USD.
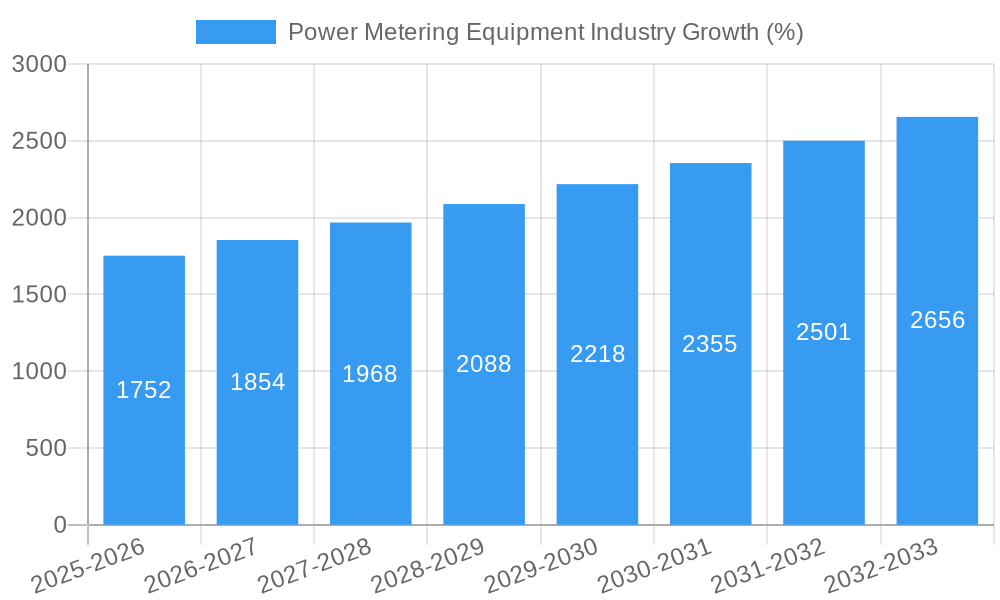
Power Metering Equipment Industry Growth Trends & Insights
The global power metering equipment market experienced steady growth during the historical period (2019-2024), expanding from xx million units in 2019 to xx million units in 2024, representing a CAGR of xx%. This growth is primarily attributed to the increasing demand for electricity, rising urbanization, and the growing adoption of smart grids worldwide. The forecast period (2025-2033) projects even more significant growth, reaching xx million units by 2033, with a projected CAGR of xx%. This accelerated growth will be fueled by government-led initiatives promoting smart meter deployments (like India's SMNP), increasing energy efficiency requirements, and advancements in IoT and data analytics technologies. Consumer behavior shifts towards greater energy awareness and sustainability are also driving demand. The market penetration of smart meters is expected to increase from xx% in 2024 to xx% by 2033.
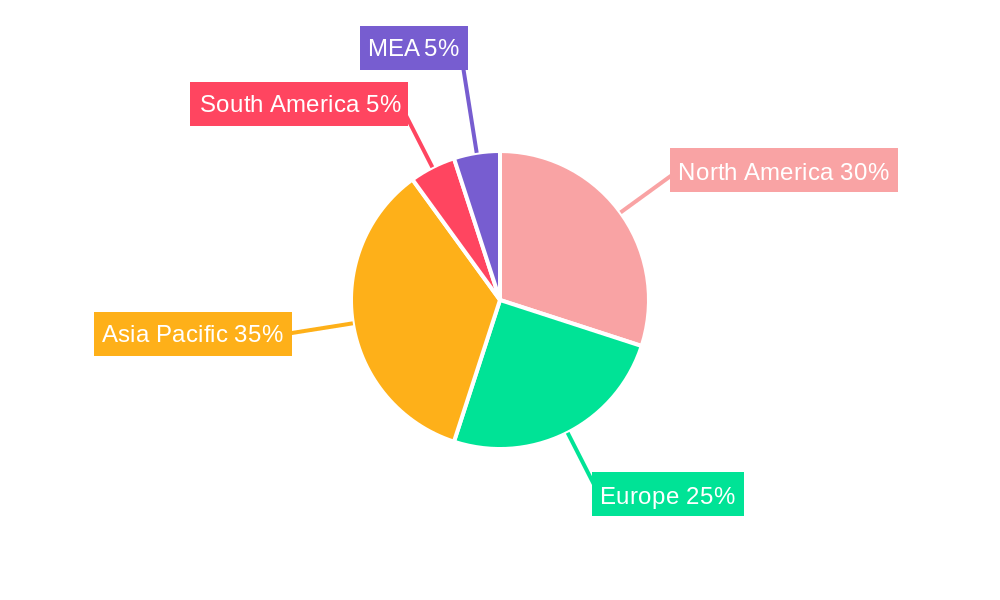
Dominant Regions, Countries, or Segments in Power Metering Equipment Industry
North America and Europe currently dominate the power metering equipment market, driven by mature electricity grids and strong regulatory support for smart grid initiatives. However, Asia-Pacific is expected to witness the fastest growth during the forecast period, fueled by rapid urbanization, increasing energy consumption, and significant government investments in infrastructure development. Within the segments, the smart meter segment is experiencing the most rapid growth, surpassing xx million units by 2033. The industrial segment is also a significant driver of growth due to increasing demand for energy monitoring and optimization solutions.
- Key Drivers:
- North America & Europe: Mature electricity grids, strong regulatory support for smart grids.
- Asia-Pacific: Rapid urbanization, increasing energy consumption, government investments in infrastructure.
- Smart Meters: Advanced functionalities, data analytics capabilities, improved energy efficiency.
- Industrial Segment: Demand for energy monitoring and optimization solutions.
Power Metering Equipment Industry Product Landscape
The power metering equipment market encompasses a range of products, from traditional analog meters to advanced smart meters with integrated communication capabilities and data analytics features. Recent innovations include the incorporation of advanced sensors, improved communication protocols (e.g., NB-IoT, LoRaWAN), and enhanced data security measures. These advancements enable real-time monitoring, remote meter reading, and predictive maintenance, leading to improved grid efficiency and reduced operational costs. Key features driving product differentiation include accuracy, reliability, longevity, and data security.
Key Drivers, Barriers & Challenges in Power Metering Equipment Industry
Key Drivers:
- Growing demand for electricity globally.
- Government regulations mandating smart meter adoption.
- Increasing focus on energy efficiency and grid modernization.
- Advancements in IoT, AI, and big data analytics.
Challenges:
- High upfront investment costs for smart meter deployments.
- Cybersecurity concerns related to data security and grid vulnerabilities.
- Interoperability issues between different metering systems.
- Supply chain disruptions impacting component availability.
Emerging Opportunities in Power Metering Equipment Industry
- Expansion into emerging markets with limited metering infrastructure.
- Development of advanced analytics and data management solutions.
- Integration of renewable energy sources into smart grid systems.
- Growing demand for energy storage solutions and microgrids.
Growth Accelerators in the Power Metering Equipment Industry
Technological advancements, such as the development of low-power wide-area networks (LPWAN) and improved data analytics capabilities, will continue to accelerate market growth. Strategic partnerships between utilities, technology providers, and system integrators will facilitate wider adoption of smart metering solutions. Government initiatives promoting energy efficiency and smart grid development will also drive demand.
Key Players Shaping the Power Metering Equipment Industry Market
- Itron Inc
- Honeywell International
- ABB Ltd
- Toshiba Corporation
- Siemens AG
- Schneider Electric SE
- Kamstrup AS
- Eaton Corporation PLC
- Aclara Technologies LLC
- General Electric Company
Notable Milestones in Power Metering Equipment Industry Sector
- March 2024: India's Smart Meter National Program (SMNP) announced, aiming to replace 250 million meters.
- February 2024: Enre establishes a public-private working group to accelerate smart meter deployment in Buenos Aires.
In-Depth Power Metering Equipment Industry Market Outlook
The power metering equipment market is poised for significant growth over the next decade, driven by continued investments in smart grid infrastructure, increasing demand for energy efficiency, and the adoption of advanced metering technologies. Strategic partnerships, technological breakthroughs, and supportive government policies will be key factors shaping the market's future. Companies focusing on innovation, data analytics, and cybersecurity will be best positioned to capitalize on emerging opportunities.
Power Metering Equipment Industry Segmentation
-
1. End User
- 1.1. Residential
- 1.2. Commercial
- 1.3. Industrial
-
2. Technology
- 2.1. Analog Meters
- 2.2. Digital Meters
- 2.3. Smart Meters
Power Metering Equipment Industry Segmentation By Geography
-
1. North America
- 1.1. United States
- 1.2. Canada
- 1.3. Rest of North America
-
2. Asia Pacific
- 2.1. China
- 2.2. India
- 2.3. Japan
- 2.4. South Korea
- 2.5. Malaysia
- 2.6. Thailand
- 2.7. Indonesia
- 2.8. Vietnam
- 2.9. Rest of Asia Pacific
-
3. Europe
- 3.1. Germany
- 3.2. France
- 3.3. United Kingdom
- 3.4. Spain
- 3.5. Nordic
- 3.6. Turkey
- 3.7. Russia
- 3.8. Rest of Europe
-
4. South America
- 4.1. Brazil
- 4.2. Argentina
- 4.3. Colombia
- 4.4. Rest of South America
-
5. Middle East and Africa
- 5.1. Saudi Arabia
- 5.2. United Arab Emirates
- 5.3. Qatar
- 5.4. South Africa
- 5.5. Nigeria
- 5.6. Oman
- 5.7. Egypt
- 5.8. Algeria
- 5.9. Rest of Middle East and Africa
Power Metering Equipment Industry REPORT HIGHLIGHTS
| Aspects | Details |
|---|---|
| Study Period | 2019-2033 |
| Base Year | 2024 |
| Estimated Year | 2025 |
| Forecast Period | 2025-2033 |
| Historical Period | 2019-2024 |
| Growth Rate | CAGR of > 5.70% from 2019-2033 |
| Segmentation |
|
Table of Contents
- 1. Introduction
- 1.1. Research Scope
- 1.2. Market Segmentation
- 1.3. Research Methodology
- 1.4. Definitions and Assumptions
- 2. Executive Summary
- 2.1. Introduction
- 3. Market Dynamics
- 3.1. Introduction
- 3.2. Market Drivers
- 3.2.1. 4.; Increasing Government Focus on the Development of Smart Grid Infrastructure 4.; Increase in Investments to Deploy Smart Meters
- 3.3. Market Restrains
- 3.3.1. 4.; Issues Related to Privacy and Standardization of Power Meters
- 3.4. Market Trends
- 3.4.1. Smart Meters Technology is Expected to Dominate the Market during the Forecast Period
- 4. Market Factor Analysis
- 4.1. Porters Five Forces
- 4.2. Supply/Value Chain
- 4.3. PESTEL analysis
- 4.4. Market Entropy
- 4.5. Patent/Trademark Analysis
- 5. Global Power Metering Equipment Industry Analysis, Insights and Forecast, 2019-2031
- 5.1. Market Analysis, Insights and Forecast - by End User
- 5.1.1. Residential
- 5.1.2. Commercial
- 5.1.3. Industrial
- 5.2. Market Analysis, Insights and Forecast - by Technology
- 5.2.1. Analog Meters
- 5.2.2. Digital Meters
- 5.2.3. Smart Meters
- 5.3. Market Analysis, Insights and Forecast - by Region
- 5.3.1. North America
- 5.3.2. Asia Pacific
- 5.3.3. Europe
- 5.3.4. South America
- 5.3.5. Middle East and Africa
- 5.1. Market Analysis, Insights and Forecast - by End User
- 6. North America Power Metering Equipment Industry Analysis, Insights and Forecast, 2019-2031
- 6.1. Market Analysis, Insights and Forecast - by End User
- 6.1.1. Residential
- 6.1.2. Commercial
- 6.1.3. Industrial
- 6.2. Market Analysis, Insights and Forecast - by Technology
- 6.2.1. Analog Meters
- 6.2.2. Digital Meters
- 6.2.3. Smart Meters
- 6.1. Market Analysis, Insights and Forecast - by End User
- 7. Asia Pacific Power Metering Equipment Industry Analysis, Insights and Forecast, 2019-2031
- 7.1. Market Analysis, Insights and Forecast - by End User
- 7.1.1. Residential
- 7.1.2. Commercial
- 7.1.3. Industrial
- 7.2. Market Analysis, Insights and Forecast - by Technology
- 7.2.1. Analog Meters
- 7.2.2. Digital Meters
- 7.2.3. Smart Meters
- 7.1. Market Analysis, Insights and Forecast - by End User
- 8. Europe Power Metering Equipment Industry Analysis, Insights and Forecast, 2019-2031
- 8.1. Market Analysis, Insights and Forecast - by End User
- 8.1.1. Residential
- 8.1.2. Commercial
- 8.1.3. Industrial
- 8.2. Market Analysis, Insights and Forecast - by Technology
- 8.2.1. Analog Meters
- 8.2.2. Digital Meters
- 8.2.3. Smart Meters
- 8.1. Market Analysis, Insights and Forecast - by End User
- 9. South America Power Metering Equipment Industry Analysis, Insights and Forecast, 2019-2031
- 9.1. Market Analysis, Insights and Forecast - by End User
- 9.1.1. Residential
- 9.1.2. Commercial
- 9.1.3. Industrial
- 9.2. Market Analysis, Insights and Forecast - by Technology
- 9.2.1. Analog Meters
- 9.2.2. Digital Meters
- 9.2.3. Smart Meters
- 9.1. Market Analysis, Insights and Forecast - by End User
- 10. Middle East and Africa Power Metering Equipment Industry Analysis, Insights and Forecast, 2019-2031
- 10.1. Market Analysis, Insights and Forecast - by End User
- 10.1.1. Residential
- 10.1.2. Commercial
- 10.1.3. Industrial
- 10.2. Market Analysis, Insights and Forecast - by Technology
- 10.2.1. Analog Meters
- 10.2.2. Digital Meters
- 10.2.3. Smart Meters
- 10.1. Market Analysis, Insights and Forecast - by End User
- 11. North America Power Metering Equipment Industry Analysis, Insights and Forecast, 2019-2031
- 11.1. Market Analysis, Insights and Forecast - By Country/Sub-region
- 11.1.1 United States
- 11.1.2 Canada
- 11.1.3 Mexico
- 12. Europe Power Metering Equipment Industry Analysis, Insights and Forecast, 2019-2031
- 12.1. Market Analysis, Insights and Forecast - By Country/Sub-region
- 12.1.1 Germany
- 12.1.2 United Kingdom
- 12.1.3 France
- 12.1.4 Spain
- 12.1.5 Italy
- 12.1.6 Spain
- 12.1.7 Belgium
- 12.1.8 Netherland
- 12.1.9 Nordics
- 12.1.10 Rest of Europe
- 13. Asia Pacific Power Metering Equipment Industry Analysis, Insights and Forecast, 2019-2031
- 13.1. Market Analysis, Insights and Forecast - By Country/Sub-region
- 13.1.1 China
- 13.1.2 Japan
- 13.1.3 India
- 13.1.4 South Korea
- 13.1.5 Southeast Asia
- 13.1.6 Australia
- 13.1.7 Indonesia
- 13.1.8 Phillipes
- 13.1.9 Singapore
- 13.1.10 Thailandc
- 13.1.11 Rest of Asia Pacific
- 14. South America Power Metering Equipment Industry Analysis, Insights and Forecast, 2019-2031
- 14.1. Market Analysis, Insights and Forecast - By Country/Sub-region
- 14.1.1 Brazil
- 14.1.2 Argentina
- 14.1.3 Peru
- 14.1.4 Chile
- 14.1.5 Colombia
- 14.1.6 Ecuador
- 14.1.7 Venezuela
- 14.1.8 Rest of South America
- 15. North America Power Metering Equipment Industry Analysis, Insights and Forecast, 2019-2031
- 15.1. Market Analysis, Insights and Forecast - By Country/Sub-region
- 15.1.1 United States
- 15.1.2 Canada
- 15.1.3 Mexico
- 16. MEA Power Metering Equipment Industry Analysis, Insights and Forecast, 2019-2031
- 16.1. Market Analysis, Insights and Forecast - By Country/Sub-region
- 16.1.1 United Arab Emirates
- 16.1.2 Saudi Arabia
- 16.1.3 South Africa
- 16.1.4 Rest of Middle East and Africa
- 17. Competitive Analysis
- 17.1. Global Market Share Analysis 2024
- 17.2. Company Profiles
- 17.2.1 Itron Inc
- 17.2.1.1. Overview
- 17.2.1.2. Products
- 17.2.1.3. SWOT Analysis
- 17.2.1.4. Recent Developments
- 17.2.1.5. Financials (Based on Availability)
- 17.2.2 Honeywell International*List Not Exhaustive 6 4 List of Other Prominent Companies (Company Name Headquarter Revenue Relevant Products and Services Operating Sector Recent Trends and Technology or Projects Contact Details etc )6 5 Market Ranking Analysi
- 17.2.2.1. Overview
- 17.2.2.2. Products
- 17.2.2.3. SWOT Analysis
- 17.2.2.4. Recent Developments
- 17.2.2.5. Financials (Based on Availability)
- 17.2.3 ABB Ltd
- 17.2.3.1. Overview
- 17.2.3.2. Products
- 17.2.3.3. SWOT Analysis
- 17.2.3.4. Recent Developments
- 17.2.3.5. Financials (Based on Availability)
- 17.2.4 Toshiba Corporation
- 17.2.4.1. Overview
- 17.2.4.2. Products
- 17.2.4.3. SWOT Analysis
- 17.2.4.4. Recent Developments
- 17.2.4.5. Financials (Based on Availability)
- 17.2.5 Siemens AG
- 17.2.5.1. Overview
- 17.2.5.2. Products
- 17.2.5.3. SWOT Analysis
- 17.2.5.4. Recent Developments
- 17.2.5.5. Financials (Based on Availability)
- 17.2.6 Schneider Electric SE
- 17.2.6.1. Overview
- 17.2.6.2. Products
- 17.2.6.3. SWOT Analysis
- 17.2.6.4. Recent Developments
- 17.2.6.5. Financials (Based on Availability)
- 17.2.7 Kamstrup AS
- 17.2.7.1. Overview
- 17.2.7.2. Products
- 17.2.7.3. SWOT Analysis
- 17.2.7.4. Recent Developments
- 17.2.7.5. Financials (Based on Availability)
- 17.2.8 Eaton Corporation PLC
- 17.2.8.1. Overview
- 17.2.8.2. Products
- 17.2.8.3. SWOT Analysis
- 17.2.8.4. Recent Developments
- 17.2.8.5. Financials (Based on Availability)
- 17.2.9 Aclara Technologies LLC
- 17.2.9.1. Overview
- 17.2.9.2. Products
- 17.2.9.3. SWOT Analysis
- 17.2.9.4. Recent Developments
- 17.2.9.5. Financials (Based on Availability)
- 17.2.10 General Electric Company
- 17.2.10.1. Overview
- 17.2.10.2. Products
- 17.2.10.3. SWOT Analysis
- 17.2.10.4. Recent Developments
- 17.2.10.5. Financials (Based on Availability)
- 17.2.1 Itron Inc
List of Figures
- Figure 1: Global Power Metering Equipment Industry Revenue Breakdown (Million, %) by Region 2024 & 2032
- Figure 2: North America Power Metering Equipment Industry Revenue (Million), by Country 2024 & 2032
- Figure 3: North America Power Metering Equipment Industry Revenue Share (%), by Country 2024 & 2032
- Figure 4: Europe Power Metering Equipment Industry Revenue (Million), by Country 2024 & 2032
- Figure 5: Europe Power Metering Equipment Industry Revenue Share (%), by Country 2024 & 2032
- Figure 6: Asia Pacific Power Metering Equipment Industry Revenue (Million), by Country 2024 & 2032
- Figure 7: Asia Pacific Power Metering Equipment Industry Revenue Share (%), by Country 2024 & 2032
- Figure 8: South America Power Metering Equipment Industry Revenue (Million), by Country 2024 & 2032
- Figure 9: South America Power Metering Equipment Industry Revenue Share (%), by Country 2024 & 2032
- Figure 10: North America Power Metering Equipment Industry Revenue (Million), by Country 2024 & 2032
- Figure 11: North America Power Metering Equipment Industry Revenue Share (%), by Country 2024 & 2032
- Figure 12: MEA Power Metering Equipment Industry Revenue (Million), by Country 2024 & 2032
- Figure 13: MEA Power Metering Equipment Industry Revenue Share (%), by Country 2024 & 2032
- Figure 14: North America Power Metering Equipment Industry Revenue (Million), by End User 2024 & 2032
- Figure 15: North America Power Metering Equipment Industry Revenue Share (%), by End User 2024 & 2032
- Figure 16: North America Power Metering Equipment Industry Revenue (Million), by Technology 2024 & 2032
- Figure 17: North America Power Metering Equipment Industry Revenue Share (%), by Technology 2024 & 2032
- Figure 18: North America Power Metering Equipment Industry Revenue (Million), by Country 2024 & 2032
- Figure 19: North America Power Metering Equipment Industry Revenue Share (%), by Country 2024 & 2032
- Figure 20: Asia Pacific Power Metering Equipment Industry Revenue (Million), by End User 2024 & 2032
- Figure 21: Asia Pacific Power Metering Equipment Industry Revenue Share (%), by End User 2024 & 2032
- Figure 22: Asia Pacific Power Metering Equipment Industry Revenue (Million), by Technology 2024 & 2032
- Figure 23: Asia Pacific Power Metering Equipment Industry Revenue Share (%), by Technology 2024 & 2032
- Figure 24: Asia Pacific Power Metering Equipment Industry Revenue (Million), by Country 2024 & 2032
- Figure 25: Asia Pacific Power Metering Equipment Industry Revenue Share (%), by Country 2024 & 2032
- Figure 26: Europe Power Metering Equipment Industry Revenue (Million), by End User 2024 & 2032
- Figure 27: Europe Power Metering Equipment Industry Revenue Share (%), by End User 2024 & 2032
- Figure 28: Europe Power Metering Equipment Industry Revenue (Million), by Technology 2024 & 2032
- Figure 29: Europe Power Metering Equipment Industry Revenue Share (%), by Technology 2024 & 2032
- Figure 30: Europe Power Metering Equipment Industry Revenue (Million), by Country 2024 & 2032
- Figure 31: Europe Power Metering Equipment Industry Revenue Share (%), by Country 2024 & 2032
- Figure 32: South America Power Metering Equipment Industry Revenue (Million), by End User 2024 & 2032
- Figure 33: South America Power Metering Equipment Industry Revenue Share (%), by End User 2024 & 2032
- Figure 34: South America Power Metering Equipment Industry Revenue (Million), by Technology 2024 & 2032
- Figure 35: South America Power Metering Equipment Industry Revenue Share (%), by Technology 2024 & 2032
- Figure 36: South America Power Metering Equipment Industry Revenue (Million), by Country 2024 & 2032
- Figure 37: South America Power Metering Equipment Industry Revenue Share (%), by Country 2024 & 2032
- Figure 38: Middle East and Africa Power Metering Equipment Industry Revenue (Million), by End User 2024 & 2032
- Figure 39: Middle East and Africa Power Metering Equipment Industry Revenue Share (%), by End User 2024 & 2032
- Figure 40: Middle East and Africa Power Metering Equipment Industry Revenue (Million), by Technology 2024 & 2032
- Figure 41: Middle East and Africa Power Metering Equipment Industry Revenue Share (%), by Technology 2024 & 2032
- Figure 42: Middle East and Africa Power Metering Equipment Industry Revenue (Million), by Country 2024 & 2032
- Figure 43: Middle East and Africa Power Metering Equipment Industry Revenue Share (%), by Country 2024 & 2032
List of Tables
- Table 1: Global Power Metering Equipment Industry Revenue Million Forecast, by Region 2019 & 2032
- Table 2: Global Power Metering Equipment Industry Revenue Million Forecast, by End User 2019 & 2032
- Table 3: Global Power Metering Equipment Industry Revenue Million Forecast, by Technology 2019 & 2032
- Table 4: Global Power Metering Equipment Industry Revenue Million Forecast, by Region 2019 & 2032
- Table 5: Global Power Metering Equipment Industry Revenue Million Forecast, by Country 2019 & 2032
- Table 6: United States Power Metering Equipment Industry Revenue (Million) Forecast, by Application 2019 & 2032
- Table 7: Canada Power Metering Equipment Industry Revenue (Million) Forecast, by Application 2019 & 2032
- Table 8: Mexico Power Metering Equipment Industry Revenue (Million) Forecast, by Application 2019 & 2032
- Table 9: Global Power Metering Equipment Industry Revenue Million Forecast, by Country 2019 & 2032
- Table 10: Germany Power Metering Equipment Industry Revenue (Million) Forecast, by Application 2019 & 2032
- Table 11: United Kingdom Power Metering Equipment Industry Revenue (Million) Forecast, by Application 2019 & 2032
- Table 12: France Power Metering Equipment Industry Revenue (Million) Forecast, by Application 2019 & 2032
- Table 13: Spain Power Metering Equipment Industry Revenue (Million) Forecast, by Application 2019 & 2032
- Table 14: Italy Power Metering Equipment Industry Revenue (Million) Forecast, by Application 2019 & 2032
- Table 15: Spain Power Metering Equipment Industry Revenue (Million) Forecast, by Application 2019 & 2032
- Table 16: Belgium Power Metering Equipment Industry Revenue (Million) Forecast, by Application 2019 & 2032
- Table 17: Netherland Power Metering Equipment Industry Revenue (Million) Forecast, by Application 2019 & 2032
- Table 18: Nordics Power Metering Equipment Industry Revenue (Million) Forecast, by Application 2019 & 2032
- Table 19: Rest of Europe Power Metering Equipment Industry Revenue (Million) Forecast, by Application 2019 & 2032
- Table 20: Global Power Metering Equipment Industry Revenue Million Forecast, by Country 2019 & 2032
- Table 21: China Power Metering Equipment Industry Revenue (Million) Forecast, by Application 2019 & 2032
- Table 22: Japan Power Metering Equipment Industry Revenue (Million) Forecast, by Application 2019 & 2032
- Table 23: India Power Metering Equipment Industry Revenue (Million) Forecast, by Application 2019 & 2032
- Table 24: South Korea Power Metering Equipment Industry Revenue (Million) Forecast, by Application 2019 & 2032
- Table 25: Southeast Asia Power Metering Equipment Industry Revenue (Million) Forecast, by Application 2019 & 2032
- Table 26: Australia Power Metering Equipment Industry Revenue (Million) Forecast, by Application 2019 & 2032
- Table 27: Indonesia Power Metering Equipment Industry Revenue (Million) Forecast, by Application 2019 & 2032
- Table 28: Phillipes Power Metering Equipment Industry Revenue (Million) Forecast, by Application 2019 & 2032
- Table 29: Singapore Power Metering Equipment Industry Revenue (Million) Forecast, by Application 2019 & 2032
- Table 30: Thailandc Power Metering Equipment Industry Revenue (Million) Forecast, by Application 2019 & 2032
- Table 31: Rest of Asia Pacific Power Metering Equipment Industry Revenue (Million) Forecast, by Application 2019 & 2032
- Table 32: Global Power Metering Equipment Industry Revenue Million Forecast, by Country 2019 & 2032
- Table 33: Brazil Power Metering Equipment Industry Revenue (Million) Forecast, by Application 2019 & 2032
- Table 34: Argentina Power Metering Equipment Industry Revenue (Million) Forecast, by Application 2019 & 2032
- Table 35: Peru Power Metering Equipment Industry Revenue (Million) Forecast, by Application 2019 & 2032
- Table 36: Chile Power Metering Equipment Industry Revenue (Million) Forecast, by Application 2019 & 2032
- Table 37: Colombia Power Metering Equipment Industry Revenue (Million) Forecast, by Application 2019 & 2032
- Table 38: Ecuador Power Metering Equipment Industry Revenue (Million) Forecast, by Application 2019 & 2032
- Table 39: Venezuela Power Metering Equipment Industry Revenue (Million) Forecast, by Application 2019 & 2032
- Table 40: Rest of South America Power Metering Equipment Industry Revenue (Million) Forecast, by Application 2019 & 2032
- Table 41: Global Power Metering Equipment Industry Revenue Million Forecast, by Country 2019 & 2032
- Table 42: United States Power Metering Equipment Industry Revenue (Million) Forecast, by Application 2019 & 2032
- Table 43: Canada Power Metering Equipment Industry Revenue (Million) Forecast, by Application 2019 & 2032
- Table 44: Mexico Power Metering Equipment Industry Revenue (Million) Forecast, by Application 2019 & 2032
- Table 45: Global Power Metering Equipment Industry Revenue Million Forecast, by Country 2019 & 2032
- Table 46: United Arab Emirates Power Metering Equipment Industry Revenue (Million) Forecast, by Application 2019 & 2032
- Table 47: Saudi Arabia Power Metering Equipment Industry Revenue (Million) Forecast, by Application 2019 & 2032
- Table 48: South Africa Power Metering Equipment Industry Revenue (Million) Forecast, by Application 2019 & 2032
- Table 49: Rest of Middle East and Africa Power Metering Equipment Industry Revenue (Million) Forecast, by Application 2019 & 2032
- Table 50: Global Power Metering Equipment Industry Revenue Million Forecast, by End User 2019 & 2032
- Table 51: Global Power Metering Equipment Industry Revenue Million Forecast, by Technology 2019 & 2032
- Table 52: Global Power Metering Equipment Industry Revenue Million Forecast, by Country 2019 & 2032
- Table 53: United States Power Metering Equipment Industry Revenue (Million) Forecast, by Application 2019 & 2032
- Table 54: Canada Power Metering Equipment Industry Revenue (Million) Forecast, by Application 2019 & 2032
- Table 55: Rest of North America Power Metering Equipment Industry Revenue (Million) Forecast, by Application 2019 & 2032
- Table 56: Global Power Metering Equipment Industry Revenue Million Forecast, by End User 2019 & 2032
- Table 57: Global Power Metering Equipment Industry Revenue Million Forecast, by Technology 2019 & 2032
- Table 58: Global Power Metering Equipment Industry Revenue Million Forecast, by Country 2019 & 2032
- Table 59: China Power Metering Equipment Industry Revenue (Million) Forecast, by Application 2019 & 2032
- Table 60: India Power Metering Equipment Industry Revenue (Million) Forecast, by Application 2019 & 2032
- Table 61: Japan Power Metering Equipment Industry Revenue (Million) Forecast, by Application 2019 & 2032
- Table 62: South Korea Power Metering Equipment Industry Revenue (Million) Forecast, by Application 2019 & 2032
- Table 63: Malaysia Power Metering Equipment Industry Revenue (Million) Forecast, by Application 2019 & 2032
- Table 64: Thailand Power Metering Equipment Industry Revenue (Million) Forecast, by Application 2019 & 2032
- Table 65: Indonesia Power Metering Equipment Industry Revenue (Million) Forecast, by Application 2019 & 2032
- Table 66: Vietnam Power Metering Equipment Industry Revenue (Million) Forecast, by Application 2019 & 2032
- Table 67: Rest of Asia Pacific Power Metering Equipment Industry Revenue (Million) Forecast, by Application 2019 & 2032
- Table 68: Global Power Metering Equipment Industry Revenue Million Forecast, by End User 2019 & 2032
- Table 69: Global Power Metering Equipment Industry Revenue Million Forecast, by Technology 2019 & 2032
- Table 70: Global Power Metering Equipment Industry Revenue Million Forecast, by Country 2019 & 2032
- Table 71: Germany Power Metering Equipment Industry Revenue (Million) Forecast, by Application 2019 & 2032
- Table 72: France Power Metering Equipment Industry Revenue (Million) Forecast, by Application 2019 & 2032
- Table 73: United Kingdom Power Metering Equipment Industry Revenue (Million) Forecast, by Application 2019 & 2032
- Table 74: Spain Power Metering Equipment Industry Revenue (Million) Forecast, by Application 2019 & 2032
- Table 75: Nordic Power Metering Equipment Industry Revenue (Million) Forecast, by Application 2019 & 2032
- Table 76: Turkey Power Metering Equipment Industry Revenue (Million) Forecast, by Application 2019 & 2032
- Table 77: Russia Power Metering Equipment Industry Revenue (Million) Forecast, by Application 2019 & 2032
- Table 78: Rest of Europe Power Metering Equipment Industry Revenue (Million) Forecast, by Application 2019 & 2032
- Table 79: Global Power Metering Equipment Industry Revenue Million Forecast, by End User 2019 & 2032
- Table 80: Global Power Metering Equipment Industry Revenue Million Forecast, by Technology 2019 & 2032
- Table 81: Global Power Metering Equipment Industry Revenue Million Forecast, by Country 2019 & 2032
- Table 82: Brazil Power Metering Equipment Industry Revenue (Million) Forecast, by Application 2019 & 2032
- Table 83: Argentina Power Metering Equipment Industry Revenue (Million) Forecast, by Application 2019 & 2032
- Table 84: Colombia Power Metering Equipment Industry Revenue (Million) Forecast, by Application 2019 & 2032
- Table 85: Rest of South America Power Metering Equipment Industry Revenue (Million) Forecast, by Application 2019 & 2032
- Table 86: Global Power Metering Equipment Industry Revenue Million Forecast, by End User 2019 & 2032
- Table 87: Global Power Metering Equipment Industry Revenue Million Forecast, by Technology 2019 & 2032
- Table 88: Global Power Metering Equipment Industry Revenue Million Forecast, by Country 2019 & 2032
- Table 89: Saudi Arabia Power Metering Equipment Industry Revenue (Million) Forecast, by Application 2019 & 2032
- Table 90: United Arab Emirates Power Metering Equipment Industry Revenue (Million) Forecast, by Application 2019 & 2032
- Table 91: Qatar Power Metering Equipment Industry Revenue (Million) Forecast, by Application 2019 & 2032
- Table 92: South Africa Power Metering Equipment Industry Revenue (Million) Forecast, by Application 2019 & 2032
- Table 93: Nigeria Power Metering Equipment Industry Revenue (Million) Forecast, by Application 2019 & 2032
- Table 94: Oman Power Metering Equipment Industry Revenue (Million) Forecast, by Application 2019 & 2032
- Table 95: Egypt Power Metering Equipment Industry Revenue (Million) Forecast, by Application 2019 & 2032
- Table 96: Algeria Power Metering Equipment Industry Revenue (Million) Forecast, by Application 2019 & 2032
- Table 97: Rest of Middle East and Africa Power Metering Equipment Industry Revenue (Million) Forecast, by Application 2019 & 2032
Frequently Asked Questions
1. What is the projected Compound Annual Growth Rate (CAGR) of the Power Metering Equipment Industry?
The projected CAGR is approximately > 5.70%.
2. Which companies are prominent players in the Power Metering Equipment Industry?
Key companies in the market include Itron Inc, Honeywell International*List Not Exhaustive 6 4 List of Other Prominent Companies (Company Name Headquarter Revenue Relevant Products and Services Operating Sector Recent Trends and Technology or Projects Contact Details etc )6 5 Market Ranking Analysi, ABB Ltd, Toshiba Corporation, Siemens AG, Schneider Electric SE, Kamstrup AS, Eaton Corporation PLC, Aclara Technologies LLC, General Electric Company.
3. What are the main segments of the Power Metering Equipment Industry?
The market segments include End User, Technology.
4. Can you provide details about the market size?
The market size is estimated to be USD 29.19 Million as of 2022.
5. What are some drivers contributing to market growth?
4.; Increasing Government Focus on the Development of Smart Grid Infrastructure 4.; Increase in Investments to Deploy Smart Meters.
6. What are the notable trends driving market growth?
Smart Meters Technology is Expected to Dominate the Market during the Forecast Period.
7. Are there any restraints impacting market growth?
4.; Issues Related to Privacy and Standardization of Power Meters.
8. Can you provide examples of recent developments in the market?
March 2024: The Government of India announced the Smart Meter National Program (SMNP). The program aims to replace 250 million conventional electricity meters with prepaid smart meters, along with upgrading infrastructure such as feeders and transformers. The project will be funded with an estimated capital expenditure of INR 1.5 trillion (approximately USD 17.97 billion) and is slated for implementation over the next five fiscal years.
9. What pricing options are available for accessing the report?
Pricing options include single-user, multi-user, and enterprise licenses priced at USD 4750, USD 5250, and USD 8750 respectively.
10. Is the market size provided in terms of value or volume?
The market size is provided in terms of value, measured in Million.
11. Are there any specific market keywords associated with the report?
Yes, the market keyword associated with the report is "Power Metering Equipment Industry," which aids in identifying and referencing the specific market segment covered.
12. How do I determine which pricing option suits my needs best?
The pricing options vary based on user requirements and access needs. Individual users may opt for single-user licenses, while businesses requiring broader access may choose multi-user or enterprise licenses for cost-effective access to the report.
13. Are there any additional resources or data provided in the Power Metering Equipment Industry report?
While the report offers comprehensive insights, it's advisable to review the specific contents or supplementary materials provided to ascertain if additional resources or data are available.
14. How can I stay updated on further developments or reports in the Power Metering Equipment Industry?
To stay informed about further developments, trends, and reports in the Power Metering Equipment Industry, consider subscribing to industry newsletters, following relevant companies and organizations, or regularly checking reputable industry news sources and publications.
Methodology
Step 1 - Identification of Relevant Samples Size from Population Database


Step 2 - Approaches for Defining Global Market Size (Value, Volume* & Price*)

Note*: In applicable scenarios
Step 3 - Data Sources
Primary Research
- Web Analytics
- Survey Reports
- Research Institute
- Latest Research Reports
- Opinion Leaders
Secondary Research
- Annual Reports
- White Paper
- Latest Press Release
- Industry Association
- Paid Database
- Investor Presentations

Step 4 - Data Triangulation
Involves using different sources of information in order to increase the validity of a study
These sources are likely to be stakeholders in a program - participants, other researchers, program staff, other community members, and so on.
Then we put all data in single framework & apply various statistical tools to find out the dynamic on the market.
During the analysis stage, feedback from the stakeholder groups would be compared to determine areas of agreement as well as areas of divergence


