


Key Insights
The global Power Battery Solutions market is projected for significant expansion, forecasted to reach a market size of $16.04 billion by 2025. This growth is propelled by the increasing demand for efficient and sustainable energy storage solutions, particularly within the automotive sector, driven by the rapid adoption of electric vehicles (EVs). Commercial applications, such as grid storage and industrial machinery, are also key contributors as organizations prioritize reliable and eco-friendly power options. The market is expected to experience a Compound Annual Growth Rate (CAGR) of 10.3% from 2025 to 2033. This robust growth is further bolstered by government incentives supporting clean energy and substantial investments in battery research and development.
Power Battery Solutions Market Size (In Billion)

Key trends in the Power Battery Solutions market revolve around innovation in battery chemistry and manufacturing. Advancements in lithium-ion technology, focusing on enhanced energy density, faster charging, and improved safety, are paramount. The emergence of solid-state batteries also signals future potential. Market leaders are actively pursuing strategic alliances, mergers, and acquisitions to broaden their global presence and technological capabilities. Challenges include the cost of raw materials, intricate supply chain management, and evolving regulatory frameworks. Furthermore, battery recycling and disposal are critical considerations, fostering the development of circular economy models. Geographically, the Asia Pacific region, led by China, is anticipated to lead the market due to its strong manufacturing infrastructure and high EV penetration. North America and Europe represent substantial markets, driven by supportive policies and heightened consumer awareness of sustainable energy.

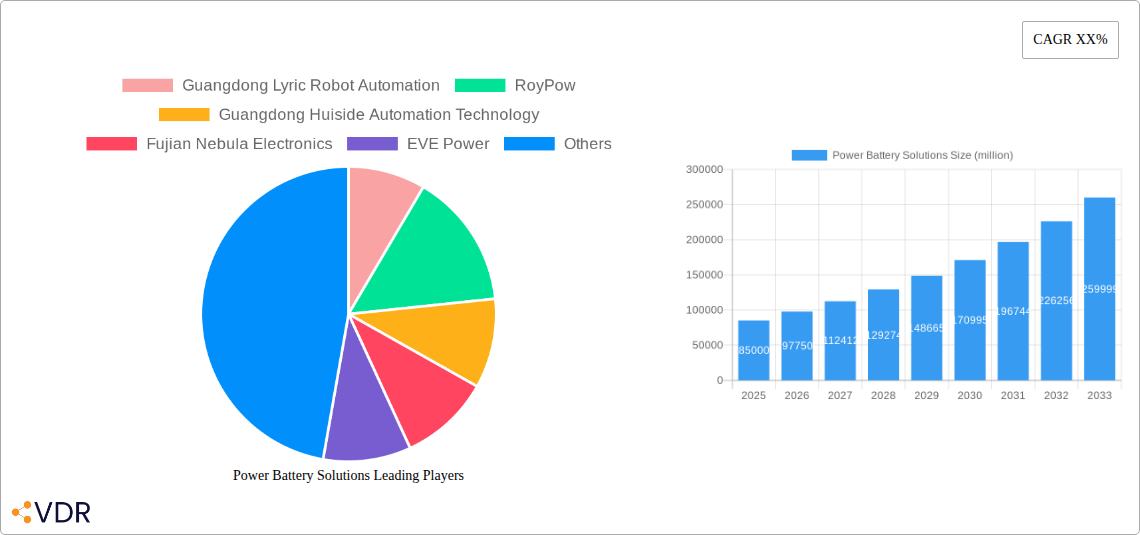
Power Battery Solutions Company Market Share
Power Battery Solutions Market Dynamics & Structure
The power battery solutions market is characterized by a moderate to high market concentration, with key players like EVE Power, Henkel, and 3M holding significant shares. Technological innovation is a primary driver, fueled by the relentless pursuit of higher energy density, faster charging, and enhanced safety in lithium-ion battery technology. Automation in battery manufacturing, as exemplified by companies like Guangdong Lyric Robot Automation and Guangdong Huiside Automation Technology, is another critical innovation area, optimizing production efficiency and reducing costs.
Regulatory frameworks are increasingly influencing market direction, with stringent environmental standards and mandates for battery recycling pushing for sustainable solutions. Competitive product substitutes, while less prevalent in high-performance applications, are emerging in niche segments, particularly for lead-acid battery replacements in certain commercial uses. End-user demographics are shifting, with a growing demand for electric mobility in the Automotive segment and increasing electrification in the Commercial sector. Mergers and acquisitions (M&A) are a notable trend, with companies like Cox Automotive Inc. and EV Battery Solutions actively consolidating to gain market access and technological expertise.
- Market Share Concentration: Top 5 players hold an estimated 45% of the global market.
- Technological Innovation Drivers: Focus on solid-state batteries, improved electrolyte formulations, and advanced thermal management systems.
- Regulatory Frameworks: Government incentives for EVs, battery recycling mandates, and safety standards (e.g., UN 38.3).
- Competitive Product Substitutes: Emerging solid-state technologies and alternative chemistries for specific use cases.
- End-User Demographics: Rising middle class in developing economies driving demand for consumer electronics and EVs.
- M&A Trends: Strategic acquisitions for technology integration and supply chain resilience; an estimated 15 significant deals in the last two years.
Power Battery Solutions Growth Trends & Insights
The global power battery solutions market is projected for robust growth, driven by the accelerating transition towards electrified transportation and renewable energy storage. This market is experiencing a significant expansion, moving from an estimated 280,000 million units in 2019 to a projected 750,000 million units by 2025. The forecast period of 2025–2033 anticipates a Compound Annual Growth Rate (CAGR) of approximately 12.5%, indicating sustained and rapid expansion.
The adoption rates of lithium-ion battery technology, particularly within the Automotive segment, are soaring due to government policies, declining battery costs, and improved vehicle performance. Consumer behavior is shifting dramatically, with a growing preference for electric vehicles (EVs) and a heightened awareness of environmental sustainability. This shift is creating a substantial demand for high-capacity and long-lasting power batteries. Technological disruptions, such as advancements in battery management systems (BMS) and fast-charging capabilities, are further enhancing the appeal and practicality of battery-powered solutions across various applications.
In the Commercial sector, the electrification of logistics fleets and the increasing use of battery-powered industrial equipment are contributing significantly to market growth. Companies are investing heavily in R&D to develop more efficient and cost-effective battery solutions, including next-generation NiMH Battery for hybrid applications and advancements in Others types for specialized industrial uses. The Others application segment, encompassing grid storage and portable electronics, is also witnessing considerable growth, driven by the demand for reliable and sustainable energy solutions. The parent market, encompassing all power battery technologies and applications, is expected to reach 1,200,000 million units by 2033, with the child market segments like Automotive and Commercial applications driving this expansion. The market penetration of EVs is expected to exceed 30% globally by 2030, a key metric highlighting the growing influence of battery technology.
Dominant Regions, Countries, or Segments in Power Battery Solutions
The Automotive application segment is undeniably the dominant force shaping the global power battery solutions market, projected to account for over 70% of the total market value by 2033. This dominance is fueled by a confluence of factors, including aggressive government initiatives to decarbonize transportation, substantial investments in EV manufacturing infrastructure, and rapidly evolving consumer preferences for electric mobility. The child market segment of electric vehicles within the broader Automotive application is the primary engine of growth.
Asia-Pacific, particularly China, stands out as the leading region, driven by its extensive battery manufacturing capabilities, strong domestic EV market, and supportive industrial policies. The presence of major battery manufacturers like EVE Power and Fujian Nebula Electronics solidifies this region's leadership. China's ambitious targets for EV adoption and its role as a global manufacturing hub for battery components give it a significant competitive edge. The market share for lithium-ion battery within this region is over 90%, reflecting its overwhelming dominance in EV and consumer electronics.
Key drivers in this dominant segment include:
- Government Incentives: Subsidies, tax credits, and charging infrastructure development programs.
- Technological Advancements: Continuous improvements in battery energy density, charging speed, and lifespan, making EVs more practical and appealing.
- Established Supply Chains: Robust ecosystems for raw material sourcing, battery cell manufacturing, and pack assembly.
- Automotive OEM Investments: Major car manufacturers are committing billions to electrify their fleets and develop new EV models.
- Consumer Acceptance: Growing environmental consciousness and the desire for lower running costs are influencing purchasing decisions.
The Automotive segment is expected to grow at a CAGR of approximately 14% from 2025 to 2033, far outpacing other segments. Within this, the Electric Vehicle (EV) sub-segment is the primary growth driver. The Commercial segment, encompassing electric trucks, buses, and delivery vehicles, is also exhibiting strong growth, driven by operational cost savings and corporate sustainability goals. The Others segment, including grid-scale energy storage and portable power solutions, is growing steadily, but its overall market share remains smaller compared to the automotive sector. The parent market is thus heavily influenced by the trends within the Automotive application, which dictates the pace of innovation and investment in power battery technologies.
Power Battery Solutions Product Landscape
The power battery solutions product landscape is dominated by lithium-ion battery technologies, including various chemistries such as Lithium Cobalt Oxide (LCO), Lithium Manganese Oxide (LMO), Lithium Nickel Manganese Cobalt Oxide (NMC), Lithium Iron Phosphate (LFP), and Lithium Titanate (LTO). Innovations are focused on increasing energy density, improving safety features, extending cycle life, and reducing charging times. Companies are also developing advanced battery management systems (BMS) to optimize performance and prevent degradation. While lead-acid battery remains relevant for certain cost-sensitive applications and in the Commercial vehicle sector for backup power, its market share is gradually declining in favor of lithium-ion. NiMH Battery continues to find applications in hybrid vehicles and specific industrial uses where its robustness and temperature tolerance are advantageous. The product landscape is also being shaped by advancements in materials science, with research into solid-state electrolytes and novel electrode materials promising even higher performance and safety in the future.
Key Drivers, Barriers & Challenges in Power Battery Solutions
The power battery solutions market is propelled by several key drivers, chief among them being the global shift towards decarbonization and the widespread adoption of electric vehicles (EVs). Government incentives, stringent emission regulations, and declining battery costs are making EVs increasingly accessible and attractive. Technological advancements in battery chemistry, energy density, and charging infrastructure are further accelerating adoption. The growing demand for renewable energy storage solutions to stabilize power grids also plays a crucial role.
However, the market faces significant barriers and challenges. The high initial cost of battery packs remains a hurdle for some consumers and commercial applications, despite declining trends. Supply chain volatility and the sourcing of critical raw materials like lithium, cobalt, and nickel present geopolitical and price risks. Manufacturing complex battery cells requires substantial capital investment, posing a barrier to entry for new players. Regulatory complexities across different regions, particularly concerning battery safety and recycling standards, can also create challenges for global expansion.
Emerging Opportunities in Power Battery Solutions
Emerging opportunities in the power battery solutions sector are vast and diverse. The development of next-generation battery technologies, such as solid-state batteries, promises enhanced safety, higher energy density, and faster charging, opening up new possibilities in EVs and consumer electronics. The expanding market for energy storage systems (ESS) for residential, commercial, and grid-scale applications presents a significant growth avenue as renewable energy sources become more prevalent. Furthermore, the increasing electrification of commercial fleets, including trucks and buses, and the burgeoning market for electric aviation and marine transport offer substantial untapped potential. Innovations in battery recycling and second-life applications are also creating a circular economy opportunity, reducing waste and lowering the environmental impact of battery production.
Growth Accelerators in the Power Battery Solutions Industry
Several factors are acting as significant growth accelerators for the power battery solutions industry. The ongoing aggressive research and development efforts by leading companies, focused on improving energy density, reducing costs, and enhancing safety, are continuously pushing the performance envelope of battery technology. Strategic partnerships and collaborations between battery manufacturers, automotive OEMs, and technology providers are fostering innovation and accelerating market penetration. Furthermore, government policies worldwide that support the transition to electric mobility and renewable energy, through subsidies, tax incentives, and infrastructure development, are directly stimulating demand. The increasing global commitment to sustainability and climate action is creating a powerful market pull for battery-powered solutions across all sectors.
Key Players Shaping the Power Battery Solutions Market
- Guangdong Lyric Robot Automation
- RoyPow
- Guangdong Huiside Automation Technology
- Fujian Nebula Electronics
- EVE Power
- Henkel
- 3M
- EV Battery Solutions
- Hexagon AB
- Parthian Battery Solutions
- Cox Automotive Inc.
- Sika Automotive
Notable Milestones in Power Battery Solutions Sector
- 2019: Significant increase in EV sales globally, driven by improved battery range and charging infrastructure expansion.
- 2020: Major automotive manufacturers announce ambitious electrification targets, signaling a strong commitment to battery-powered vehicles.
- 2021: Advancements in lithium-ion battery recycling technologies gain momentum, addressing sustainability concerns.
- 2022: Breakthroughs in solid-state battery research emerge, promising enhanced safety and energy density.
- 2023: Increased investment in battery manufacturing capacity worldwide to meet surging demand.
- 2024: Growth in the commercial electric vehicle segment accelerates, with new models and charging solutions being introduced.
In-Depth Power Battery Solutions Market Outlook
The future outlook for the power battery solutions market is exceptionally bright, driven by ongoing technological advancements and a strong global push towards electrification and sustainability. The continued innovation in battery chemistries, coupled with advancements in manufacturing processes, will lead to more affordable, efficient, and safer power battery solutions. The expansion of charging infrastructure and supportive government policies will further catalyze the widespread adoption of electric vehicles across both passenger and commercial segments. The growing demand for grid-scale energy storage will also play a pivotal role in stabilizing renewable energy integration. Strategic investments in R&D and manufacturing capacity, alongside a focus on circular economy principles through battery recycling, will solidify the long-term growth trajectory and unlock significant market potential.
Power Battery Solutions Segmentation
-
1. Application
- 1.1. Automotive
- 1.2. Commercial
- 1.3. Others
-
2. Types
- 2.1. Lithium-ion Battery
- 2.2. Lead-acid Battery
- 2.3. NiMH Battery
- 2.4. Others
Power Battery Solutions Segmentation By Geography
-
1. North America
- 1.1. United States
- 1.2. Canada
- 1.3. Mexico
-
2. South America
- 2.1. Brazil
- 2.2. Argentina
- 2.3. Rest of South America
-
3. Europe
- 3.1. United Kingdom
- 3.2. Germany
- 3.3. France
- 3.4. Italy
- 3.5. Spain
- 3.6. Russia
- 3.7. Benelux
- 3.8. Nordics
- 3.9. Rest of Europe
-
4. Middle East & Africa
- 4.1. Turkey
- 4.2. Israel
- 4.3. GCC
- 4.4. North Africa
- 4.5. South Africa
- 4.6. Rest of Middle East & Africa
-
5. Asia Pacific
- 5.1. China
- 5.2. India
- 5.3. Japan
- 5.4. South Korea
- 5.5. ASEAN
- 5.6. Oceania
- 5.7. Rest of Asia Pacific
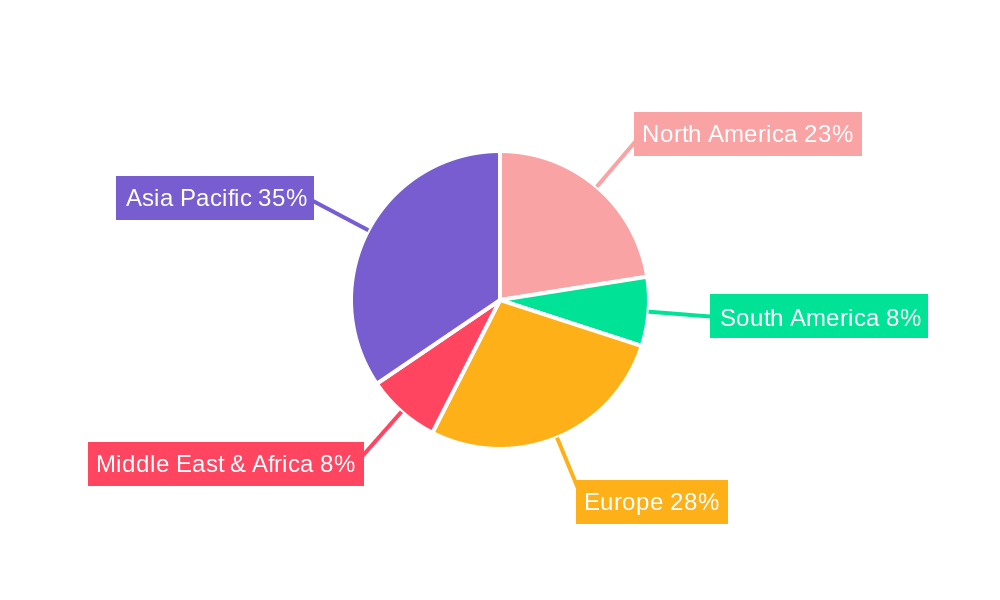
Power Battery Solutions Regional Market Share
Geographic Coverage of Power Battery Solutions
Power Battery Solutions REPORT HIGHLIGHTS
| Aspects | Details |
|---|---|
| Study Period | 2020-2034 |
| Base Year | 2025 |
| Estimated Year | 2026 |
| Forecast Period | 2026-2034 |
| Historical Period | 2020-2025 |
| Growth Rate | CAGR of 10.3% from 2020-2034 |
| Segmentation |
|
Table of Contents
- 1. Introduction
- 1.1. Research Scope
- 1.2. Market Segmentation
- 1.3. Research Methodology
- 1.4. Definitions and Assumptions
- 2. Executive Summary
- 2.1. Introduction
- 3. Market Dynamics
- 3.1. Introduction
- 3.2. Market Drivers
- 3.3. Market Restrains
- 3.4. Market Trends
- 4. Market Factor Analysis
- 4.1. Porters Five Forces
- 4.2. Supply/Value Chain
- 4.3. PESTEL analysis
- 4.4. Market Entropy
- 4.5. Patent/Trademark Analysis
- 5. Global Power Battery Solutions Analysis, Insights and Forecast, 2020-2032
- 5.1. Market Analysis, Insights and Forecast - by Application
- 5.1.1. Automotive
- 5.1.2. Commercial
- 5.1.3. Others
- 5.2. Market Analysis, Insights and Forecast - by Types
- 5.2.1. Lithium-ion Battery
- 5.2.2. Lead-acid Battery
- 5.2.3. NiMH Battery
- 5.2.4. Others
- 5.3. Market Analysis, Insights and Forecast - by Region
- 5.3.1. North America
- 5.3.2. South America
- 5.3.3. Europe
- 5.3.4. Middle East & Africa
- 5.3.5. Asia Pacific
- 5.1. Market Analysis, Insights and Forecast - by Application
- 6. North America Power Battery Solutions Analysis, Insights and Forecast, 2020-2032
- 6.1. Market Analysis, Insights and Forecast - by Application
- 6.1.1. Automotive
- 6.1.2. Commercial
- 6.1.3. Others
- 6.2. Market Analysis, Insights and Forecast - by Types
- 6.2.1. Lithium-ion Battery
- 6.2.2. Lead-acid Battery
- 6.2.3. NiMH Battery
- 6.2.4. Others
- 6.1. Market Analysis, Insights and Forecast - by Application
- 7. South America Power Battery Solutions Analysis, Insights and Forecast, 2020-2032
- 7.1. Market Analysis, Insights and Forecast - by Application
- 7.1.1. Automotive
- 7.1.2. Commercial
- 7.1.3. Others
- 7.2. Market Analysis, Insights and Forecast - by Types
- 7.2.1. Lithium-ion Battery
- 7.2.2. Lead-acid Battery
- 7.2.3. NiMH Battery
- 7.2.4. Others
- 7.1. Market Analysis, Insights and Forecast - by Application
- 8. Europe Power Battery Solutions Analysis, Insights and Forecast, 2020-2032
- 8.1. Market Analysis, Insights and Forecast - by Application
- 8.1.1. Automotive
- 8.1.2. Commercial
- 8.1.3. Others
- 8.2. Market Analysis, Insights and Forecast - by Types
- 8.2.1. Lithium-ion Battery
- 8.2.2. Lead-acid Battery
- 8.2.3. NiMH Battery
- 8.2.4. Others
- 8.1. Market Analysis, Insights and Forecast - by Application
- 9. Middle East & Africa Power Battery Solutions Analysis, Insights and Forecast, 2020-2032
- 9.1. Market Analysis, Insights and Forecast - by Application
- 9.1.1. Automotive
- 9.1.2. Commercial
- 9.1.3. Others
- 9.2. Market Analysis, Insights and Forecast - by Types
- 9.2.1. Lithium-ion Battery
- 9.2.2. Lead-acid Battery
- 9.2.3. NiMH Battery
- 9.2.4. Others
- 9.1. Market Analysis, Insights and Forecast - by Application
- 10. Asia Pacific Power Battery Solutions Analysis, Insights and Forecast, 2020-2032
- 10.1. Market Analysis, Insights and Forecast - by Application
- 10.1.1. Automotive
- 10.1.2. Commercial
- 10.1.3. Others
- 10.2. Market Analysis, Insights and Forecast - by Types
- 10.2.1. Lithium-ion Battery
- 10.2.2. Lead-acid Battery
- 10.2.3. NiMH Battery
- 10.2.4. Others
- 10.1. Market Analysis, Insights and Forecast - by Application
- 11. Competitive Analysis
- 11.1. Global Market Share Analysis 2025
- 11.2. Company Profiles
- 11.2.1 Guangdong Lyric Robot Automation
- 11.2.1.1. Overview
- 11.2.1.2. Products
- 11.2.1.3. SWOT Analysis
- 11.2.1.4. Recent Developments
- 11.2.1.5. Financials (Based on Availability)
- 11.2.2 RoyPow
- 11.2.2.1. Overview
- 11.2.2.2. Products
- 11.2.2.3. SWOT Analysis
- 11.2.2.4. Recent Developments
- 11.2.2.5. Financials (Based on Availability)
- 11.2.3 Guangdong Huiside Automation Technology
- 11.2.3.1. Overview
- 11.2.3.2. Products
- 11.2.3.3. SWOT Analysis
- 11.2.3.4. Recent Developments
- 11.2.3.5. Financials (Based on Availability)
- 11.2.4 Fujian Nebula Electronics
- 11.2.4.1. Overview
- 11.2.4.2. Products
- 11.2.4.3. SWOT Analysis
- 11.2.4.4. Recent Developments
- 11.2.4.5. Financials (Based on Availability)
- 11.2.5 EVE Power
- 11.2.5.1. Overview
- 11.2.5.2. Products
- 11.2.5.3. SWOT Analysis
- 11.2.5.4. Recent Developments
- 11.2.5.5. Financials (Based on Availability)
- 11.2.6 Henkel
- 11.2.6.1. Overview
- 11.2.6.2. Products
- 11.2.6.3. SWOT Analysis
- 11.2.6.4. Recent Developments
- 11.2.6.5. Financials (Based on Availability)
- 11.2.7 3M
- 11.2.7.1. Overview
- 11.2.7.2. Products
- 11.2.7.3. SWOT Analysis
- 11.2.7.4. Recent Developments
- 11.2.7.5. Financials (Based on Availability)
- 11.2.8 EV Battery Solutions
- 11.2.8.1. Overview
- 11.2.8.2. Products
- 11.2.8.3. SWOT Analysis
- 11.2.8.4. Recent Developments
- 11.2.8.5. Financials (Based on Availability)
- 11.2.9 Hexagon AB
- 11.2.9.1. Overview
- 11.2.9.2. Products
- 11.2.9.3. SWOT Analysis
- 11.2.9.4. Recent Developments
- 11.2.9.5. Financials (Based on Availability)
- 11.2.10 Parthian Battery Solutions
- 11.2.10.1. Overview
- 11.2.10.2. Products
- 11.2.10.3. SWOT Analysis
- 11.2.10.4. Recent Developments
- 11.2.10.5. Financials (Based on Availability)
- 11.2.11 Cox Automotive Inc.
- 11.2.11.1. Overview
- 11.2.11.2. Products
- 11.2.11.3. SWOT Analysis
- 11.2.11.4. Recent Developments
- 11.2.11.5. Financials (Based on Availability)
- 11.2.12 Sika Automotive
- 11.2.12.1. Overview
- 11.2.12.2. Products
- 11.2.12.3. SWOT Analysis
- 11.2.12.4. Recent Developments
- 11.2.12.5. Financials (Based on Availability)
- 11.2.1 Guangdong Lyric Robot Automation
List of Figures
- Figure 1: Global Power Battery Solutions Revenue Breakdown (billion, %) by Region 2025 & 2033
- Figure 2: North America Power Battery Solutions Revenue (billion), by Application 2025 & 2033
- Figure 3: North America Power Battery Solutions Revenue Share (%), by Application 2025 & 2033
- Figure 4: North America Power Battery Solutions Revenue (billion), by Types 2025 & 2033
- Figure 5: North America Power Battery Solutions Revenue Share (%), by Types 2025 & 2033
- Figure 6: North America Power Battery Solutions Revenue (billion), by Country 2025 & 2033
- Figure 7: North America Power Battery Solutions Revenue Share (%), by Country 2025 & 2033
- Figure 8: South America Power Battery Solutions Revenue (billion), by Application 2025 & 2033
- Figure 9: South America Power Battery Solutions Revenue Share (%), by Application 2025 & 2033
- Figure 10: South America Power Battery Solutions Revenue (billion), by Types 2025 & 2033
- Figure 11: South America Power Battery Solutions Revenue Share (%), by Types 2025 & 2033
- Figure 12: South America Power Battery Solutions Revenue (billion), by Country 2025 & 2033
- Figure 13: South America Power Battery Solutions Revenue Share (%), by Country 2025 & 2033
- Figure 14: Europe Power Battery Solutions Revenue (billion), by Application 2025 & 2033
- Figure 15: Europe Power Battery Solutions Revenue Share (%), by Application 2025 & 2033
- Figure 16: Europe Power Battery Solutions Revenue (billion), by Types 2025 & 2033
- Figure 17: Europe Power Battery Solutions Revenue Share (%), by Types 2025 & 2033
- Figure 18: Europe Power Battery Solutions Revenue (billion), by Country 2025 & 2033
- Figure 19: Europe Power Battery Solutions Revenue Share (%), by Country 2025 & 2033
- Figure 20: Middle East & Africa Power Battery Solutions Revenue (billion), by Application 2025 & 2033
- Figure 21: Middle East & Africa Power Battery Solutions Revenue Share (%), by Application 2025 & 2033
- Figure 22: Middle East & Africa Power Battery Solutions Revenue (billion), by Types 2025 & 2033
- Figure 23: Middle East & Africa Power Battery Solutions Revenue Share (%), by Types 2025 & 2033
- Figure 24: Middle East & Africa Power Battery Solutions Revenue (billion), by Country 2025 & 2033
- Figure 25: Middle East & Africa Power Battery Solutions Revenue Share (%), by Country 2025 & 2033
- Figure 26: Asia Pacific Power Battery Solutions Revenue (billion), by Application 2025 & 2033
- Figure 27: Asia Pacific Power Battery Solutions Revenue Share (%), by Application 2025 & 2033
- Figure 28: Asia Pacific Power Battery Solutions Revenue (billion), by Types 2025 & 2033
- Figure 29: Asia Pacific Power Battery Solutions Revenue Share (%), by Types 2025 & 2033
- Figure 30: Asia Pacific Power Battery Solutions Revenue (billion), by Country 2025 & 2033
- Figure 31: Asia Pacific Power Battery Solutions Revenue Share (%), by Country 2025 & 2033
List of Tables
- Table 1: Global Power Battery Solutions Revenue billion Forecast, by Application 2020 & 2033
- Table 2: Global Power Battery Solutions Revenue billion Forecast, by Types 2020 & 2033
- Table 3: Global Power Battery Solutions Revenue billion Forecast, by Region 2020 & 2033
- Table 4: Global Power Battery Solutions Revenue billion Forecast, by Application 2020 & 2033
- Table 5: Global Power Battery Solutions Revenue billion Forecast, by Types 2020 & 2033
- Table 6: Global Power Battery Solutions Revenue billion Forecast, by Country 2020 & 2033
- Table 7: United States Power Battery Solutions Revenue (billion) Forecast, by Application 2020 & 2033
- Table 8: Canada Power Battery Solutions Revenue (billion) Forecast, by Application 2020 & 2033
- Table 9: Mexico Power Battery Solutions Revenue (billion) Forecast, by Application 2020 & 2033
- Table 10: Global Power Battery Solutions Revenue billion Forecast, by Application 2020 & 2033
- Table 11: Global Power Battery Solutions Revenue billion Forecast, by Types 2020 & 2033
- Table 12: Global Power Battery Solutions Revenue billion Forecast, by Country 2020 & 2033
- Table 13: Brazil Power Battery Solutions Revenue (billion) Forecast, by Application 2020 & 2033
- Table 14: Argentina Power Battery Solutions Revenue (billion) Forecast, by Application 2020 & 2033
- Table 15: Rest of South America Power Battery Solutions Revenue (billion) Forecast, by Application 2020 & 2033
- Table 16: Global Power Battery Solutions Revenue billion Forecast, by Application 2020 & 2033
- Table 17: Global Power Battery Solutions Revenue billion Forecast, by Types 2020 & 2033
- Table 18: Global Power Battery Solutions Revenue billion Forecast, by Country 2020 & 2033
- Table 19: United Kingdom Power Battery Solutions Revenue (billion) Forecast, by Application 2020 & 2033
- Table 20: Germany Power Battery Solutions Revenue (billion) Forecast, by Application 2020 & 2033
- Table 21: France Power Battery Solutions Revenue (billion) Forecast, by Application 2020 & 2033
- Table 22: Italy Power Battery Solutions Revenue (billion) Forecast, by Application 2020 & 2033
- Table 23: Spain Power Battery Solutions Revenue (billion) Forecast, by Application 2020 & 2033
- Table 24: Russia Power Battery Solutions Revenue (billion) Forecast, by Application 2020 & 2033
- Table 25: Benelux Power Battery Solutions Revenue (billion) Forecast, by Application 2020 & 2033
- Table 26: Nordics Power Battery Solutions Revenue (billion) Forecast, by Application 2020 & 2033
- Table 27: Rest of Europe Power Battery Solutions Revenue (billion) Forecast, by Application 2020 & 2033
- Table 28: Global Power Battery Solutions Revenue billion Forecast, by Application 2020 & 2033
- Table 29: Global Power Battery Solutions Revenue billion Forecast, by Types 2020 & 2033
- Table 30: Global Power Battery Solutions Revenue billion Forecast, by Country 2020 & 2033
- Table 31: Turkey Power Battery Solutions Revenue (billion) Forecast, by Application 2020 & 2033
- Table 32: Israel Power Battery Solutions Revenue (billion) Forecast, by Application 2020 & 2033
- Table 33: GCC Power Battery Solutions Revenue (billion) Forecast, by Application 2020 & 2033
- Table 34: North Africa Power Battery Solutions Revenue (billion) Forecast, by Application 2020 & 2033
- Table 35: South Africa Power Battery Solutions Revenue (billion) Forecast, by Application 2020 & 2033
- Table 36: Rest of Middle East & Africa Power Battery Solutions Revenue (billion) Forecast, by Application 2020 & 2033
- Table 37: Global Power Battery Solutions Revenue billion Forecast, by Application 2020 & 2033
- Table 38: Global Power Battery Solutions Revenue billion Forecast, by Types 2020 & 2033
- Table 39: Global Power Battery Solutions Revenue billion Forecast, by Country 2020 & 2033
- Table 40: China Power Battery Solutions Revenue (billion) Forecast, by Application 2020 & 2033
- Table 41: India Power Battery Solutions Revenue (billion) Forecast, by Application 2020 & 2033
- Table 42: Japan Power Battery Solutions Revenue (billion) Forecast, by Application 2020 & 2033
- Table 43: South Korea Power Battery Solutions Revenue (billion) Forecast, by Application 2020 & 2033
- Table 44: ASEAN Power Battery Solutions Revenue (billion) Forecast, by Application 2020 & 2033
- Table 45: Oceania Power Battery Solutions Revenue (billion) Forecast, by Application 2020 & 2033
- Table 46: Rest of Asia Pacific Power Battery Solutions Revenue (billion) Forecast, by Application 2020 & 2033
Frequently Asked Questions
1. What is the projected Compound Annual Growth Rate (CAGR) of the Power Battery Solutions?
The projected CAGR is approximately 10.3%.
2. Which companies are prominent players in the Power Battery Solutions?
Key companies in the market include Guangdong Lyric Robot Automation, RoyPow, Guangdong Huiside Automation Technology, Fujian Nebula Electronics, EVE Power, Henkel, 3M, EV Battery Solutions, Hexagon AB, Parthian Battery Solutions, Cox Automotive Inc., Sika Automotive.
3. What are the main segments of the Power Battery Solutions?
The market segments include Application, Types.
4. Can you provide details about the market size?
The market size is estimated to be USD 16.04 billion as of 2022.
5. What are some drivers contributing to market growth?
N/A
6. What are the notable trends driving market growth?
N/A
7. Are there any restraints impacting market growth?
N/A
8. Can you provide examples of recent developments in the market?
N/A
9. What pricing options are available for accessing the report?
Pricing options include single-user, multi-user, and enterprise licenses priced at USD 4350.00, USD 6525.00, and USD 8700.00 respectively.
10. Is the market size provided in terms of value or volume?
The market size is provided in terms of value, measured in billion.
11. Are there any specific market keywords associated with the report?
Yes, the market keyword associated with the report is "Power Battery Solutions," which aids in identifying and referencing the specific market segment covered.
12. How do I determine which pricing option suits my needs best?
The pricing options vary based on user requirements and access needs. Individual users may opt for single-user licenses, while businesses requiring broader access may choose multi-user or enterprise licenses for cost-effective access to the report.
13. Are there any additional resources or data provided in the Power Battery Solutions report?
While the report offers comprehensive insights, it's advisable to review the specific contents or supplementary materials provided to ascertain if additional resources or data are available.
14. How can I stay updated on further developments or reports in the Power Battery Solutions?
To stay informed about further developments, trends, and reports in the Power Battery Solutions, consider subscribing to industry newsletters, following relevant companies and organizations, or regularly checking reputable industry news sources and publications.
Methodology
Step 1 - Identification of Relevant Samples Size from Population Database


Step 2 - Approaches for Defining Global Market Size (Value, Volume* & Price*)

Note*: In applicable scenarios
Step 3 - Data Sources
Primary Research
- Web Analytics
- Survey Reports
- Research Institute
- Latest Research Reports
- Opinion Leaders
Secondary Research
- Annual Reports
- White Paper
- Latest Press Release
- Industry Association
- Paid Database
- Investor Presentations

Step 4 - Data Triangulation
Involves using different sources of information in order to increase the validity of a study
These sources are likely to be stakeholders in a program - participants, other researchers, program staff, other community members, and so on.
Then we put all data in single framework & apply various statistical tools to find out the dynamic on the market.
During the analysis stage, feedback from the stakeholder groups would be compared to determine areas of agreement as well as areas of divergence