

Key Insights
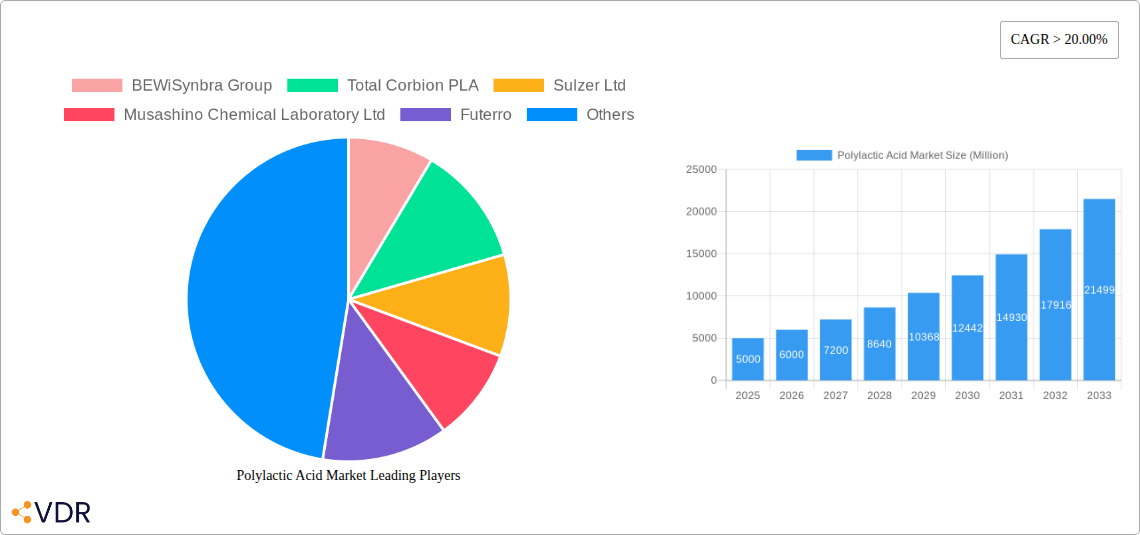
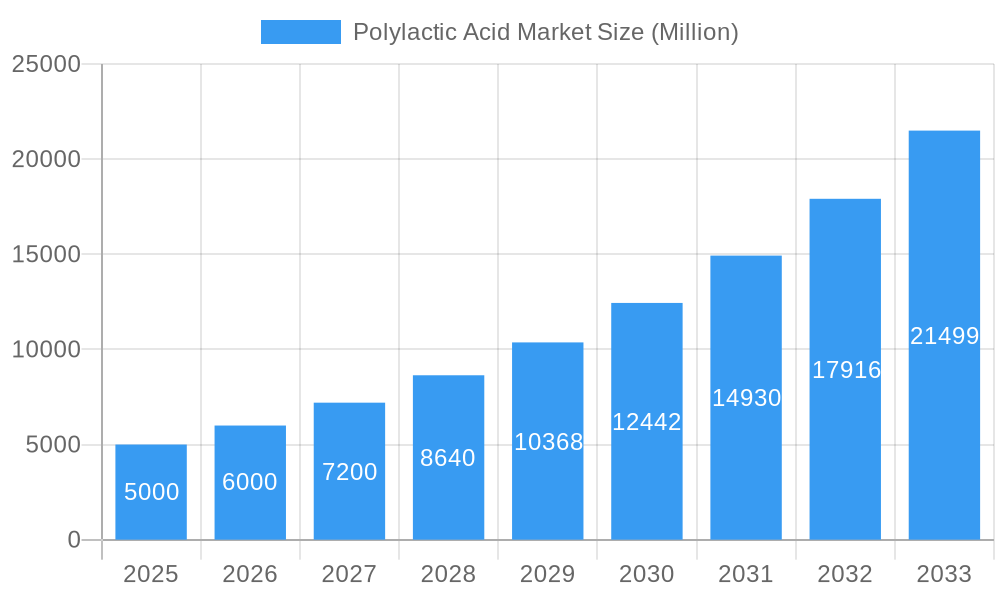
The global Polylactic Acid (PLA) market is experiencing robust expansion, driven by escalating demand for sustainable and biodegradable materials across diverse industries. With a projected Compound Annual Growth Rate (CAGR) of 17.5%, the market is forecast to reach $2.01 billion by 2025. This growth is underpinned by increasing consumer environmental awareness and stringent regulations advocating for eco-friendly alternatives to conventional plastics. The packaging sector is a primary beneficiary, utilizing PLA's biodegradability for films, sheets, and coatings. Emerging applications in the medical and electronics industries, leveraging PLA's biocompatibility for implants and components, also contribute significantly. While corn, cassava, and sugarcane are key raw materials, R&D efforts are focused on diversifying sources and enhancing production efficiency to meet surging demand. Key players like NatureWorks LLC, BASF SE, and Total Corbion PLA, alongside emerging regional competitors, foster innovation and price competitiveness. Asia Pacific, North America, and Europe lead geographical expansion, with China and the United States spearheading regional markets due to substantial investments in sustainable packaging and government support for biodegradable materials. Challenges include raw material cost fluctuations and the need for performance characteristic advancements, yet the outlook remains exceptionally positive. The market's trajectory is further supported by continuous application diversification and growing eco-conscious consumer behavior.
Polylactic Acid Market Market Size (In Billion)
The PLA market's segmentation across raw materials, forms, and end-user industries underscores its application diversity. Corn-based PLA is expected to maintain dominance, with diversification into cassava and sugarcane addressing supply chain stability and cost-effectiveness. The packaging segment will retain its significant market share, complemented by growing contributions from medical, electronics, and agricultural applications. The Asia-Pacific region is anticipated to exhibit the highest growth, fueled by industrialization and evolving environmental regulations. Sustained growth necessitates significant R&D investment to enhance PLA's mechanical properties, processing efficiency, and cost-competitiveness against conventional plastics, thereby unlocking new applications and solidifying PLA's role in the sustainable materials landscape.
Polylactic Acid Market Company Market Share
Polylactic Acid (PLA) Market Report: 2019-2033
This comprehensive report provides a detailed analysis of the Polylactic Acid (PLA) market, encompassing market dynamics, growth trends, regional dominance, product landscape, key players, and future outlook. The study period covers 2019-2033, with 2025 serving as the base and estimated year. The report is crucial for businesses, investors, and researchers seeking to understand and capitalize on opportunities within the bioplastics sector and its parent market, the biodegradable plastics industry, and its child markets such as food packaging and medical applications.
Keywords: Polylactic Acid, PLA, Bioplastics, Biodegradable Plastics, Corn, Cassava, Sugarcane, Packaging, Medical, Biobased Plastics, Market Size, Market Share, CAGR, NatureWorks LLC, BASF SE, Total Corbion PLA, Danimer Scientific, Sulzer Ltd, Market Analysis, Market Forecast, Industry Trends, Growth Opportunities.
Polylactic Acid Market Market Dynamics & Structure
The Polylactic Acid (PLA) market is experiencing dynamic growth driven by increasing environmental concerns and stringent regulations on conventional plastics. Market concentration is moderate, with several key players competing, although some regional dominance is noted. Technological innovation centers around improving PLA's performance characteristics, cost-effectiveness, and expanding its applications. Stringent regulatory frameworks promoting bio-based and biodegradable materials further fuel market expansion. PLA faces competition from other bioplastics, such as PHA, and also from recycled conventional plastics.
- Market Concentration: Moderately concentrated, with top 5 players holding approximately xx% market share in 2025.
- Technological Innovation: Focus on enhanced biodegradability, improved mechanical properties (strength, flexibility), and cost reduction via process optimization.
- Regulatory Framework: Favorable government policies and initiatives promoting bioplastics usage in various sectors (packaging, agriculture, etc.) are accelerating adoption.
- Competitive Substitutes: PHA, starch-based plastics, and recycled PET pose some competitive pressure.
- End-user Demographics: Growth driven by increased environmental awareness among consumers and businesses.
- M&A Trends: xx M&A deals were recorded in the PLA market between 2019 and 2024, indicating consolidation and expansion strategies among key players.
Polylactic Acid Market Growth Trends & Insights
The global Polylactic Acid market is projected to witness significant growth during the forecast period (2025-2033). Driven by rising demand for eco-friendly alternatives to traditional plastics, the market is poised for expansion across diverse end-use industries. The market size reached xx Million units in 2024 and is estimated to grow at a CAGR of xx% during the forecast period, reaching xx Million units by 2033. This robust growth is fueled by factors such as increasing consumer awareness of environmental sustainability, stringent government regulations promoting biodegradable plastics, and technological advancements that improve the functionality and cost-effectiveness of PLA. Market penetration is also increasing in several regions due to successful government initiatives.
Dominant Regions, Countries, or Segments in Polylactic Acid Market
The Asia-Pacific region is currently the dominant market for PLA, followed by North America and Europe. High population density, growing industrial activities, and a supportive regulatory environment contribute to the region's dominance. Within the raw materials segment, corn currently holds the largest share, followed by sugarcane and cassava. In terms of form, films and sheets constitute the largest segment, driven by the high demand from the packaging industry. The packaging industry itself remains the largest end-user sector.
- Key Drivers (Asia-Pacific): Strong economic growth, rising disposable incomes, and increasing awareness of sustainability issues.
- Key Drivers (Packaging): Growing demand for sustainable food packaging solutions, stringent government regulations related to plastic waste management.
- Market Share: Asia-Pacific holds approximately xx% of the global PLA market in 2025.
Polylactic Acid Market Product Landscape
The PLA market showcases continuous product innovation, with advancements focusing on improved barrier properties, enhanced thermal stability, and increased biodegradability in various environments. These innovations expand the applicability of PLA across diverse sectors, enhancing its competitiveness against traditional plastics. Unique selling propositions revolve around sustainability credentials, biodegradability, and compostability, aligning with consumer preferences and environmental regulations.
Key Drivers, Barriers & Challenges in Polylactic Acid Market
Key Drivers:
- Growing demand for eco-friendly materials
- Stringent government regulations on plastic waste
- Rising consumer awareness of sustainability
- Technological advancements improving PLA properties and reducing costs.
Challenges and Restraints:
- High production costs compared to traditional plastics
- Limited availability of suitable feedstocks in some regions
- Lack of standardization in biodegradability testing and certification
- Competition from other bioplastics and recycled plastics
Emerging Opportunities in Polylactic Acid Market
Untapped markets in developing economies present significant opportunities. Innovative applications in the construction and consumer goods industries, particularly for disposable and short-term-use items, are gaining traction. Evolving consumer preferences for sustainable and eco-conscious products are driving demand.
Growth Accelerators in the Polylactic Acid Market Industry
Technological breakthroughs, such as improved polymerization techniques and additive manufacturing compatibility, are key growth accelerators. Strategic partnerships between PLA manufacturers and end-users, facilitating large-scale adoption, are boosting market expansion. Expansion into new geographical markets, particularly in developing countries, is another key growth driver.
Key Players Shaping the Polylactic Acid Market Market
- BEWiSynbra Group
- Total Corbion PLA
- Sulzer Ltd
- Musashino Chemical Laboratory Ltd
- Futerro
- BASF SE
- Esun
- Zhejiang Hisun Biomaterials Co Ltd
- Shanghai Tong Jie Liang Biomaterials Co Ltd
- NatureWorks LLC
- Cofco
- Polysciences Inc
- Weforyou
- Jiangxi Keyuan Bio-Material Co Ltd
- Danimer Scientific
Notable Milestones in Polylactic Acid Market Sector
- September 2023: Danimer Scientific's collaboration with Chevron Phillips Chemical to develop high-volume biodegradable plastic products using Rinnovo polymers signals a major step towards increased PLA market penetration.
- May 2023: Sulzer's agreement with Jindan New Biomaterials to produce up to 750,000 tonnes of PLA annually highlights substantial capacity expansion and strengthens the market's supply chain.
In-Depth Polylactic Acid Market Market Outlook
The future of the Polylactic Acid market is bright, driven by the ongoing shift towards sustainable materials and the continuous improvement in PLA's cost-effectiveness and performance. Strategic collaborations, technological breakthroughs, and expanding applications across various sectors suggest significant growth potential in the coming years. The market is poised to capitalize on the increasing demand for eco-friendly packaging, biomedical applications, and other sustainable solutions.
Polylactic Acid Market Segmentation
-
1. Raw Material
- 1.1. Corn
- 1.2. Cassava
- 1.3. Sugarcane and Sugar Beet
- 1.4. Other Raw Materials(molasses, potato, wheat)
-
2. Form
- 2.1. Fiber
- 2.2. Films and Sheets
- 2.3. Coatings
- 2.4. Other Forms
-
3. End-user Industry
- 3.1. Packaging
- 3.2. Medical
- 3.3. Electronics
- 3.4. Agriculture
- 3.5. Textiles
- 3.6. Other En
Polylactic Acid Market Segmentation By Geography
-
1. Asia Pacific
- 1.1. China
- 1.2. India
- 1.3. Japan
- 1.4. South Korea
- 1.5. ASEAN Countries
- 1.6. Rest of Asia Pacific
-
2. North America
- 2.1. United States
- 2.2. Canada
- 2.3. Mexico
-
3. Europe
- 3.1. Germany
- 3.2. United Kingdom
- 3.3. France
- 3.4. Italy
- 3.5. CIS region
- 3.6. Rest of Europe
-
4. South America
- 4.1. Brazil
- 4.2. Argentina
- 4.3. Rest of South America
-
5. Middle East and Africa
- 5.1. Saudi Arabia
- 5.2. South Africa
- 5.3. Rest of Middle East and Africa
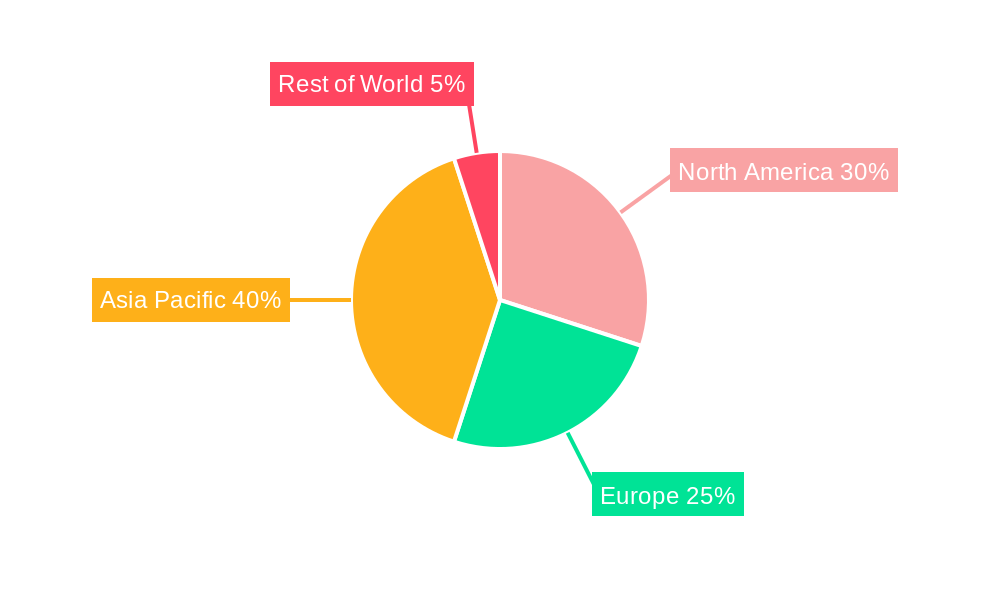
Polylactic Acid Market Regional Market Share
Geographic Coverage of Polylactic Acid Market
Polylactic Acid Market REPORT HIGHLIGHTS
| Aspects | Details |
|---|---|
| Study Period | 2020-2034 |
| Base Year | 2025 |
| Estimated Year | 2026 |
| Forecast Period | 2026-2034 |
| Historical Period | 2020-2025 |
| Growth Rate | CAGR of 17.5% from 2020-2034 |
| Segmentation |
|
Table of Contents
- 1. Introduction
- 1.1. Research Scope
- 1.2. Market Segmentation
- 1.3. Research Objective
- 1.4. Definitions and Assumptions
- 2. Executive Summary
- 2.1. Market Snapshot
- 3. Market Dynamics
- 3.1. Market Drivers
- 3.2. Market Restrains
- 3.3. Market Trends
- 3.4. Market Opportunities
- 4. Market Factor Analysis
- 4.1. Porters Five Forces
- 4.1.1. Bargaining Power of Suppliers
- 4.1.2. Bargaining Power of Buyers
- 4.1.3. Threat of New Entrants
- 4.1.4. Threat of Substitutes
- 4.1.5. Competitive Rivalry
- 4.2. PESTEL analysis
- 4.3. BCG Analysis
- 4.3.1. Stars (High Growth, High Market Share)
- 4.3.2. Cash Cows (Low Growth, High Market Share)
- 4.3.3. Question Mark (High Growth, Low Market Share)
- 4.3.4. Dogs (Low Growth, Low Market Share)
- 4.4. Ansoff Matrix Analysis
- 4.5. Supply Chain Analysis
- 4.6. Regulatory Landscape
- 4.7. Current Market Potential and Opportunity Assessment (TAM–SAM–SOM Framework)
- 4.8. VDR Analyst Note
- 4.1. Porters Five Forces
- 5. Market Analysis, Insights and Forecast 2021-2033
- 5.1. Market Analysis, Insights and Forecast - by Raw Material
- 5.1.1. Corn
- 5.1.2. Cassava
- 5.1.3. Sugarcane and Sugar Beet
- 5.1.4. Other Raw Materials(molasses, potato, wheat)
- 5.2. Market Analysis, Insights and Forecast - by Form
- 5.2.1. Fiber
- 5.2.2. Films and Sheets
- 5.2.3. Coatings
- 5.2.4. Other Forms
- 5.3. Market Analysis, Insights and Forecast - by End-user Industry
- 5.3.1. Packaging
- 5.3.2. Medical
- 5.3.3. Electronics
- 5.3.4. Agriculture
- 5.3.5. Textiles
- 5.3.6. Other En
- 5.4. Market Analysis, Insights and Forecast - by Region
- 5.4.1. Asia Pacific
- 5.4.2. North America
- 5.4.3. Europe
- 5.4.4. South America
- 5.4.5. Middle East and Africa
- 5.1. Market Analysis, Insights and Forecast - by Raw Material
- 6. Global Polylactic Acid Market Analysis, Insights and Forecast, 2021-2033
- 6.1. Market Analysis, Insights and Forecast - by Raw Material
- 6.1.1. Corn
- 6.1.2. Cassava
- 6.1.3. Sugarcane and Sugar Beet
- 6.1.4. Other Raw Materials(molasses, potato, wheat)
- 6.2. Market Analysis, Insights and Forecast - by Form
- 6.2.1. Fiber
- 6.2.2. Films and Sheets
- 6.2.3. Coatings
- 6.2.4. Other Forms
- 6.3. Market Analysis, Insights and Forecast - by End-user Industry
- 6.3.1. Packaging
- 6.3.2. Medical
- 6.3.3. Electronics
- 6.3.4. Agriculture
- 6.3.5. Textiles
- 6.3.6. Other En
- 6.1. Market Analysis, Insights and Forecast - by Raw Material
- 7. Asia Pacific Polylactic Acid Market Analysis, Insights and Forecast, 2021-2033
- 7.1. Market Analysis, Insights and Forecast - by Raw Material
- 7.1.1. Corn
- 7.1.2. Cassava
- 7.1.3. Sugarcane and Sugar Beet
- 7.1.4. Other Raw Materials(molasses, potato, wheat)
- 7.2. Market Analysis, Insights and Forecast - by Form
- 7.2.1. Fiber
- 7.2.2. Films and Sheets
- 7.2.3. Coatings
- 7.2.4. Other Forms
- 7.3. Market Analysis, Insights and Forecast - by End-user Industry
- 7.3.1. Packaging
- 7.3.2. Medical
- 7.3.3. Electronics
- 7.3.4. Agriculture
- 7.3.5. Textiles
- 7.3.6. Other En
- 7.1. Market Analysis, Insights and Forecast - by Raw Material
- 8. North America Polylactic Acid Market Analysis, Insights and Forecast, 2021-2033
- 8.1. Market Analysis, Insights and Forecast - by Raw Material
- 8.1.1. Corn
- 8.1.2. Cassava
- 8.1.3. Sugarcane and Sugar Beet
- 8.1.4. Other Raw Materials(molasses, potato, wheat)
- 8.2. Market Analysis, Insights and Forecast - by Form
- 8.2.1. Fiber
- 8.2.2. Films and Sheets
- 8.2.3. Coatings
- 8.2.4. Other Forms
- 8.3. Market Analysis, Insights and Forecast - by End-user Industry
- 8.3.1. Packaging
- 8.3.2. Medical
- 8.3.3. Electronics
- 8.3.4. Agriculture
- 8.3.5. Textiles
- 8.3.6. Other En
- 8.1. Market Analysis, Insights and Forecast - by Raw Material
- 9. Europe Polylactic Acid Market Analysis, Insights and Forecast, 2021-2033
- 9.1. Market Analysis, Insights and Forecast - by Raw Material
- 9.1.1. Corn
- 9.1.2. Cassava
- 9.1.3. Sugarcane and Sugar Beet
- 9.1.4. Other Raw Materials(molasses, potato, wheat)
- 9.2. Market Analysis, Insights and Forecast - by Form
- 9.2.1. Fiber
- 9.2.2. Films and Sheets
- 9.2.3. Coatings
- 9.2.4. Other Forms
- 9.3. Market Analysis, Insights and Forecast - by End-user Industry
- 9.3.1. Packaging
- 9.3.2. Medical
- 9.3.3. Electronics
- 9.3.4. Agriculture
- 9.3.5. Textiles
- 9.3.6. Other En
- 9.1. Market Analysis, Insights and Forecast - by Raw Material
- 10. South America Polylactic Acid Market Analysis, Insights and Forecast, 2021-2033
- 10.1. Market Analysis, Insights and Forecast - by Raw Material
- 10.1.1. Corn
- 10.1.2. Cassava
- 10.1.3. Sugarcane and Sugar Beet
- 10.1.4. Other Raw Materials(molasses, potato, wheat)
- 10.2. Market Analysis, Insights and Forecast - by Form
- 10.2.1. Fiber
- 10.2.2. Films and Sheets
- 10.2.3. Coatings
- 10.2.4. Other Forms
- 10.3. Market Analysis, Insights and Forecast - by End-user Industry
- 10.3.1. Packaging
- 10.3.2. Medical
- 10.3.3. Electronics
- 10.3.4. Agriculture
- 10.3.5. Textiles
- 10.3.6. Other En
- 10.1. Market Analysis, Insights and Forecast - by Raw Material
- 11. Middle East and Africa Polylactic Acid Market Analysis, Insights and Forecast, 2021-2033
- 11.1. Market Analysis, Insights and Forecast - by Raw Material
- 11.1.1. Corn
- 11.1.2. Cassava
- 11.1.3. Sugarcane and Sugar Beet
- 11.1.4. Other Raw Materials(molasses, potato, wheat)
- 11.2. Market Analysis, Insights and Forecast - by Form
- 11.2.1. Fiber
- 11.2.2. Films and Sheets
- 11.2.3. Coatings
- 11.2.4. Other Forms
- 11.3. Market Analysis, Insights and Forecast - by End-user Industry
- 11.3.1. Packaging
- 11.3.2. Medical
- 11.3.3. Electronics
- 11.3.4. Agriculture
- 11.3.5. Textiles
- 11.3.6. Other En
- 11.1. Market Analysis, Insights and Forecast - by Raw Material
- 12. Competitive Analysis
- 12.1. Company Profiles
- 12.1.1 BEWiSynbra Group
- 12.1.1.1. Company Overview
- 12.1.1.2. Products
- 12.1.1.3. Company Financials
- 12.1.1.4. SWOT Analysis
- 12.1.2 Total Corbion PLA
- 12.1.2.1. Company Overview
- 12.1.2.2. Products
- 12.1.2.3. Company Financials
- 12.1.2.4. SWOT Analysis
- 12.1.3 Sulzer Ltd
- 12.1.3.1. Company Overview
- 12.1.3.2. Products
- 12.1.3.3. Company Financials
- 12.1.3.4. SWOT Analysis
- 12.1.4 Musashino Chemical Laboratory Ltd
- 12.1.4.1. Company Overview
- 12.1.4.2. Products
- 12.1.4.3. Company Financials
- 12.1.4.4. SWOT Analysis
- 12.1.5 Futerro
- 12.1.5.1. Company Overview
- 12.1.5.2. Products
- 12.1.5.3. Company Financials
- 12.1.5.4. SWOT Analysis
- 12.1.6 BASF SE
- 12.1.6.1. Company Overview
- 12.1.6.2. Products
- 12.1.6.3. Company Financials
- 12.1.6.4. SWOT Analysis
- 12.1.7 Esun
- 12.1.7.1. Company Overview
- 12.1.7.2. Products
- 12.1.7.3. Company Financials
- 12.1.7.4. SWOT Analysis
- 12.1.8 Zhejiang Hisun Biomaterials Co Ltd*List Not Exhaustive
- 12.1.8.1. Company Overview
- 12.1.8.2. Products
- 12.1.8.3. Company Financials
- 12.1.8.4. SWOT Analysis
- 12.1.9 Shanghai Tong Jie Liang Biomaterials Co Ltd
- 12.1.9.1. Company Overview
- 12.1.9.2. Products
- 12.1.9.3. Company Financials
- 12.1.9.4. SWOT Analysis
- 12.1.10 NatureWorks LLC
- 12.1.10.1. Company Overview
- 12.1.10.2. Products
- 12.1.10.3. Company Financials
- 12.1.10.4. SWOT Analysis
- 12.1.11 Cofco
- 12.1.11.1. Company Overview
- 12.1.11.2. Products
- 12.1.11.3. Company Financials
- 12.1.11.4. SWOT Analysis
- 12.1.12 Polysciences Inc
- 12.1.12.1. Company Overview
- 12.1.12.2. Products
- 12.1.12.3. Company Financials
- 12.1.12.4. SWOT Analysis
- 12.1.13 Weforyou
- 12.1.13.1. Company Overview
- 12.1.13.2. Products
- 12.1.13.3. Company Financials
- 12.1.13.4. SWOT Analysis
- 12.1.14 Jiangxi Keyuan Bio-Material Co Ltd
- 12.1.14.1. Company Overview
- 12.1.14.2. Products
- 12.1.14.3. Company Financials
- 12.1.14.4. SWOT Analysis
- 12.1.15 Danimer Scientific
- 12.1.15.1. Company Overview
- 12.1.15.2. Products
- 12.1.15.3. Company Financials
- 12.1.15.4. SWOT Analysis
- 12.1.1 BEWiSynbra Group
- 12.2. Market Entropy
- 12.2.1 Company's Key Areas Served
- 12.2.2 Recent Developments
- 12.3. Company Market Share Analysis 2025
- 12.3.1 Top 5 Companies Market Share Analysis
- 12.3.2 Top 3 Companies Market Share Analysis
- 12.4. List of Potential Customers
- 13. Research Methodology
List of Figures
- Figure 1: Global Polylactic Acid Market Revenue Breakdown (billion, %) by Region 2025 & 2033
- Figure 2: Global Polylactic Acid Market Volume Breakdown (Million, %) by Region 2025 & 2033
- Figure 3: Asia Pacific Polylactic Acid Market Revenue (billion), by Raw Material 2025 & 2033
- Figure 4: Asia Pacific Polylactic Acid Market Volume (Million), by Raw Material 2025 & 2033
- Figure 5: Asia Pacific Polylactic Acid Market Revenue Share (%), by Raw Material 2025 & 2033
- Figure 6: Asia Pacific Polylactic Acid Market Volume Share (%), by Raw Material 2025 & 2033
- Figure 7: Asia Pacific Polylactic Acid Market Revenue (billion), by Form 2025 & 2033
- Figure 8: Asia Pacific Polylactic Acid Market Volume (Million), by Form 2025 & 2033
- Figure 9: Asia Pacific Polylactic Acid Market Revenue Share (%), by Form 2025 & 2033
- Figure 10: Asia Pacific Polylactic Acid Market Volume Share (%), by Form 2025 & 2033
- Figure 11: Asia Pacific Polylactic Acid Market Revenue (billion), by End-user Industry 2025 & 2033
- Figure 12: Asia Pacific Polylactic Acid Market Volume (Million), by End-user Industry 2025 & 2033
- Figure 13: Asia Pacific Polylactic Acid Market Revenue Share (%), by End-user Industry 2025 & 2033
- Figure 14: Asia Pacific Polylactic Acid Market Volume Share (%), by End-user Industry 2025 & 2033
- Figure 15: Asia Pacific Polylactic Acid Market Revenue (billion), by Country 2025 & 2033
- Figure 16: Asia Pacific Polylactic Acid Market Volume (Million), by Country 2025 & 2033
- Figure 17: Asia Pacific Polylactic Acid Market Revenue Share (%), by Country 2025 & 2033
- Figure 18: Asia Pacific Polylactic Acid Market Volume Share (%), by Country 2025 & 2033
- Figure 19: North America Polylactic Acid Market Revenue (billion), by Raw Material 2025 & 2033
- Figure 20: North America Polylactic Acid Market Volume (Million), by Raw Material 2025 & 2033
- Figure 21: North America Polylactic Acid Market Revenue Share (%), by Raw Material 2025 & 2033
- Figure 22: North America Polylactic Acid Market Volume Share (%), by Raw Material 2025 & 2033
- Figure 23: North America Polylactic Acid Market Revenue (billion), by Form 2025 & 2033
- Figure 24: North America Polylactic Acid Market Volume (Million), by Form 2025 & 2033
- Figure 25: North America Polylactic Acid Market Revenue Share (%), by Form 2025 & 2033
- Figure 26: North America Polylactic Acid Market Volume Share (%), by Form 2025 & 2033
- Figure 27: North America Polylactic Acid Market Revenue (billion), by End-user Industry 2025 & 2033
- Figure 28: North America Polylactic Acid Market Volume (Million), by End-user Industry 2025 & 2033
- Figure 29: North America Polylactic Acid Market Revenue Share (%), by End-user Industry 2025 & 2033
- Figure 30: North America Polylactic Acid Market Volume Share (%), by End-user Industry 2025 & 2033
- Figure 31: North America Polylactic Acid Market Revenue (billion), by Country 2025 & 2033
- Figure 32: North America Polylactic Acid Market Volume (Million), by Country 2025 & 2033
- Figure 33: North America Polylactic Acid Market Revenue Share (%), by Country 2025 & 2033
- Figure 34: North America Polylactic Acid Market Volume Share (%), by Country 2025 & 2033
- Figure 35: Europe Polylactic Acid Market Revenue (billion), by Raw Material 2025 & 2033
- Figure 36: Europe Polylactic Acid Market Volume (Million), by Raw Material 2025 & 2033
- Figure 37: Europe Polylactic Acid Market Revenue Share (%), by Raw Material 2025 & 2033
- Figure 38: Europe Polylactic Acid Market Volume Share (%), by Raw Material 2025 & 2033
- Figure 39: Europe Polylactic Acid Market Revenue (billion), by Form 2025 & 2033
- Figure 40: Europe Polylactic Acid Market Volume (Million), by Form 2025 & 2033
- Figure 41: Europe Polylactic Acid Market Revenue Share (%), by Form 2025 & 2033
- Figure 42: Europe Polylactic Acid Market Volume Share (%), by Form 2025 & 2033
- Figure 43: Europe Polylactic Acid Market Revenue (billion), by End-user Industry 2025 & 2033
- Figure 44: Europe Polylactic Acid Market Volume (Million), by End-user Industry 2025 & 2033
- Figure 45: Europe Polylactic Acid Market Revenue Share (%), by End-user Industry 2025 & 2033
- Figure 46: Europe Polylactic Acid Market Volume Share (%), by End-user Industry 2025 & 2033
- Figure 47: Europe Polylactic Acid Market Revenue (billion), by Country 2025 & 2033
- Figure 48: Europe Polylactic Acid Market Volume (Million), by Country 2025 & 2033
- Figure 49: Europe Polylactic Acid Market Revenue Share (%), by Country 2025 & 2033
- Figure 50: Europe Polylactic Acid Market Volume Share (%), by Country 2025 & 2033
- Figure 51: South America Polylactic Acid Market Revenue (billion), by Raw Material 2025 & 2033
- Figure 52: South America Polylactic Acid Market Volume (Million), by Raw Material 2025 & 2033
- Figure 53: South America Polylactic Acid Market Revenue Share (%), by Raw Material 2025 & 2033
- Figure 54: South America Polylactic Acid Market Volume Share (%), by Raw Material 2025 & 2033
- Figure 55: South America Polylactic Acid Market Revenue (billion), by Form 2025 & 2033
- Figure 56: South America Polylactic Acid Market Volume (Million), by Form 2025 & 2033
- Figure 57: South America Polylactic Acid Market Revenue Share (%), by Form 2025 & 2033
- Figure 58: South America Polylactic Acid Market Volume Share (%), by Form 2025 & 2033
- Figure 59: South America Polylactic Acid Market Revenue (billion), by End-user Industry 2025 & 2033
- Figure 60: South America Polylactic Acid Market Volume (Million), by End-user Industry 2025 & 2033
- Figure 61: South America Polylactic Acid Market Revenue Share (%), by End-user Industry 2025 & 2033
- Figure 62: South America Polylactic Acid Market Volume Share (%), by End-user Industry 2025 & 2033
- Figure 63: South America Polylactic Acid Market Revenue (billion), by Country 2025 & 2033
- Figure 64: South America Polylactic Acid Market Volume (Million), by Country 2025 & 2033
- Figure 65: South America Polylactic Acid Market Revenue Share (%), by Country 2025 & 2033
- Figure 66: South America Polylactic Acid Market Volume Share (%), by Country 2025 & 2033
- Figure 67: Middle East and Africa Polylactic Acid Market Revenue (billion), by Raw Material 2025 & 2033
- Figure 68: Middle East and Africa Polylactic Acid Market Volume (Million), by Raw Material 2025 & 2033
- Figure 69: Middle East and Africa Polylactic Acid Market Revenue Share (%), by Raw Material 2025 & 2033
- Figure 70: Middle East and Africa Polylactic Acid Market Volume Share (%), by Raw Material 2025 & 2033
- Figure 71: Middle East and Africa Polylactic Acid Market Revenue (billion), by Form 2025 & 2033
- Figure 72: Middle East and Africa Polylactic Acid Market Volume (Million), by Form 2025 & 2033
- Figure 73: Middle East and Africa Polylactic Acid Market Revenue Share (%), by Form 2025 & 2033
- Figure 74: Middle East and Africa Polylactic Acid Market Volume Share (%), by Form 2025 & 2033
- Figure 75: Middle East and Africa Polylactic Acid Market Revenue (billion), by End-user Industry 2025 & 2033
- Figure 76: Middle East and Africa Polylactic Acid Market Volume (Million), by End-user Industry 2025 & 2033
- Figure 77: Middle East and Africa Polylactic Acid Market Revenue Share (%), by End-user Industry 2025 & 2033
- Figure 78: Middle East and Africa Polylactic Acid Market Volume Share (%), by End-user Industry 2025 & 2033
- Figure 79: Middle East and Africa Polylactic Acid Market Revenue (billion), by Country 2025 & 2033
- Figure 80: Middle East and Africa Polylactic Acid Market Volume (Million), by Country 2025 & 2033
- Figure 81: Middle East and Africa Polylactic Acid Market Revenue Share (%), by Country 2025 & 2033
- Figure 82: Middle East and Africa Polylactic Acid Market Volume Share (%), by Country 2025 & 2033
List of Tables
- Table 1: Global Polylactic Acid Market Revenue billion Forecast, by Raw Material 2020 & 2033
- Table 2: Global Polylactic Acid Market Volume Million Forecast, by Raw Material 2020 & 2033
- Table 3: Global Polylactic Acid Market Revenue billion Forecast, by Form 2020 & 2033
- Table 4: Global Polylactic Acid Market Volume Million Forecast, by Form 2020 & 2033
- Table 5: Global Polylactic Acid Market Revenue billion Forecast, by End-user Industry 2020 & 2033
- Table 6: Global Polylactic Acid Market Volume Million Forecast, by End-user Industry 2020 & 2033
- Table 7: Global Polylactic Acid Market Revenue billion Forecast, by Region 2020 & 2033
- Table 8: Global Polylactic Acid Market Volume Million Forecast, by Region 2020 & 2033
- Table 9: Global Polylactic Acid Market Revenue billion Forecast, by Raw Material 2020 & 2033
- Table 10: Global Polylactic Acid Market Volume Million Forecast, by Raw Material 2020 & 2033
- Table 11: Global Polylactic Acid Market Revenue billion Forecast, by Form 2020 & 2033
- Table 12: Global Polylactic Acid Market Volume Million Forecast, by Form 2020 & 2033
- Table 13: Global Polylactic Acid Market Revenue billion Forecast, by End-user Industry 2020 & 2033
- Table 14: Global Polylactic Acid Market Volume Million Forecast, by End-user Industry 2020 & 2033
- Table 15: Global Polylactic Acid Market Revenue billion Forecast, by Country 2020 & 2033
- Table 16: Global Polylactic Acid Market Volume Million Forecast, by Country 2020 & 2033
- Table 17: China Polylactic Acid Market Revenue (billion) Forecast, by Application 2020 & 2033
- Table 18: China Polylactic Acid Market Volume (Million) Forecast, by Application 2020 & 2033
- Table 19: India Polylactic Acid Market Revenue (billion) Forecast, by Application 2020 & 2033
- Table 20: India Polylactic Acid Market Volume (Million) Forecast, by Application 2020 & 2033
- Table 21: Japan Polylactic Acid Market Revenue (billion) Forecast, by Application 2020 & 2033
- Table 22: Japan Polylactic Acid Market Volume (Million) Forecast, by Application 2020 & 2033
- Table 23: South Korea Polylactic Acid Market Revenue (billion) Forecast, by Application 2020 & 2033
- Table 24: South Korea Polylactic Acid Market Volume (Million) Forecast, by Application 2020 & 2033
- Table 25: ASEAN Countries Polylactic Acid Market Revenue (billion) Forecast, by Application 2020 & 2033
- Table 26: ASEAN Countries Polylactic Acid Market Volume (Million) Forecast, by Application 2020 & 2033
- Table 27: Rest of Asia Pacific Polylactic Acid Market Revenue (billion) Forecast, by Application 2020 & 2033
- Table 28: Rest of Asia Pacific Polylactic Acid Market Volume (Million) Forecast, by Application 2020 & 2033
- Table 29: Global Polylactic Acid Market Revenue billion Forecast, by Raw Material 2020 & 2033
- Table 30: Global Polylactic Acid Market Volume Million Forecast, by Raw Material 2020 & 2033
- Table 31: Global Polylactic Acid Market Revenue billion Forecast, by Form 2020 & 2033
- Table 32: Global Polylactic Acid Market Volume Million Forecast, by Form 2020 & 2033
- Table 33: Global Polylactic Acid Market Revenue billion Forecast, by End-user Industry 2020 & 2033
- Table 34: Global Polylactic Acid Market Volume Million Forecast, by End-user Industry 2020 & 2033
- Table 35: Global Polylactic Acid Market Revenue billion Forecast, by Country 2020 & 2033
- Table 36: Global Polylactic Acid Market Volume Million Forecast, by Country 2020 & 2033
- Table 37: United States Polylactic Acid Market Revenue (billion) Forecast, by Application 2020 & 2033
- Table 38: United States Polylactic Acid Market Volume (Million) Forecast, by Application 2020 & 2033
- Table 39: Canada Polylactic Acid Market Revenue (billion) Forecast, by Application 2020 & 2033
- Table 40: Canada Polylactic Acid Market Volume (Million) Forecast, by Application 2020 & 2033
- Table 41: Mexico Polylactic Acid Market Revenue (billion) Forecast, by Application 2020 & 2033
- Table 42: Mexico Polylactic Acid Market Volume (Million) Forecast, by Application 2020 & 2033
- Table 43: Global Polylactic Acid Market Revenue billion Forecast, by Raw Material 2020 & 2033
- Table 44: Global Polylactic Acid Market Volume Million Forecast, by Raw Material 2020 & 2033
- Table 45: Global Polylactic Acid Market Revenue billion Forecast, by Form 2020 & 2033
- Table 46: Global Polylactic Acid Market Volume Million Forecast, by Form 2020 & 2033
- Table 47: Global Polylactic Acid Market Revenue billion Forecast, by End-user Industry 2020 & 2033
- Table 48: Global Polylactic Acid Market Volume Million Forecast, by End-user Industry 2020 & 2033
- Table 49: Global Polylactic Acid Market Revenue billion Forecast, by Country 2020 & 2033
- Table 50: Global Polylactic Acid Market Volume Million Forecast, by Country 2020 & 2033
- Table 51: Germany Polylactic Acid Market Revenue (billion) Forecast, by Application 2020 & 2033
- Table 52: Germany Polylactic Acid Market Volume (Million) Forecast, by Application 2020 & 2033
- Table 53: United Kingdom Polylactic Acid Market Revenue (billion) Forecast, by Application 2020 & 2033
- Table 54: United Kingdom Polylactic Acid Market Volume (Million) Forecast, by Application 2020 & 2033
- Table 55: France Polylactic Acid Market Revenue (billion) Forecast, by Application 2020 & 2033
- Table 56: France Polylactic Acid Market Volume (Million) Forecast, by Application 2020 & 2033
- Table 57: Italy Polylactic Acid Market Revenue (billion) Forecast, by Application 2020 & 2033
- Table 58: Italy Polylactic Acid Market Volume (Million) Forecast, by Application 2020 & 2033
- Table 59: CIS region Polylactic Acid Market Revenue (billion) Forecast, by Application 2020 & 2033
- Table 60: CIS region Polylactic Acid Market Volume (Million) Forecast, by Application 2020 & 2033
- Table 61: Rest of Europe Polylactic Acid Market Revenue (billion) Forecast, by Application 2020 & 2033
- Table 62: Rest of Europe Polylactic Acid Market Volume (Million) Forecast, by Application 2020 & 2033
- Table 63: Global Polylactic Acid Market Revenue billion Forecast, by Raw Material 2020 & 2033
- Table 64: Global Polylactic Acid Market Volume Million Forecast, by Raw Material 2020 & 2033
- Table 65: Global Polylactic Acid Market Revenue billion Forecast, by Form 2020 & 2033
- Table 66: Global Polylactic Acid Market Volume Million Forecast, by Form 2020 & 2033
- Table 67: Global Polylactic Acid Market Revenue billion Forecast, by End-user Industry 2020 & 2033
- Table 68: Global Polylactic Acid Market Volume Million Forecast, by End-user Industry 2020 & 2033
- Table 69: Global Polylactic Acid Market Revenue billion Forecast, by Country 2020 & 2033
- Table 70: Global Polylactic Acid Market Volume Million Forecast, by Country 2020 & 2033
- Table 71: Brazil Polylactic Acid Market Revenue (billion) Forecast, by Application 2020 & 2033
- Table 72: Brazil Polylactic Acid Market Volume (Million) Forecast, by Application 2020 & 2033
- Table 73: Argentina Polylactic Acid Market Revenue (billion) Forecast, by Application 2020 & 2033
- Table 74: Argentina Polylactic Acid Market Volume (Million) Forecast, by Application 2020 & 2033
- Table 75: Rest of South America Polylactic Acid Market Revenue (billion) Forecast, by Application 2020 & 2033
- Table 76: Rest of South America Polylactic Acid Market Volume (Million) Forecast, by Application 2020 & 2033
- Table 77: Global Polylactic Acid Market Revenue billion Forecast, by Raw Material 2020 & 2033
- Table 78: Global Polylactic Acid Market Volume Million Forecast, by Raw Material 2020 & 2033
- Table 79: Global Polylactic Acid Market Revenue billion Forecast, by Form 2020 & 2033
- Table 80: Global Polylactic Acid Market Volume Million Forecast, by Form 2020 & 2033
- Table 81: Global Polylactic Acid Market Revenue billion Forecast, by End-user Industry 2020 & 2033
- Table 82: Global Polylactic Acid Market Volume Million Forecast, by End-user Industry 2020 & 2033
- Table 83: Global Polylactic Acid Market Revenue billion Forecast, by Country 2020 & 2033
- Table 84: Global Polylactic Acid Market Volume Million Forecast, by Country 2020 & 2033
- Table 85: Saudi Arabia Polylactic Acid Market Revenue (billion) Forecast, by Application 2020 & 2033
- Table 86: Saudi Arabia Polylactic Acid Market Volume (Million) Forecast, by Application 2020 & 2033
- Table 87: South Africa Polylactic Acid Market Revenue (billion) Forecast, by Application 2020 & 2033
- Table 88: South Africa Polylactic Acid Market Volume (Million) Forecast, by Application 2020 & 2033
- Table 89: Rest of Middle East and Africa Polylactic Acid Market Revenue (billion) Forecast, by Application 2020 & 2033
- Table 90: Rest of Middle East and Africa Polylactic Acid Market Volume (Million) Forecast, by Application 2020 & 2033
Frequently Asked Questions
1. What is the projected Compound Annual Growth Rate (CAGR) of the Polylactic Acid Market?
The projected CAGR is approximately 17.5%.
2. Which companies are prominent players in the Polylactic Acid Market?
Key companies in the market include BEWiSynbra Group, Total Corbion PLA, Sulzer Ltd, Musashino Chemical Laboratory Ltd, Futerro, BASF SE, Esun, Zhejiang Hisun Biomaterials Co Ltd*List Not Exhaustive, Shanghai Tong Jie Liang Biomaterials Co Ltd, NatureWorks LLC, Cofco, Polysciences Inc, Weforyou, Jiangxi Keyuan Bio-Material Co Ltd, Danimer Scientific.
3. What are the main segments of the Polylactic Acid Market?
The market segments include Raw Material, Form, End-user Industry.
4. Can you provide details about the market size?
The market size is estimated to be USD 2.01 billion as of 2022.
5. What are some drivers contributing to market growth?
Favorable Government Policies Promoting Bio-plastics; Other Drivers.
6. What are the notable trends driving market growth?
The Packaging Segment is Expected to Dominate the Market.
7. Are there any restraints impacting market growth?
High Price and Other Disadvantages; Other Restraints.
8. Can you provide examples of recent developments in the market?
September 2023: Danimer Scientific has announced its collaboration with Chevron Phillips Chemical to explore the development and commercialization of high-volume biodegradable plastic products using Danimer’s Rinnovo polymers. This partnership aims to boost the company’s profile of PLA-based bioplastic products in the market.
9. What pricing options are available for accessing the report?
Pricing options include single-user, multi-user, and enterprise licenses priced at USD 4750, USD 5250, and USD 8750 respectively.
10. Is the market size provided in terms of value or volume?
The market size is provided in terms of value, measured in billion and volume, measured in Million.
11. Are there any specific market keywords associated with the report?
Yes, the market keyword associated with the report is "Polylactic Acid Market," which aids in identifying and referencing the specific market segment covered.
12. How do I determine which pricing option suits my needs best?
The pricing options vary based on user requirements and access needs. Individual users may opt for single-user licenses, while businesses requiring broader access may choose multi-user or enterprise licenses for cost-effective access to the report.
13. Are there any additional resources or data provided in the Polylactic Acid Market report?
While the report offers comprehensive insights, it's advisable to review the specific contents or supplementary materials provided to ascertain if additional resources or data are available.
14. How can I stay updated on further developments or reports in the Polylactic Acid Market?
To stay informed about further developments, trends, and reports in the Polylactic Acid Market, consider subscribing to industry newsletters, following relevant companies and organizations, or regularly checking reputable industry news sources and publications.
Methodology
Step 1 - Identification of Relevant Samples Size from Population Database


Step 2 - Approaches for Defining Global Market Size (Value, Volume* & Price*)

Note*: In applicable scenarios
Step 3 - Data Sources
Primary Research
- Web Analytics
- Survey Reports
- Research Institute
- Latest Research Reports
- Opinion Leaders
Secondary Research
- Annual Reports
- White Paper
- Latest Press Release
- Industry Association
- Paid Database
- Investor Presentations

Step 4 - Data Triangulation
Involves using different sources of information in order to increase the validity of a study
These sources are likely to be stakeholders in a program - participants, other researchers, program staff, other community members, and so on.
Then we put all data in single framework & apply various statistical tools to find out the dynamic on the market.
During the analysis stage, feedback from the stakeholder groups would be compared to determine areas of agreement as well as areas of divergence