
Key Insights
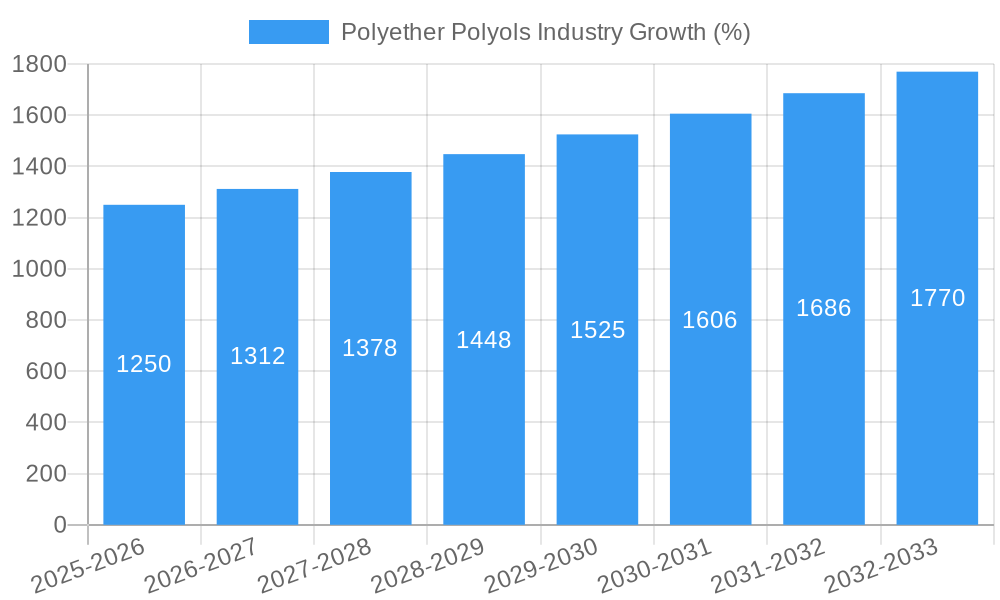
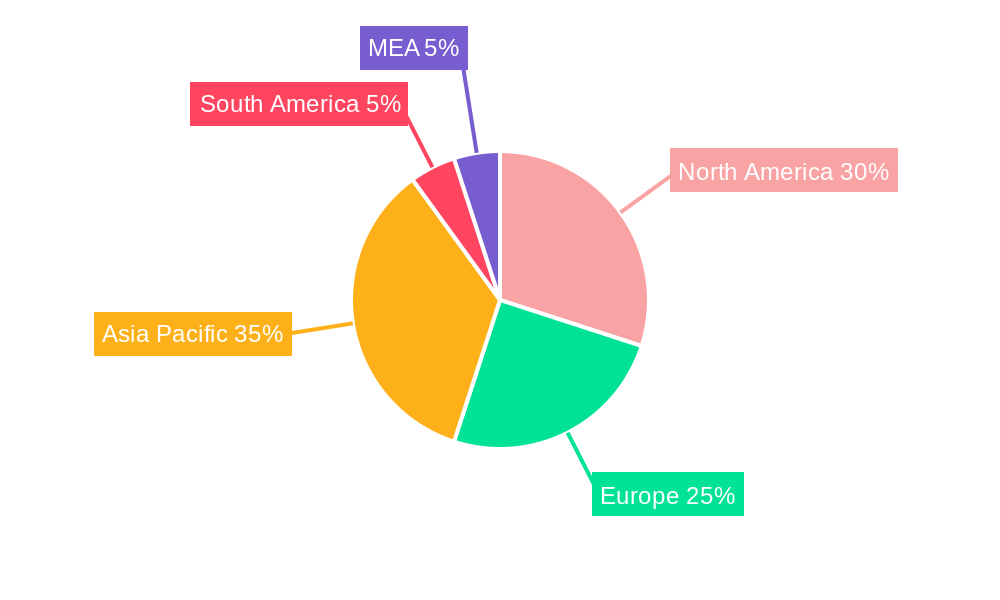
The global polyether polyols market is experiencing robust growth, driven by a CAGR exceeding 5% between 2019 and 2033. This expansion is fueled by several key factors. The burgeoning furniture and bedding industry, characterized by increasing demand for comfortable and durable polyurethane foams, constitutes a significant driver. Similarly, the construction sector's reliance on polyurethane insulation for energy efficiency is bolstering market demand. The automotive industry's adoption of flexible polyurethane foams in seating and interior components further contributes to market growth. Technological advancements leading to the development of high-performance, eco-friendly polyols are also shaping market trends, with a noticeable shift towards flexible polyols due to their versatility and widespread applications. However, fluctuating raw material prices and environmental concerns related to polyurethane production pose significant restraints on market expansion. The market is segmented by type (flexible, rigid, other) and end-user industry (furniture & bedding, construction, automotive, electrical & electronics, others). Major players like BASF, Dow, and Huntsman International are actively shaping market dynamics through innovation and strategic partnerships. Regional growth is diverse, with North America and Asia-Pacific expected to maintain significant market shares due to robust industrial activity and consumer demand. Europe and South America also contribute substantial growth, albeit at potentially slightly lower rates than the Asia-Pacific region. The market's future hinges on continued innovation, addressing environmental concerns, and meeting the demands of a growing global economy.
The forecast period (2025-2033) anticipates continued expansion, particularly in emerging economies experiencing rapid industrialization. While rigid polyols maintain a solid market position due to their application in construction and insulation, the flexible polyols segment is poised for faster growth due to expanding applications in furniture, bedding, and automotive interiors. Companies are focusing on developing sustainable polyols and improving product performance to cater to evolving market demands. The competitive landscape is dynamic, with established players leveraging their research and development capabilities and market presence to maintain their leading positions, and new entrants seeking to carve out niches with specialized products. Careful consideration of regulatory changes, particularly those impacting environmental compliance, will be crucial for companies seeking long-term success in this industry.
Polyether Polyols Industry Market Report: 2019-2033
This comprehensive report provides a detailed analysis of the Polyether Polyols industry, offering invaluable insights for industry professionals, investors, and strategic decision-makers. Covering the period from 2019 to 2033, with a focus on 2025, this report meticulously examines market dynamics, growth trends, competitive landscapes, and future projections. The report segments the market by type (Flexible, Rigid, Other Types) and end-user industry (Furniture and Bedding, Construction, Automotive, Electrical and Electronics, Other End-user Industries), offering granular analysis of each segment's performance and potential. The report is valued at xx Million units.
Polyether Polyols Industry Market Dynamics & Structure
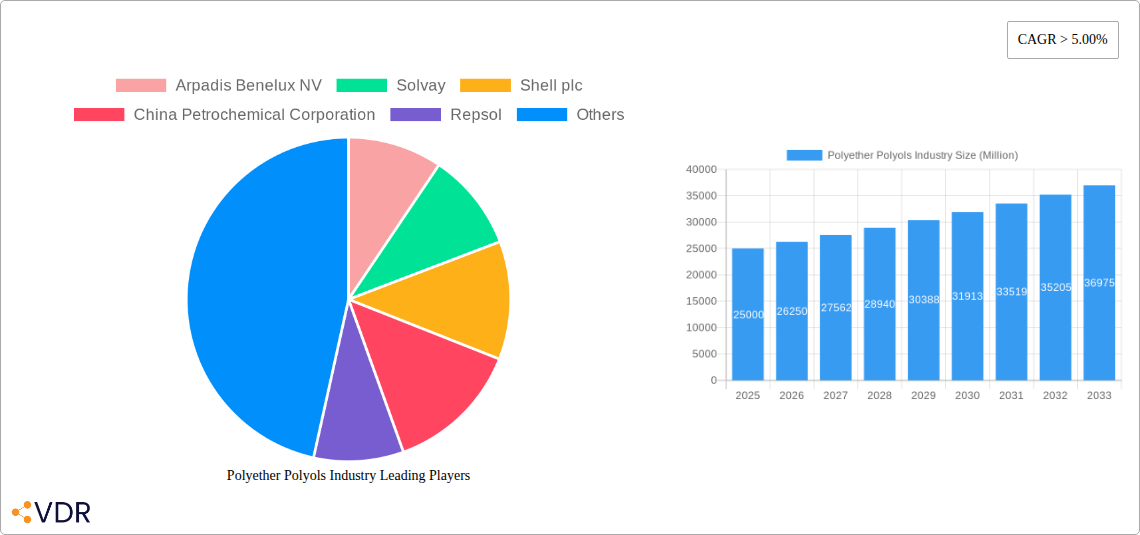
This section analyzes the intricate structure of the polyether polyols market, considering factors influencing its growth trajectory. The market is characterized by a moderately concentrated landscape, with key players like BASF SE, Dow, and Huntsman International LLC holding significant market share. Technological innovation, particularly in biodegradable polyols, is a key driver, while stringent environmental regulations pose both challenges and opportunities. The competitive landscape is further shaped by the presence of product substitutes, impacting market share dynamics. M&A activity, as evidenced by recent acquisitions like Stepan Company’s acquisition of INVISTA's aromatic polyester polyol business, reflects industry consolidation and growth strategies.
- Market Concentration: Moderately concentrated, with top 10 players holding approximately xx% market share in 2024.
- Technological Innovation: Focus on biodegradable and sustainable polyols is driving growth.
- Regulatory Frameworks: Stringent environmental regulations influence product development and manufacturing.
- Competitive Substitutes: Presence of alternative materials impacting market share.
- M&A Trends: Consolidation through acquisitions and mergers are shaping the competitive landscape (e.g., Stepan Company acquisition of INVISTA's business).
- End-User Demographics: Growth driven by increasing demand from construction and automotive sectors.
Polyether Polyols Industry Growth Trends & Insights
The polyether polyols market experienced robust growth during the historical period (2019-2024), driven by increasing demand from diverse end-user industries. The market size reached xx Million units in 2024, exhibiting a CAGR of xx% during this period. Technological advancements, such as the development of high-performance polyols for specialized applications, contributed significantly to market expansion. Shifts in consumer preferences toward sustainable products further boosted the adoption of eco-friendly polyols. The forecast period (2025-2033) projects continued growth, with a projected CAGR of xx%, driven by factors such as increasing infrastructure development, automotive production, and the rising popularity of sustainable materials. Market penetration in emerging economies is expected to further fuel this growth. The estimated market size in 2025 is xx Million units.
Dominant Regions, Countries, or Segments in Polyether Polyols Industry
The Asia-Pacific region is expected to dominate the polyether polyols market throughout the forecast period, driven by robust economic growth, burgeoning infrastructure development, and increasing automotive production. China, in particular, is a significant market, with considerable growth potential. Within the segments, the flexible polyether polyols segment holds the largest market share due to its widespread use in various applications, including furniture and bedding. The automotive segment, particularly in the Asia-Pacific region, is poised for strong growth due to rising vehicle production and demand for lightweight and fuel-efficient vehicles.
- Key Drivers (Asia-Pacific): Rapid economic growth, infrastructure development, automotive industry expansion.
- Key Drivers (Flexible Polyols): Widespread applications in furniture, bedding, and other industries.
- Key Drivers (Automotive): Demand for lightweight and fuel-efficient vehicles.
Polyether Polyols Industry Product Landscape
The polyether polyols market showcases a diverse range of products catering to specific application requirements. Innovations focus on improving performance characteristics such as flexibility, rigidity, and biodegradability. Manufacturers are emphasizing the unique selling propositions of their products, such as enhanced durability, reduced environmental impact, and superior processing characteristics. Technological advancements include the development of novel polyol chemistries and tailored formulations for optimal performance in various applications. The market also offers customized solutions to meet specific end-user needs.
Key Drivers, Barriers & Challenges in Polyether Polyols Industry
Key Drivers:
- Increasing demand from automotive and construction sectors.
- Growing adoption of sustainable and biodegradable polyols.
- Technological advancements leading to improved product performance.
Key Challenges:
- Fluctuations in raw material prices.
- Stringent environmental regulations.
- Intense competition from established players and emerging substitutes.
Emerging Opportunities in Polyether Polyols Industry
- Expansion into untapped markets, particularly in developing economies.
- Development of novel polyol chemistries for specialized applications.
- Growing demand for sustainable and bio-based polyols.
- Focus on customized solutions to meet specific end-user needs.
Growth Accelerators in the Polyether Polyols Industry
Long-term growth in the polyether polyols market will be fueled by several key factors. Technological breakthroughs in polyol chemistry will lead to the development of higher-performance materials with enhanced properties. Strategic partnerships and collaborations among industry players will foster innovation and accelerate market penetration. Expansion into new geographic markets and exploration of innovative applications will further drive market expansion. The increasing demand for sustainable materials will encourage the development of eco-friendly polyols, enhancing the market's long-term sustainability.
Key Players Shaping the Polyether Polyols Industry Market
- Arpadis Benelux NV
- Solvay
- Shell plc
- China Petrochemical Corporation
- Repsol
- BASF SE
- Huntsman International LLC
- Dow
- Covestro AG
- PCC Group
- Purinova Sp z o o
Notable Milestones in Polyether Polyols Industry Sector
- December 2021: PCC Group expands production capacity and product range, including biodegradable products.
- February 2021: Repsol licenses agreement to build propylene oxide (PO), styrene monomer (SM), and polyol plants in China (125,000 tonnes/year capacity).
- January 2021: Stepan Company acquires INVISTA's aromatic polyester polyol business.
In-Depth Polyether Polyols Industry Market Outlook
The polyether polyols market is poised for continued growth, driven by technological innovation, expanding applications, and increasing demand from diverse end-user industries. Strategic partnerships and collaborations will play a crucial role in shaping the future market landscape. The focus on sustainability and the development of eco-friendly polyols will further enhance the market's long-term prospects. Companies that adapt to evolving consumer preferences and invest in research and development will be well-positioned to capitalize on the market's growth potential.
Polyether Polyols Industry Segmentation
-
1. Type
- 1.1. Flexible
- 1.2. Rigid
- 1.3. Other Types
-
2. End-user Industry
- 2.1. Furniture and Bedding
- 2.2. Construction
- 2.3. Automotive
- 2.4. Electrical and Electronics
- 2.5. Other End-user Industries
Polyether Polyols Industry Segmentation By Geography
-
1. Asia Pacific
- 1.1. China
- 1.2. India
- 1.3. Japan
- 1.4. South Korea
- 1.5. Rest of Asia Pacific
-
2. North America
- 2.1. United States
- 2.2. Canada
- 2.3. Mexico
-
3. Europe
- 3.1. Germany
- 3.2. United Kingdom
- 3.3. Italy
- 3.4. France
- 3.5. Rest of Europe
-
4. South America
- 4.1. Brazil
- 4.2. Argentina
- 4.3. Rest of South America
-
5. Middle East and Africa
- 5.1. Saudi Arabia
- 5.2. South Africa
- 5.3. Rest of Middle East and Africa
Polyether Polyols Industry REPORT HIGHLIGHTS
| Aspects | Details |
|---|---|
| Study Period | 2019-2033 |
| Base Year | 2024 |
| Estimated Year | 2025 |
| Forecast Period | 2025-2033 |
| Historical Period | 2019-2024 |
| Growth Rate | CAGR of > 5.00% from 2019-2033 |
| Segmentation |
|
Table of Contents
- 1. Introduction
- 1.1. Research Scope
- 1.2. Market Segmentation
- 1.3. Research Methodology
- 1.4. Definitions and Assumptions
- 2. Executive Summary
- 2.1. Introduction
- 3. Market Dynamics
- 3.1. Introduction
- 3.2. Market Drivers
- 3.2.1. Rising Demand for Flexible and Rigid Polyurethane Foam; Growth of Automotive Industry; Rising Demand from Construction Industry
- 3.3. Market Restrains
- 3.3.1. Volatile Prices of Raw Materials; Stringent Government Regulations on Polyurethane Foam Manufacturing
- 3.4. Market Trends
- 3.4.1. Rising Demand from Construction Industry
- 4. Market Factor Analysis
- 4.1. Porters Five Forces
- 4.2. Supply/Value Chain
- 4.3. PESTEL analysis
- 4.4. Market Entropy
- 4.5. Patent/Trademark Analysis
- 5. Global Polyether Polyols Industry Analysis, Insights and Forecast, 2019-2031
- 5.1. Market Analysis, Insights and Forecast - by Type
- 5.1.1. Flexible
- 5.1.2. Rigid
- 5.1.3. Other Types
- 5.2. Market Analysis, Insights and Forecast - by End-user Industry
- 5.2.1. Furniture and Bedding
- 5.2.2. Construction
- 5.2.3. Automotive
- 5.2.4. Electrical and Electronics
- 5.2.5. Other End-user Industries
- 5.3. Market Analysis, Insights and Forecast - by Region
- 5.3.1. Asia Pacific
- 5.3.2. North America
- 5.3.3. Europe
- 5.3.4. South America
- 5.3.5. Middle East and Africa
- 5.1. Market Analysis, Insights and Forecast - by Type
- 6. Asia Pacific Polyether Polyols Industry Analysis, Insights and Forecast, 2019-2031
- 6.1. Market Analysis, Insights and Forecast - by Type
- 6.1.1. Flexible
- 6.1.2. Rigid
- 6.1.3. Other Types
- 6.2. Market Analysis, Insights and Forecast - by End-user Industry
- 6.2.1. Furniture and Bedding
- 6.2.2. Construction
- 6.2.3. Automotive
- 6.2.4. Electrical and Electronics
- 6.2.5. Other End-user Industries
- 6.1. Market Analysis, Insights and Forecast - by Type
- 7. North America Polyether Polyols Industry Analysis, Insights and Forecast, 2019-2031
- 7.1. Market Analysis, Insights and Forecast - by Type
- 7.1.1. Flexible
- 7.1.2. Rigid
- 7.1.3. Other Types
- 7.2. Market Analysis, Insights and Forecast - by End-user Industry
- 7.2.1. Furniture and Bedding
- 7.2.2. Construction
- 7.2.3. Automotive
- 7.2.4. Electrical and Electronics
- 7.2.5. Other End-user Industries
- 7.1. Market Analysis, Insights and Forecast - by Type
- 8. Europe Polyether Polyols Industry Analysis, Insights and Forecast, 2019-2031
- 8.1. Market Analysis, Insights and Forecast - by Type
- 8.1.1. Flexible
- 8.1.2. Rigid
- 8.1.3. Other Types
- 8.2. Market Analysis, Insights and Forecast - by End-user Industry
- 8.2.1. Furniture and Bedding
- 8.2.2. Construction
- 8.2.3. Automotive
- 8.2.4. Electrical and Electronics
- 8.2.5. Other End-user Industries
- 8.1. Market Analysis, Insights and Forecast - by Type
- 9. South America Polyether Polyols Industry Analysis, Insights and Forecast, 2019-2031
- 9.1. Market Analysis, Insights and Forecast - by Type
- 9.1.1. Flexible
- 9.1.2. Rigid
- 9.1.3. Other Types
- 9.2. Market Analysis, Insights and Forecast - by End-user Industry
- 9.2.1. Furniture and Bedding
- 9.2.2. Construction
- 9.2.3. Automotive
- 9.2.4. Electrical and Electronics
- 9.2.5. Other End-user Industries
- 9.1. Market Analysis, Insights and Forecast - by Type
- 10. Middle East and Africa Polyether Polyols Industry Analysis, Insights and Forecast, 2019-2031
- 10.1. Market Analysis, Insights and Forecast - by Type
- 10.1.1. Flexible
- 10.1.2. Rigid
- 10.1.3. Other Types
- 10.2. Market Analysis, Insights and Forecast - by End-user Industry
- 10.2.1. Furniture and Bedding
- 10.2.2. Construction
- 10.2.3. Automotive
- 10.2.4. Electrical and Electronics
- 10.2.5. Other End-user Industries
- 10.1. Market Analysis, Insights and Forecast - by Type
- 11. North America Polyether Polyols Industry Analysis, Insights and Forecast, 2019-2031
- 11.1. Market Analysis, Insights and Forecast - By Country/Sub-region
- 11.1.1 United States
- 11.1.2 Canada
- 11.1.3 Mexico
- 12. Europe Polyether Polyols Industry Analysis, Insights and Forecast, 2019-2031
- 12.1. Market Analysis, Insights and Forecast - By Country/Sub-region
- 12.1.1 Germany
- 12.1.2 France
- 12.1.3 Italy
- 12.1.4 United Kingdom
- 12.1.5 Netherlands
- 12.1.6 Rest of Europe
- 13. Asia Pacific Polyether Polyols Industry Analysis, Insights and Forecast, 2019-2031
- 13.1. Market Analysis, Insights and Forecast - By Country/Sub-region
- 13.1.1 China
- 13.1.2 Japan
- 13.1.3 India
- 13.1.4 South Korea
- 13.1.5 Taiwan
- 13.1.6 Australia
- 13.1.7 Rest of Asia-Pacific
- 14. South America Polyether Polyols Industry Analysis, Insights and Forecast, 2019-2031
- 14.1. Market Analysis, Insights and Forecast - By Country/Sub-region
- 14.1.1 Brazil
- 14.1.2 Argentina
- 14.1.3 Rest of South America
- 15. MEA Polyether Polyols Industry Analysis, Insights and Forecast, 2019-2031
- 15.1. Market Analysis, Insights and Forecast - By Country/Sub-region
- 15.1.1 Middle East
- 15.1.2 Africa
- 16. Competitive Analysis
- 16.1. Global Market Share Analysis 2024
- 16.2. Company Profiles
- 16.2.1 Arpadis Benelux NV
- 16.2.1.1. Overview
- 16.2.1.2. Products
- 16.2.1.3. SWOT Analysis
- 16.2.1.4. Recent Developments
- 16.2.1.5. Financials (Based on Availability)
- 16.2.2 Solvay
- 16.2.2.1. Overview
- 16.2.2.2. Products
- 16.2.2.3. SWOT Analysis
- 16.2.2.4. Recent Developments
- 16.2.2.5. Financials (Based on Availability)
- 16.2.3 Shell plc
- 16.2.3.1. Overview
- 16.2.3.2. Products
- 16.2.3.3. SWOT Analysis
- 16.2.3.4. Recent Developments
- 16.2.3.5. Financials (Based on Availability)
- 16.2.4 China Petrochemical Corporation
- 16.2.4.1. Overview
- 16.2.4.2. Products
- 16.2.4.3. SWOT Analysis
- 16.2.4.4. Recent Developments
- 16.2.4.5. Financials (Based on Availability)
- 16.2.5 Repsol
- 16.2.5.1. Overview
- 16.2.5.2. Products
- 16.2.5.3. SWOT Analysis
- 16.2.5.4. Recent Developments
- 16.2.5.5. Financials (Based on Availability)
- 16.2.6 BASF SE
- 16.2.6.1. Overview
- 16.2.6.2. Products
- 16.2.6.3. SWOT Analysis
- 16.2.6.4. Recent Developments
- 16.2.6.5. Financials (Based on Availability)
- 16.2.7 Huntsman International LLC
- 16.2.7.1. Overview
- 16.2.7.2. Products
- 16.2.7.3. SWOT Analysis
- 16.2.7.4. Recent Developments
- 16.2.7.5. Financials (Based on Availability)
- 16.2.8 Dow
- 16.2.8.1. Overview
- 16.2.8.2. Products
- 16.2.8.3. SWOT Analysis
- 16.2.8.4. Recent Developments
- 16.2.8.5. Financials (Based on Availability)
- 16.2.9 Covestro AG
- 16.2.9.1. Overview
- 16.2.9.2. Products
- 16.2.9.3. SWOT Analysis
- 16.2.9.4. Recent Developments
- 16.2.9.5. Financials (Based on Availability)
- 16.2.10 PCC Group
- 16.2.10.1. Overview
- 16.2.10.2. Products
- 16.2.10.3. SWOT Analysis
- 16.2.10.4. Recent Developments
- 16.2.10.5. Financials (Based on Availability)
- 16.2.11 Purinova Sp z o o
- 16.2.11.1. Overview
- 16.2.11.2. Products
- 16.2.11.3. SWOT Analysis
- 16.2.11.4. Recent Developments
- 16.2.11.5. Financials (Based on Availability)
- 16.2.1 Arpadis Benelux NV
List of Figures
- Figure 1: Global Polyether Polyols Industry Revenue Breakdown (Million, %) by Region 2024 & 2032
- Figure 2: Global Polyether Polyols Industry Volume Breakdown (K Tons, %) by Region 2024 & 2032
- Figure 3: North America Polyether Polyols Industry Revenue (Million), by Country 2024 & 2032
- Figure 4: North America Polyether Polyols Industry Volume (K Tons), by Country 2024 & 2032
- Figure 5: North America Polyether Polyols Industry Revenue Share (%), by Country 2024 & 2032
- Figure 6: North America Polyether Polyols Industry Volume Share (%), by Country 2024 & 2032
- Figure 7: Europe Polyether Polyols Industry Revenue (Million), by Country 2024 & 2032
- Figure 8: Europe Polyether Polyols Industry Volume (K Tons), by Country 2024 & 2032
- Figure 9: Europe Polyether Polyols Industry Revenue Share (%), by Country 2024 & 2032
- Figure 10: Europe Polyether Polyols Industry Volume Share (%), by Country 2024 & 2032
- Figure 11: Asia Pacific Polyether Polyols Industry Revenue (Million), by Country 2024 & 2032
- Figure 12: Asia Pacific Polyether Polyols Industry Volume (K Tons), by Country 2024 & 2032
- Figure 13: Asia Pacific Polyether Polyols Industry Revenue Share (%), by Country 2024 & 2032
- Figure 14: Asia Pacific Polyether Polyols Industry Volume Share (%), by Country 2024 & 2032
- Figure 15: South America Polyether Polyols Industry Revenue (Million), by Country 2024 & 2032
- Figure 16: South America Polyether Polyols Industry Volume (K Tons), by Country 2024 & 2032
- Figure 17: South America Polyether Polyols Industry Revenue Share (%), by Country 2024 & 2032
- Figure 18: South America Polyether Polyols Industry Volume Share (%), by Country 2024 & 2032
- Figure 19: MEA Polyether Polyols Industry Revenue (Million), by Country 2024 & 2032
- Figure 20: MEA Polyether Polyols Industry Volume (K Tons), by Country 2024 & 2032
- Figure 21: MEA Polyether Polyols Industry Revenue Share (%), by Country 2024 & 2032
- Figure 22: MEA Polyether Polyols Industry Volume Share (%), by Country 2024 & 2032
- Figure 23: Asia Pacific Polyether Polyols Industry Revenue (Million), by Type 2024 & 2032
- Figure 24: Asia Pacific Polyether Polyols Industry Volume (K Tons), by Type 2024 & 2032
- Figure 25: Asia Pacific Polyether Polyols Industry Revenue Share (%), by Type 2024 & 2032
- Figure 26: Asia Pacific Polyether Polyols Industry Volume Share (%), by Type 2024 & 2032
- Figure 27: Asia Pacific Polyether Polyols Industry Revenue (Million), by End-user Industry 2024 & 2032
- Figure 28: Asia Pacific Polyether Polyols Industry Volume (K Tons), by End-user Industry 2024 & 2032
- Figure 29: Asia Pacific Polyether Polyols Industry Revenue Share (%), by End-user Industry 2024 & 2032
- Figure 30: Asia Pacific Polyether Polyols Industry Volume Share (%), by End-user Industry 2024 & 2032
- Figure 31: Asia Pacific Polyether Polyols Industry Revenue (Million), by Country 2024 & 2032
- Figure 32: Asia Pacific Polyether Polyols Industry Volume (K Tons), by Country 2024 & 2032
- Figure 33: Asia Pacific Polyether Polyols Industry Revenue Share (%), by Country 2024 & 2032
- Figure 34: Asia Pacific Polyether Polyols Industry Volume Share (%), by Country 2024 & 2032
- Figure 35: North America Polyether Polyols Industry Revenue (Million), by Type 2024 & 2032
- Figure 36: North America Polyether Polyols Industry Volume (K Tons), by Type 2024 & 2032
- Figure 37: North America Polyether Polyols Industry Revenue Share (%), by Type 2024 & 2032
- Figure 38: North America Polyether Polyols Industry Volume Share (%), by Type 2024 & 2032
- Figure 39: North America Polyether Polyols Industry Revenue (Million), by End-user Industry 2024 & 2032
- Figure 40: North America Polyether Polyols Industry Volume (K Tons), by End-user Industry 2024 & 2032
- Figure 41: North America Polyether Polyols Industry Revenue Share (%), by End-user Industry 2024 & 2032
- Figure 42: North America Polyether Polyols Industry Volume Share (%), by End-user Industry 2024 & 2032
- Figure 43: North America Polyether Polyols Industry Revenue (Million), by Country 2024 & 2032
- Figure 44: North America Polyether Polyols Industry Volume (K Tons), by Country 2024 & 2032
- Figure 45: North America Polyether Polyols Industry Revenue Share (%), by Country 2024 & 2032
- Figure 46: North America Polyether Polyols Industry Volume Share (%), by Country 2024 & 2032
- Figure 47: Europe Polyether Polyols Industry Revenue (Million), by Type 2024 & 2032
- Figure 48: Europe Polyether Polyols Industry Volume (K Tons), by Type 2024 & 2032
- Figure 49: Europe Polyether Polyols Industry Revenue Share (%), by Type 2024 & 2032
- Figure 50: Europe Polyether Polyols Industry Volume Share (%), by Type 2024 & 2032
- Figure 51: Europe Polyether Polyols Industry Revenue (Million), by End-user Industry 2024 & 2032
- Figure 52: Europe Polyether Polyols Industry Volume (K Tons), by End-user Industry 2024 & 2032
- Figure 53: Europe Polyether Polyols Industry Revenue Share (%), by End-user Industry 2024 & 2032
- Figure 54: Europe Polyether Polyols Industry Volume Share (%), by End-user Industry 2024 & 2032
- Figure 55: Europe Polyether Polyols Industry Revenue (Million), by Country 2024 & 2032
- Figure 56: Europe Polyether Polyols Industry Volume (K Tons), by Country 2024 & 2032
- Figure 57: Europe Polyether Polyols Industry Revenue Share (%), by Country 2024 & 2032
- Figure 58: Europe Polyether Polyols Industry Volume Share (%), by Country 2024 & 2032
- Figure 59: South America Polyether Polyols Industry Revenue (Million), by Type 2024 & 2032
- Figure 60: South America Polyether Polyols Industry Volume (K Tons), by Type 2024 & 2032
- Figure 61: South America Polyether Polyols Industry Revenue Share (%), by Type 2024 & 2032
- Figure 62: South America Polyether Polyols Industry Volume Share (%), by Type 2024 & 2032
- Figure 63: South America Polyether Polyols Industry Revenue (Million), by End-user Industry 2024 & 2032
- Figure 64: South America Polyether Polyols Industry Volume (K Tons), by End-user Industry 2024 & 2032
- Figure 65: South America Polyether Polyols Industry Revenue Share (%), by End-user Industry 2024 & 2032
- Figure 66: South America Polyether Polyols Industry Volume Share (%), by End-user Industry 2024 & 2032
- Figure 67: South America Polyether Polyols Industry Revenue (Million), by Country 2024 & 2032
- Figure 68: South America Polyether Polyols Industry Volume (K Tons), by Country 2024 & 2032
- Figure 69: South America Polyether Polyols Industry Revenue Share (%), by Country 2024 & 2032
- Figure 70: South America Polyether Polyols Industry Volume Share (%), by Country 2024 & 2032
- Figure 71: Middle East and Africa Polyether Polyols Industry Revenue (Million), by Type 2024 & 2032
- Figure 72: Middle East and Africa Polyether Polyols Industry Volume (K Tons), by Type 2024 & 2032
- Figure 73: Middle East and Africa Polyether Polyols Industry Revenue Share (%), by Type 2024 & 2032
- Figure 74: Middle East and Africa Polyether Polyols Industry Volume Share (%), by Type 2024 & 2032
- Figure 75: Middle East and Africa Polyether Polyols Industry Revenue (Million), by End-user Industry 2024 & 2032
- Figure 76: Middle East and Africa Polyether Polyols Industry Volume (K Tons), by End-user Industry 2024 & 2032
- Figure 77: Middle East and Africa Polyether Polyols Industry Revenue Share (%), by End-user Industry 2024 & 2032
- Figure 78: Middle East and Africa Polyether Polyols Industry Volume Share (%), by End-user Industry 2024 & 2032
- Figure 79: Middle East and Africa Polyether Polyols Industry Revenue (Million), by Country 2024 & 2032
- Figure 80: Middle East and Africa Polyether Polyols Industry Volume (K Tons), by Country 2024 & 2032
- Figure 81: Middle East and Africa Polyether Polyols Industry Revenue Share (%), by Country 2024 & 2032
- Figure 82: Middle East and Africa Polyether Polyols Industry Volume Share (%), by Country 2024 & 2032
List of Tables
- Table 1: Global Polyether Polyols Industry Revenue Million Forecast, by Region 2019 & 2032
- Table 2: Global Polyether Polyols Industry Volume K Tons Forecast, by Region 2019 & 2032
- Table 3: Global Polyether Polyols Industry Revenue Million Forecast, by Type 2019 & 2032
- Table 4: Global Polyether Polyols Industry Volume K Tons Forecast, by Type 2019 & 2032
- Table 5: Global Polyether Polyols Industry Revenue Million Forecast, by End-user Industry 2019 & 2032
- Table 6: Global Polyether Polyols Industry Volume K Tons Forecast, by End-user Industry 2019 & 2032
- Table 7: Global Polyether Polyols Industry Revenue Million Forecast, by Region 2019 & 2032
- Table 8: Global Polyether Polyols Industry Volume K Tons Forecast, by Region 2019 & 2032
- Table 9: Global Polyether Polyols Industry Revenue Million Forecast, by Country 2019 & 2032
- Table 10: Global Polyether Polyols Industry Volume K Tons Forecast, by Country 2019 & 2032
- Table 11: United States Polyether Polyols Industry Revenue (Million) Forecast, by Application 2019 & 2032
- Table 12: United States Polyether Polyols Industry Volume (K Tons) Forecast, by Application 2019 & 2032
- Table 13: Canada Polyether Polyols Industry Revenue (Million) Forecast, by Application 2019 & 2032
- Table 14: Canada Polyether Polyols Industry Volume (K Tons) Forecast, by Application 2019 & 2032
- Table 15: Mexico Polyether Polyols Industry Revenue (Million) Forecast, by Application 2019 & 2032
- Table 16: Mexico Polyether Polyols Industry Volume (K Tons) Forecast, by Application 2019 & 2032
- Table 17: Global Polyether Polyols Industry Revenue Million Forecast, by Country 2019 & 2032
- Table 18: Global Polyether Polyols Industry Volume K Tons Forecast, by Country 2019 & 2032
- Table 19: Germany Polyether Polyols Industry Revenue (Million) Forecast, by Application 2019 & 2032
- Table 20: Germany Polyether Polyols Industry Volume (K Tons) Forecast, by Application 2019 & 2032
- Table 21: France Polyether Polyols Industry Revenue (Million) Forecast, by Application 2019 & 2032
- Table 22: France Polyether Polyols Industry Volume (K Tons) Forecast, by Application 2019 & 2032
- Table 23: Italy Polyether Polyols Industry Revenue (Million) Forecast, by Application 2019 & 2032
- Table 24: Italy Polyether Polyols Industry Volume (K Tons) Forecast, by Application 2019 & 2032
- Table 25: United Kingdom Polyether Polyols Industry Revenue (Million) Forecast, by Application 2019 & 2032
- Table 26: United Kingdom Polyether Polyols Industry Volume (K Tons) Forecast, by Application 2019 & 2032
- Table 27: Netherlands Polyether Polyols Industry Revenue (Million) Forecast, by Application 2019 & 2032
- Table 28: Netherlands Polyether Polyols Industry Volume (K Tons) Forecast, by Application 2019 & 2032
- Table 29: Rest of Europe Polyether Polyols Industry Revenue (Million) Forecast, by Application 2019 & 2032
- Table 30: Rest of Europe Polyether Polyols Industry Volume (K Tons) Forecast, by Application 2019 & 2032
- Table 31: Global Polyether Polyols Industry Revenue Million Forecast, by Country 2019 & 2032
- Table 32: Global Polyether Polyols Industry Volume K Tons Forecast, by Country 2019 & 2032
- Table 33: China Polyether Polyols Industry Revenue (Million) Forecast, by Application 2019 & 2032
- Table 34: China Polyether Polyols Industry Volume (K Tons) Forecast, by Application 2019 & 2032
- Table 35: Japan Polyether Polyols Industry Revenue (Million) Forecast, by Application 2019 & 2032
- Table 36: Japan Polyether Polyols Industry Volume (K Tons) Forecast, by Application 2019 & 2032
- Table 37: India Polyether Polyols Industry Revenue (Million) Forecast, by Application 2019 & 2032
- Table 38: India Polyether Polyols Industry Volume (K Tons) Forecast, by Application 2019 & 2032
- Table 39: South Korea Polyether Polyols Industry Revenue (Million) Forecast, by Application 2019 & 2032
- Table 40: South Korea Polyether Polyols Industry Volume (K Tons) Forecast, by Application 2019 & 2032
- Table 41: Taiwan Polyether Polyols Industry Revenue (Million) Forecast, by Application 2019 & 2032
- Table 42: Taiwan Polyether Polyols Industry Volume (K Tons) Forecast, by Application 2019 & 2032
- Table 43: Australia Polyether Polyols Industry Revenue (Million) Forecast, by Application 2019 & 2032
- Table 44: Australia Polyether Polyols Industry Volume (K Tons) Forecast, by Application 2019 & 2032
- Table 45: Rest of Asia-Pacific Polyether Polyols Industry Revenue (Million) Forecast, by Application 2019 & 2032
- Table 46: Rest of Asia-Pacific Polyether Polyols Industry Volume (K Tons) Forecast, by Application 2019 & 2032
- Table 47: Global Polyether Polyols Industry Revenue Million Forecast, by Country 2019 & 2032
- Table 48: Global Polyether Polyols Industry Volume K Tons Forecast, by Country 2019 & 2032
- Table 49: Brazil Polyether Polyols Industry Revenue (Million) Forecast, by Application 2019 & 2032
- Table 50: Brazil Polyether Polyols Industry Volume (K Tons) Forecast, by Application 2019 & 2032
- Table 51: Argentina Polyether Polyols Industry Revenue (Million) Forecast, by Application 2019 & 2032
- Table 52: Argentina Polyether Polyols Industry Volume (K Tons) Forecast, by Application 2019 & 2032
- Table 53: Rest of South America Polyether Polyols Industry Revenue (Million) Forecast, by Application 2019 & 2032
- Table 54: Rest of South America Polyether Polyols Industry Volume (K Tons) Forecast, by Application 2019 & 2032
- Table 55: Global Polyether Polyols Industry Revenue Million Forecast, by Country 2019 & 2032
- Table 56: Global Polyether Polyols Industry Volume K Tons Forecast, by Country 2019 & 2032
- Table 57: Middle East Polyether Polyols Industry Revenue (Million) Forecast, by Application 2019 & 2032
- Table 58: Middle East Polyether Polyols Industry Volume (K Tons) Forecast, by Application 2019 & 2032
- Table 59: Africa Polyether Polyols Industry Revenue (Million) Forecast, by Application 2019 & 2032
- Table 60: Africa Polyether Polyols Industry Volume (K Tons) Forecast, by Application 2019 & 2032
- Table 61: Global Polyether Polyols Industry Revenue Million Forecast, by Type 2019 & 2032
- Table 62: Global Polyether Polyols Industry Volume K Tons Forecast, by Type 2019 & 2032
- Table 63: Global Polyether Polyols Industry Revenue Million Forecast, by End-user Industry 2019 & 2032
- Table 64: Global Polyether Polyols Industry Volume K Tons Forecast, by End-user Industry 2019 & 2032
- Table 65: Global Polyether Polyols Industry Revenue Million Forecast, by Country 2019 & 2032
- Table 66: Global Polyether Polyols Industry Volume K Tons Forecast, by Country 2019 & 2032
- Table 67: China Polyether Polyols Industry Revenue (Million) Forecast, by Application 2019 & 2032
- Table 68: China Polyether Polyols Industry Volume (K Tons) Forecast, by Application 2019 & 2032
- Table 69: India Polyether Polyols Industry Revenue (Million) Forecast, by Application 2019 & 2032
- Table 70: India Polyether Polyols Industry Volume (K Tons) Forecast, by Application 2019 & 2032
- Table 71: Japan Polyether Polyols Industry Revenue (Million) Forecast, by Application 2019 & 2032
- Table 72: Japan Polyether Polyols Industry Volume (K Tons) Forecast, by Application 2019 & 2032
- Table 73: South Korea Polyether Polyols Industry Revenue (Million) Forecast, by Application 2019 & 2032
- Table 74: South Korea Polyether Polyols Industry Volume (K Tons) Forecast, by Application 2019 & 2032
- Table 75: Rest of Asia Pacific Polyether Polyols Industry Revenue (Million) Forecast, by Application 2019 & 2032
- Table 76: Rest of Asia Pacific Polyether Polyols Industry Volume (K Tons) Forecast, by Application 2019 & 2032
- Table 77: Global Polyether Polyols Industry Revenue Million Forecast, by Type 2019 & 2032
- Table 78: Global Polyether Polyols Industry Volume K Tons Forecast, by Type 2019 & 2032
- Table 79: Global Polyether Polyols Industry Revenue Million Forecast, by End-user Industry 2019 & 2032
- Table 80: Global Polyether Polyols Industry Volume K Tons Forecast, by End-user Industry 2019 & 2032
- Table 81: Global Polyether Polyols Industry Revenue Million Forecast, by Country 2019 & 2032
- Table 82: Global Polyether Polyols Industry Volume K Tons Forecast, by Country 2019 & 2032
- Table 83: United States Polyether Polyols Industry Revenue (Million) Forecast, by Application 2019 & 2032
- Table 84: United States Polyether Polyols Industry Volume (K Tons) Forecast, by Application 2019 & 2032
- Table 85: Canada Polyether Polyols Industry Revenue (Million) Forecast, by Application 2019 & 2032
- Table 86: Canada Polyether Polyols Industry Volume (K Tons) Forecast, by Application 2019 & 2032
- Table 87: Mexico Polyether Polyols Industry Revenue (Million) Forecast, by Application 2019 & 2032
- Table 88: Mexico Polyether Polyols Industry Volume (K Tons) Forecast, by Application 2019 & 2032
- Table 89: Global Polyether Polyols Industry Revenue Million Forecast, by Type 2019 & 2032
- Table 90: Global Polyether Polyols Industry Volume K Tons Forecast, by Type 2019 & 2032
- Table 91: Global Polyether Polyols Industry Revenue Million Forecast, by End-user Industry 2019 & 2032
- Table 92: Global Polyether Polyols Industry Volume K Tons Forecast, by End-user Industry 2019 & 2032
- Table 93: Global Polyether Polyols Industry Revenue Million Forecast, by Country 2019 & 2032
- Table 94: Global Polyether Polyols Industry Volume K Tons Forecast, by Country 2019 & 2032
- Table 95: Germany Polyether Polyols Industry Revenue (Million) Forecast, by Application 2019 & 2032
- Table 96: Germany Polyether Polyols Industry Volume (K Tons) Forecast, by Application 2019 & 2032
- Table 97: United Kingdom Polyether Polyols Industry Revenue (Million) Forecast, by Application 2019 & 2032
- Table 98: United Kingdom Polyether Polyols Industry Volume (K Tons) Forecast, by Application 2019 & 2032
- Table 99: Italy Polyether Polyols Industry Revenue (Million) Forecast, by Application 2019 & 2032
- Table 100: Italy Polyether Polyols Industry Volume (K Tons) Forecast, by Application 2019 & 2032
- Table 101: France Polyether Polyols Industry Revenue (Million) Forecast, by Application 2019 & 2032
- Table 102: France Polyether Polyols Industry Volume (K Tons) Forecast, by Application 2019 & 2032
- Table 103: Rest of Europe Polyether Polyols Industry Revenue (Million) Forecast, by Application 2019 & 2032
- Table 104: Rest of Europe Polyether Polyols Industry Volume (K Tons) Forecast, by Application 2019 & 2032
- Table 105: Global Polyether Polyols Industry Revenue Million Forecast, by Type 2019 & 2032
- Table 106: Global Polyether Polyols Industry Volume K Tons Forecast, by Type 2019 & 2032
- Table 107: Global Polyether Polyols Industry Revenue Million Forecast, by End-user Industry 2019 & 2032
- Table 108: Global Polyether Polyols Industry Volume K Tons Forecast, by End-user Industry 2019 & 2032
- Table 109: Global Polyether Polyols Industry Revenue Million Forecast, by Country 2019 & 2032
- Table 110: Global Polyether Polyols Industry Volume K Tons Forecast, by Country 2019 & 2032
- Table 111: Brazil Polyether Polyols Industry Revenue (Million) Forecast, by Application 2019 & 2032
- Table 112: Brazil Polyether Polyols Industry Volume (K Tons) Forecast, by Application 2019 & 2032
- Table 113: Argentina Polyether Polyols Industry Revenue (Million) Forecast, by Application 2019 & 2032
- Table 114: Argentina Polyether Polyols Industry Volume (K Tons) Forecast, by Application 2019 & 2032
- Table 115: Rest of South America Polyether Polyols Industry Revenue (Million) Forecast, by Application 2019 & 2032
- Table 116: Rest of South America Polyether Polyols Industry Volume (K Tons) Forecast, by Application 2019 & 2032
- Table 117: Global Polyether Polyols Industry Revenue Million Forecast, by Type 2019 & 2032
- Table 118: Global Polyether Polyols Industry Volume K Tons Forecast, by Type 2019 & 2032
- Table 119: Global Polyether Polyols Industry Revenue Million Forecast, by End-user Industry 2019 & 2032
- Table 120: Global Polyether Polyols Industry Volume K Tons Forecast, by End-user Industry 2019 & 2032
- Table 121: Global Polyether Polyols Industry Revenue Million Forecast, by Country 2019 & 2032
- Table 122: Global Polyether Polyols Industry Volume K Tons Forecast, by Country 2019 & 2032
- Table 123: Saudi Arabia Polyether Polyols Industry Revenue (Million) Forecast, by Application 2019 & 2032
- Table 124: Saudi Arabia Polyether Polyols Industry Volume (K Tons) Forecast, by Application 2019 & 2032
- Table 125: South Africa Polyether Polyols Industry Revenue (Million) Forecast, by Application 2019 & 2032
- Table 126: South Africa Polyether Polyols Industry Volume (K Tons) Forecast, by Application 2019 & 2032
- Table 127: Rest of Middle East and Africa Polyether Polyols Industry Revenue (Million) Forecast, by Application 2019 & 2032
- Table 128: Rest of Middle East and Africa Polyether Polyols Industry Volume (K Tons) Forecast, by Application 2019 & 2032
Frequently Asked Questions
1. What is the projected Compound Annual Growth Rate (CAGR) of the Polyether Polyols Industry?
The projected CAGR is approximately > 5.00%.
2. Which companies are prominent players in the Polyether Polyols Industry?
Key companies in the market include Arpadis Benelux NV, Solvay, Shell plc, China Petrochemical Corporation, Repsol, BASF SE, Huntsman International LLC, Dow, Covestro AG, PCC Group, Purinova Sp z o o.
3. What are the main segments of the Polyether Polyols Industry?
The market segments include Type, End-user Industry.
4. Can you provide details about the market size?
The market size is estimated to be USD XX Million as of 2022.
5. What are some drivers contributing to market growth?
Rising Demand for Flexible and Rigid Polyurethane Foam; Growth of Automotive Industry; Rising Demand from Construction Industry.
6. What are the notable trends driving market growth?
Rising Demand from Construction Industry.
7. Are there any restraints impacting market growth?
Volatile Prices of Raw Materials; Stringent Government Regulations on Polyurethane Foam Manufacturing.
8. Can you provide examples of recent developments in the market?
In December 2021, PCC Group has expanded its production capacity and the range of manufactured products. The installation is to produce a range of ethoxylates, polyether polyols, and other ethoxylated products, including biodegradable products.
9. What pricing options are available for accessing the report?
Pricing options include single-user, multi-user, and enterprise licenses priced at USD 4750, USD 5250, and USD 8750 respectively.
10. Is the market size provided in terms of value or volume?
The market size is provided in terms of value, measured in Million and volume, measured in K Tons.
11. Are there any specific market keywords associated with the report?
Yes, the market keyword associated with the report is "Polyether Polyols Industry," which aids in identifying and referencing the specific market segment covered.
12. How do I determine which pricing option suits my needs best?
The pricing options vary based on user requirements and access needs. Individual users may opt for single-user licenses, while businesses requiring broader access may choose multi-user or enterprise licenses for cost-effective access to the report.
13. Are there any additional resources or data provided in the Polyether Polyols Industry report?
While the report offers comprehensive insights, it's advisable to review the specific contents or supplementary materials provided to ascertain if additional resources or data are available.
14. How can I stay updated on further developments or reports in the Polyether Polyols Industry?
To stay informed about further developments, trends, and reports in the Polyether Polyols Industry, consider subscribing to industry newsletters, following relevant companies and organizations, or regularly checking reputable industry news sources and publications.
Methodology
Step 1 - Identification of Relevant Samples Size from Population Database


Step 2 - Approaches for Defining Global Market Size (Value, Volume* & Price*)

Note*: In applicable scenarios
Step 3 - Data Sources
Primary Research
- Web Analytics
- Survey Reports
- Research Institute
- Latest Research Reports
- Opinion Leaders
Secondary Research
- Annual Reports
- White Paper
- Latest Press Release
- Industry Association
- Paid Database
- Investor Presentations

Step 4 - Data Triangulation
Involves using different sources of information in order to increase the validity of a study
These sources are likely to be stakeholders in a program - participants, other researchers, program staff, other community members, and so on.
Then we put all data in single framework & apply various statistical tools to find out the dynamic on the market.
During the analysis stage, feedback from the stakeholder groups would be compared to determine areas of agreement as well as areas of divergence


