
Key Insights
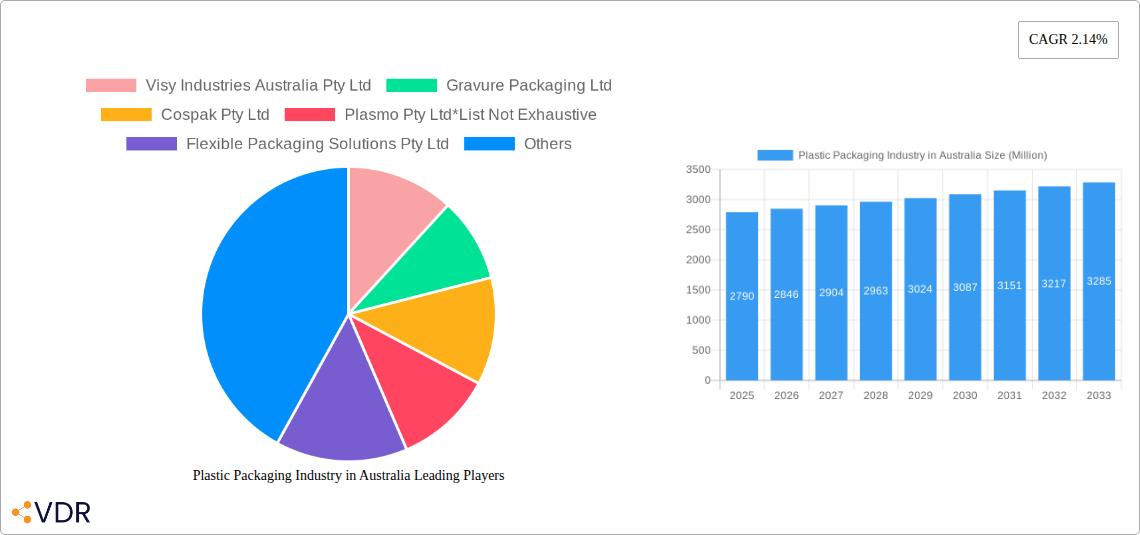
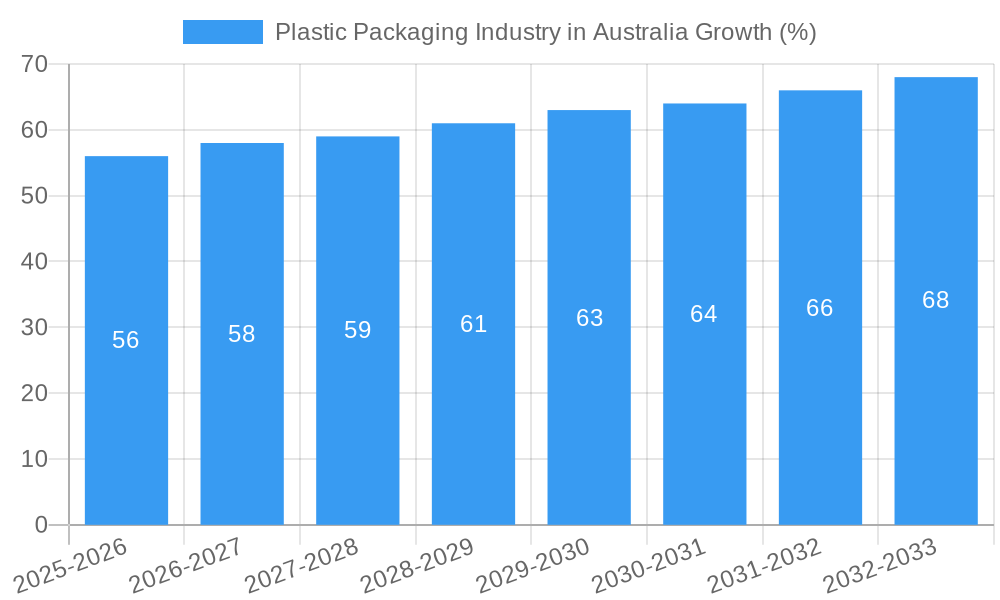
The Australian plastic packaging market, valued at $2.79 billion in 2025, is projected to experience steady growth, driven by a Compound Annual Growth Rate (CAGR) of 2.14% from 2025 to 2033. This growth is fueled by several key factors. The expanding food and beverage sector, coupled with increasing demand for convenient and safe packaging solutions across healthcare and personal care, significantly boosts market demand. E-commerce proliferation contributes to higher demand for protective packaging materials like stretch film, while the agricultural sector relies heavily on plastic films for preservation and transportation. However, growing environmental concerns and stringent regulations regarding plastic waste are acting as significant restraints, pushing manufacturers towards sustainable alternatives like biodegradable and recycled plastics. The market is segmented into rigid and flexible packaging, with rigid packaging dominating due to its use in food and beverage containers. Polyethylene (PE) is the primary material in both segments, reflecting its cost-effectiveness and versatility. Key players like Visy Industries Australia, Orora Packaging, and Pact Group Holdings are leading the market, employing strategies focused on innovation and sustainability to maintain their competitive edge. This includes exploring new material compositions, focusing on efficient recycling methods, and adapting to evolving consumer preferences.
The projected market value in 2033, based on the given CAGR, will likely exceed $3.5 billion, though the precise figure is sensitive to evolving regulatory landscapes and the rate of adoption of sustainable packaging options. Companies are investing in advanced technologies to improve efficiency and reduce their environmental impact. The market's growth trajectory will depend significantly on the success of these initiatives and the ability to balance consumer demands for affordable packaging with environmental sustainability goals. The ongoing exploration of biodegradable alternatives and improved recycling infrastructure will play a crucial role in shaping the future of the Australian plastic packaging industry.
Plastic Packaging Industry in Australia: A Comprehensive Market Report (2019-2033)
This comprehensive report provides an in-depth analysis of the Australian plastic packaging industry, encompassing market dynamics, growth trends, key players, and future outlook. The report covers the period 2019-2033, with a focus on 2025 as the base and estimated year. It offers invaluable insights for industry professionals, investors, and strategic decision-makers seeking to navigate this dynamic market. The report segments the market across various parameters, providing granular data for informed business strategies. Market values are presented in million units.
Plastic Packaging Industry in Australia Market Dynamics & Structure
The Australian plastic packaging market is characterized by a moderate level of concentration, with a few dominant players and a larger number of smaller companies. Market share data for 2025 estimates Visy Industries at 25%, Orora Packaging at 15%, and Pact Group at 12%, with the remaining 48% distributed amongst numerous smaller players. Technological innovation is driven by sustainability concerns and increasing demand for lightweight, recyclable, and compostable packaging solutions.
The regulatory framework, including the National Plastics Plan, significantly influences market trends, pushing the industry towards greater sustainability. Major competitive product substitutes include paper, glass, and biodegradable alternatives. End-user demographics are diverse, reflecting Australia's consumer preferences across various sectors. M&A activity is moderate, with approximately xx deals recorded between 2019 and 2024.
- Market Concentration: Moderately concentrated, with a few large players dominating.
- Technological Innovation: Focused on sustainable and recyclable packaging.
- Regulatory Framework: Driven by environmental concerns and waste reduction targets.
- Competitive Substitutes: Paper, glass, biodegradable materials pose a growing threat.
- End-user Demographics: Diverse, spanning various sectors like food, beverage, healthcare, etc.
- M&A Activity: Moderate, with xx deals recorded in the historical period.
Plastic Packaging Industry in Australia Growth Trends & Insights
The Australian plastic packaging market exhibited a CAGR of xx% during the historical period (2019-2024), reaching an estimated market size of xx million units in 2025. The forecast period (2025-2033) projects continued growth, driven by factors such as population growth, rising consumption, and evolving consumer preferences towards convenience and sustainability. Technological disruptions, particularly in material science and packaging automation, are reshaping market dynamics. The increasing adoption of e-commerce also fuels demand for protective packaging. Consumer behaviour is shifting towards eco-conscious choices, resulting in greater demand for recyclable and sustainable packaging solutions. Market penetration of recyclable packaging is projected to reach xx% by 2033.
Dominant Regions, Countries, or Segments in Plastic Packaging Industry in Australia
The report identifies New South Wales and Victoria as the dominant regions, accounting for xx% of the total market value in 2025. Within segments, rigid packaging (particularly Polyethylene – PE) dominates due to its extensive use in the food and beverage sectors. Flexible packaging is also a significant segment experiencing rapid growth, with increasing demand for stand-up pouches and other innovative formats. The industrial plastic film market (stretch and agricultural films) shows steady growth, driven by the agricultural sector and logistics industries.
- Key Drivers:
- High consumption levels in major cities like Sydney and Melbourne.
- Strong agricultural sector driving demand for agricultural films.
- Robust food and beverage industries favoring rigid and flexible packaging.
- Dominance Factors:
- High population density and consumption in NSW and VIC.
- Established infrastructure and logistics networks.
- Strong manufacturing base and presence of major players.
Plastic Packaging Industry in Australia Product Landscape
The Australian plastic packaging market showcases a diverse range of products, encompassing rigid containers (bottles, tubs, jars), flexible films (pouches, wraps), and industrial films (stretch films, agricultural films). Technological advancements include lightweight designs, improved barrier properties, and incorporation of recycled content. Many companies focus on unique selling propositions such as enhanced recyclability, compostability, or improved shelf life for packaged goods.
Key Drivers, Barriers & Challenges in Plastic Packaging Industry in Australia
Key Drivers:
- Growing population and rising consumption levels.
- Expansion of e-commerce and demand for protective packaging.
- Technological innovations leading to lighter, stronger, and more sustainable packaging.
- Increased focus on food safety and preservation.
Key Challenges:
- Stringent environmental regulations and increasing pressure for waste reduction.
- Fluctuations in raw material prices (e.g., oil-based polymers).
- Intense competition and price pressures from both domestic and international players.
- Supply chain disruptions impacting timely delivery of packaging materials. This resulted in a xx% increase in lead times during 2022, impacting xx million units of production.
Emerging Opportunities in Plastic Packaging Industry in Australia
- Growing demand for sustainable and eco-friendly packaging solutions (bioplastics, recycled content).
- Expansion into specialized packaging segments (e.g., medical devices, pharmaceuticals).
- Rise of online grocery shopping and increased demand for home delivery packaging.
- Increased focus on flexible packaging solutions for improved convenience and reduced weight.
Growth Accelerators in the Plastic Packaging Industry in Australia Industry
Long-term growth will be fueled by technological advancements in material science, automation, and sustainable packaging solutions. Strategic partnerships between packaging companies and brands will drive innovation and enhance supply chain efficiency. Expansion into new markets (e.g., emerging e-commerce platforms), coupled with a focus on customized packaging solutions, will unlock substantial growth opportunities.
Key Players Shaping the Plastic Packaging Industry in Australia Market
- Visy Industries Australia Pty Ltd
- Gravure Packaging Ltd
- Cospak Pty Ltd
- Plasmo Pty Ltd
- Flexible Packaging Solutions Pty Ltd
- Orora Packaging Australia Pty Ltd
- A&M Packaging Pty Ltd
- Pact Group Holdings Australia Pty Ltd
- Caspak Products Pty Ltd
- Synergy Packaging (RPC Group)
- Pro-Pac Packaging Pty Ltd
- Filton Packaging Pty Ltd
- Econopak Flexible Packaging
- Vacupack Pty Ltd
Notable Milestones in Plastic Packaging Industry in Australia Sector
- February 2022: Cadbury Australia commits to using recycled plastic for 50 million family-sized chocolate blocks.
- July 2022: Nestlé Australia launches KitKat wrappers with 30% recycled plastic, reducing virgin plastic use by 250,000 m².
- October 2022: Mondelez Australia promotes recycled soft plastic packaging to meet 2025 goals.
In-Depth Plastic Packaging Industry in Australia Market Outlook
The Australian plastic packaging market is poised for sustained growth over the forecast period, driven by a combination of factors, including increasing consumption, a thriving e-commerce sector, and a growing emphasis on sustainable packaging options. Strategic investments in innovative materials, automation, and efficient supply chains will be crucial for companies to maintain competitiveness and capitalize on emerging market opportunities. The focus on recyclability and reduction of environmental impact will be a key driver of innovation and market expansion in the coming years.
Plastic Packaging Industry in Australia Segmentation
-
1. Rigid Packaging
-
1.1. Material
- 1.1.1. Polyethylene Terephthalate (PET)
- 1.1.2. Polypropylene (PP)
- 1.1.3. Polystyrene (PS) and Expanded Polystyrene (EPS)
- 1.1.4. Polyvinyl Chloride (PVC)
- 1.1.5. Polyethene (PE)
-
1.2. Product
- 1.2.1. Bottles and Jars
- 1.2.2. Trays and Containers
- 1.2.3. Other Product Types
-
1.1. Material
-
2. Flexible Packaging
-
2.1. Material
- 2.1.1. Polyethene (PE)
- 2.1.2. Bi-orientated Polypropylene (BOPP)
- 2.1.3. Cast Polypropylene (CPP)
- 2.1.4. Polyvinyl Chloride (PVC)
- 2.1.5. Other Flexible Packaging Materials
-
2.2. Product
- 2.2.1. Pouches
- 2.2.2. Bags
- 2.2.3. Films and Wraps
- 2.2.4. Other Product Types
-
2.1. Material
-
3. Industrial Plastic Film Market
- 3.1. Stretch Film
- 3.2. Agricultural Film
-
4. End-user Industry
- 4.1. Food
- 4.2. Beverage
- 4.3. Healthcare
- 4.4. Personal Care and Household
- 4.5. Other End-user Industries
Plastic Packaging Industry in Australia Segmentation By Geography
-
1. North America
- 1.1. United States
- 1.2. Canada
- 1.3. Mexico
-
2. South America
- 2.1. Brazil
- 2.2. Argentina
- 2.3. Rest of South America
-
3. Europe
- 3.1. United Kingdom
- 3.2. Germany
- 3.3. France
- 3.4. Italy
- 3.5. Spain
- 3.6. Russia
- 3.7. Benelux
- 3.8. Nordics
- 3.9. Rest of Europe
-
4. Middle East & Africa
- 4.1. Turkey
- 4.2. Israel
- 4.3. GCC
- 4.4. North Africa
- 4.5. South Africa
- 4.6. Rest of Middle East & Africa
-
5. Asia Pacific
- 5.1. China
- 5.2. India
- 5.3. Japan
- 5.4. South Korea
- 5.5. ASEAN
- 5.6. Oceania
- 5.7. Rest of Asia Pacific
Plastic Packaging Industry in Australia REPORT HIGHLIGHTS
| Aspects | Details |
|---|---|
| Study Period | 2019-2033 |
| Base Year | 2024 |
| Estimated Year | 2025 |
| Forecast Period | 2025-2033 |
| Historical Period | 2019-2024 |
| Growth Rate | CAGR of 2.14% from 2019-2033 |
| Segmentation |
|
Table of Contents
- 1. Introduction
- 1.1. Research Scope
- 1.2. Market Segmentation
- 1.3. Research Methodology
- 1.4. Definitions and Assumptions
- 2. Executive Summary
- 2.1. Introduction
- 3. Market Dynamics
- 3.1. Introduction
- 3.2. Market Drivers
- 3.2.1. Increasing Demand from the Food Industry; Increased Eco-friendly Packaging and Recycled Plastics
- 3.3. Market Restrains
- 3.3.1. 4.; Fluctuating Cost of Raw Materials
- 3.4. Market Trends
- 3.4.1. Increasing Demand from the Food Industry
- 4. Market Factor Analysis
- 4.1. Porters Five Forces
- 4.2. Supply/Value Chain
- 4.3. PESTEL analysis
- 4.4. Market Entropy
- 4.5. Patent/Trademark Analysis
- 5. Global Plastic Packaging Industry in Australia Analysis, Insights and Forecast, 2019-2031
- 5.1. Market Analysis, Insights and Forecast - by Rigid Packaging
- 5.1.1. Material
- 5.1.1.1. Polyethylene Terephthalate (PET)
- 5.1.1.2. Polypropylene (PP)
- 5.1.1.3. Polystyrene (PS) and Expanded Polystyrene (EPS)
- 5.1.1.4. Polyvinyl Chloride (PVC)
- 5.1.1.5. Polyethene (PE)
- 5.1.2. Product
- 5.1.2.1. Bottles and Jars
- 5.1.2.2. Trays and Containers
- 5.1.2.3. Other Product Types
- 5.1.1. Material
- 5.2. Market Analysis, Insights and Forecast - by Flexible Packaging
- 5.2.1. Material
- 5.2.1.1. Polyethene (PE)
- 5.2.1.2. Bi-orientated Polypropylene (BOPP)
- 5.2.1.3. Cast Polypropylene (CPP)
- 5.2.1.4. Polyvinyl Chloride (PVC)
- 5.2.1.5. Other Flexible Packaging Materials
- 5.2.2. Product
- 5.2.2.1. Pouches
- 5.2.2.2. Bags
- 5.2.2.3. Films and Wraps
- 5.2.2.4. Other Product Types
- 5.2.1. Material
- 5.3. Market Analysis, Insights and Forecast - by Industrial Plastic Film Market
- 5.3.1. Stretch Film
- 5.3.2. Agricultural Film
- 5.4. Market Analysis, Insights and Forecast - by End-user Industry
- 5.4.1. Food
- 5.4.2. Beverage
- 5.4.3. Healthcare
- 5.4.4. Personal Care and Household
- 5.4.5. Other End-user Industries
- 5.5. Market Analysis, Insights and Forecast - by Region
- 5.5.1. North America
- 5.5.2. South America
- 5.5.3. Europe
- 5.5.4. Middle East & Africa
- 5.5.5. Asia Pacific
- 5.1. Market Analysis, Insights and Forecast - by Rigid Packaging
- 6. North America Plastic Packaging Industry in Australia Analysis, Insights and Forecast, 2019-2031
- 6.1. Market Analysis, Insights and Forecast - by Rigid Packaging
- 6.1.1. Material
- 6.1.1.1. Polyethylene Terephthalate (PET)
- 6.1.1.2. Polypropylene (PP)
- 6.1.1.3. Polystyrene (PS) and Expanded Polystyrene (EPS)
- 6.1.1.4. Polyvinyl Chloride (PVC)
- 6.1.1.5. Polyethene (PE)
- 6.1.2. Product
- 6.1.2.1. Bottles and Jars
- 6.1.2.2. Trays and Containers
- 6.1.2.3. Other Product Types
- 6.1.1. Material
- 6.2. Market Analysis, Insights and Forecast - by Flexible Packaging
- 6.2.1. Material
- 6.2.1.1. Polyethene (PE)
- 6.2.1.2. Bi-orientated Polypropylene (BOPP)
- 6.2.1.3. Cast Polypropylene (CPP)
- 6.2.1.4. Polyvinyl Chloride (PVC)
- 6.2.1.5. Other Flexible Packaging Materials
- 6.2.2. Product
- 6.2.2.1. Pouches
- 6.2.2.2. Bags
- 6.2.2.3. Films and Wraps
- 6.2.2.4. Other Product Types
- 6.2.1. Material
- 6.3. Market Analysis, Insights and Forecast - by Industrial Plastic Film Market
- 6.3.1. Stretch Film
- 6.3.2. Agricultural Film
- 6.4. Market Analysis, Insights and Forecast - by End-user Industry
- 6.4.1. Food
- 6.4.2. Beverage
- 6.4.3. Healthcare
- 6.4.4. Personal Care and Household
- 6.4.5. Other End-user Industries
- 6.1. Market Analysis, Insights and Forecast - by Rigid Packaging
- 7. South America Plastic Packaging Industry in Australia Analysis, Insights and Forecast, 2019-2031
- 7.1. Market Analysis, Insights and Forecast - by Rigid Packaging
- 7.1.1. Material
- 7.1.1.1. Polyethylene Terephthalate (PET)
- 7.1.1.2. Polypropylene (PP)
- 7.1.1.3. Polystyrene (PS) and Expanded Polystyrene (EPS)
- 7.1.1.4. Polyvinyl Chloride (PVC)
- 7.1.1.5. Polyethene (PE)
- 7.1.2. Product
- 7.1.2.1. Bottles and Jars
- 7.1.2.2. Trays and Containers
- 7.1.2.3. Other Product Types
- 7.1.1. Material
- 7.2. Market Analysis, Insights and Forecast - by Flexible Packaging
- 7.2.1. Material
- 7.2.1.1. Polyethene (PE)
- 7.2.1.2. Bi-orientated Polypropylene (BOPP)
- 7.2.1.3. Cast Polypropylene (CPP)
- 7.2.1.4. Polyvinyl Chloride (PVC)
- 7.2.1.5. Other Flexible Packaging Materials
- 7.2.2. Product
- 7.2.2.1. Pouches
- 7.2.2.2. Bags
- 7.2.2.3. Films and Wraps
- 7.2.2.4. Other Product Types
- 7.2.1. Material
- 7.3. Market Analysis, Insights and Forecast - by Industrial Plastic Film Market
- 7.3.1. Stretch Film
- 7.3.2. Agricultural Film
- 7.4. Market Analysis, Insights and Forecast - by End-user Industry
- 7.4.1. Food
- 7.4.2. Beverage
- 7.4.3. Healthcare
- 7.4.4. Personal Care and Household
- 7.4.5. Other End-user Industries
- 7.1. Market Analysis, Insights and Forecast - by Rigid Packaging
- 8. Europe Plastic Packaging Industry in Australia Analysis, Insights and Forecast, 2019-2031
- 8.1. Market Analysis, Insights and Forecast - by Rigid Packaging
- 8.1.1. Material
- 8.1.1.1. Polyethylene Terephthalate (PET)
- 8.1.1.2. Polypropylene (PP)
- 8.1.1.3. Polystyrene (PS) and Expanded Polystyrene (EPS)
- 8.1.1.4. Polyvinyl Chloride (PVC)
- 8.1.1.5. Polyethene (PE)
- 8.1.2. Product
- 8.1.2.1. Bottles and Jars
- 8.1.2.2. Trays and Containers
- 8.1.2.3. Other Product Types
- 8.1.1. Material
- 8.2. Market Analysis, Insights and Forecast - by Flexible Packaging
- 8.2.1. Material
- 8.2.1.1. Polyethene (PE)
- 8.2.1.2. Bi-orientated Polypropylene (BOPP)
- 8.2.1.3. Cast Polypropylene (CPP)
- 8.2.1.4. Polyvinyl Chloride (PVC)
- 8.2.1.5. Other Flexible Packaging Materials
- 8.2.2. Product
- 8.2.2.1. Pouches
- 8.2.2.2. Bags
- 8.2.2.3. Films and Wraps
- 8.2.2.4. Other Product Types
- 8.2.1. Material
- 8.3. Market Analysis, Insights and Forecast - by Industrial Plastic Film Market
- 8.3.1. Stretch Film
- 8.3.2. Agricultural Film
- 8.4. Market Analysis, Insights and Forecast - by End-user Industry
- 8.4.1. Food
- 8.4.2. Beverage
- 8.4.3. Healthcare
- 8.4.4. Personal Care and Household
- 8.4.5. Other End-user Industries
- 8.1. Market Analysis, Insights and Forecast - by Rigid Packaging
- 9. Middle East & Africa Plastic Packaging Industry in Australia Analysis, Insights and Forecast, 2019-2031
- 9.1. Market Analysis, Insights and Forecast - by Rigid Packaging
- 9.1.1. Material
- 9.1.1.1. Polyethylene Terephthalate (PET)
- 9.1.1.2. Polypropylene (PP)
- 9.1.1.3. Polystyrene (PS) and Expanded Polystyrene (EPS)
- 9.1.1.4. Polyvinyl Chloride (PVC)
- 9.1.1.5. Polyethene (PE)
- 9.1.2. Product
- 9.1.2.1. Bottles and Jars
- 9.1.2.2. Trays and Containers
- 9.1.2.3. Other Product Types
- 9.1.1. Material
- 9.2. Market Analysis, Insights and Forecast - by Flexible Packaging
- 9.2.1. Material
- 9.2.1.1. Polyethene (PE)
- 9.2.1.2. Bi-orientated Polypropylene (BOPP)
- 9.2.1.3. Cast Polypropylene (CPP)
- 9.2.1.4. Polyvinyl Chloride (PVC)
- 9.2.1.5. Other Flexible Packaging Materials
- 9.2.2. Product
- 9.2.2.1. Pouches
- 9.2.2.2. Bags
- 9.2.2.3. Films and Wraps
- 9.2.2.4. Other Product Types
- 9.2.1. Material
- 9.3. Market Analysis, Insights and Forecast - by Industrial Plastic Film Market
- 9.3.1. Stretch Film
- 9.3.2. Agricultural Film
- 9.4. Market Analysis, Insights and Forecast - by End-user Industry
- 9.4.1. Food
- 9.4.2. Beverage
- 9.4.3. Healthcare
- 9.4.4. Personal Care and Household
- 9.4.5. Other End-user Industries
- 9.1. Market Analysis, Insights and Forecast - by Rigid Packaging
- 10. Asia Pacific Plastic Packaging Industry in Australia Analysis, Insights and Forecast, 2019-2031
- 10.1. Market Analysis, Insights and Forecast - by Rigid Packaging
- 10.1.1. Material
- 10.1.1.1. Polyethylene Terephthalate (PET)
- 10.1.1.2. Polypropylene (PP)
- 10.1.1.3. Polystyrene (PS) and Expanded Polystyrene (EPS)
- 10.1.1.4. Polyvinyl Chloride (PVC)
- 10.1.1.5. Polyethene (PE)
- 10.1.2. Product
- 10.1.2.1. Bottles and Jars
- 10.1.2.2. Trays and Containers
- 10.1.2.3. Other Product Types
- 10.1.1. Material
- 10.2. Market Analysis, Insights and Forecast - by Flexible Packaging
- 10.2.1. Material
- 10.2.1.1. Polyethene (PE)
- 10.2.1.2. Bi-orientated Polypropylene (BOPP)
- 10.2.1.3. Cast Polypropylene (CPP)
- 10.2.1.4. Polyvinyl Chloride (PVC)
- 10.2.1.5. Other Flexible Packaging Materials
- 10.2.2. Product
- 10.2.2.1. Pouches
- 10.2.2.2. Bags
- 10.2.2.3. Films and Wraps
- 10.2.2.4. Other Product Types
- 10.2.1. Material
- 10.3. Market Analysis, Insights and Forecast - by Industrial Plastic Film Market
- 10.3.1. Stretch Film
- 10.3.2. Agricultural Film
- 10.4. Market Analysis, Insights and Forecast - by End-user Industry
- 10.4.1. Food
- 10.4.2. Beverage
- 10.4.3. Healthcare
- 10.4.4. Personal Care and Household
- 10.4.5. Other End-user Industries
- 10.1. Market Analysis, Insights and Forecast - by Rigid Packaging
- 11. Competitive Analysis
- 11.1. Global Market Share Analysis 2024
- 11.2. Company Profiles
- 11.2.1 Visy Industries Australia Pty Ltd
- 11.2.1.1. Overview
- 11.2.1.2. Products
- 11.2.1.3. SWOT Analysis
- 11.2.1.4. Recent Developments
- 11.2.1.5. Financials (Based on Availability)
- 11.2.2 Gravure Packaging Ltd
- 11.2.2.1. Overview
- 11.2.2.2. Products
- 11.2.2.3. SWOT Analysis
- 11.2.2.4. Recent Developments
- 11.2.2.5. Financials (Based on Availability)
- 11.2.3 Cospak Pty Ltd
- 11.2.3.1. Overview
- 11.2.3.2. Products
- 11.2.3.3. SWOT Analysis
- 11.2.3.4. Recent Developments
- 11.2.3.5. Financials (Based on Availability)
- 11.2.4 Plasmo Pty Ltd*List Not Exhaustive
- 11.2.4.1. Overview
- 11.2.4.2. Products
- 11.2.4.3. SWOT Analysis
- 11.2.4.4. Recent Developments
- 11.2.4.5. Financials (Based on Availability)
- 11.2.5 Flexible Packaging Solutions Pty Ltd
- 11.2.5.1. Overview
- 11.2.5.2. Products
- 11.2.5.3. SWOT Analysis
- 11.2.5.4. Recent Developments
- 11.2.5.5. Financials (Based on Availability)
- 11.2.6 Orora Packaging Australia Pty Ltd
- 11.2.6.1. Overview
- 11.2.6.2. Products
- 11.2.6.3. SWOT Analysis
- 11.2.6.4. Recent Developments
- 11.2.6.5. Financials (Based on Availability)
- 11.2.7 A&M Packaging Pty Ltd
- 11.2.7.1. Overview
- 11.2.7.2. Products
- 11.2.7.3. SWOT Analysis
- 11.2.7.4. Recent Developments
- 11.2.7.5. Financials (Based on Availability)
- 11.2.8 Pact Group Holdings Australia Pty Ltd
- 11.2.8.1. Overview
- 11.2.8.2. Products
- 11.2.8.3. SWOT Analysis
- 11.2.8.4. Recent Developments
- 11.2.8.5. Financials (Based on Availability)
- 11.2.9 Caspak Products Pty Ltd
- 11.2.9.1. Overview
- 11.2.9.2. Products
- 11.2.9.3. SWOT Analysis
- 11.2.9.4. Recent Developments
- 11.2.9.5. Financials (Based on Availability)
- 11.2.10 Synergy Packaging (RPC Group)
- 11.2.10.1. Overview
- 11.2.10.2. Products
- 11.2.10.3. SWOT Analysis
- 11.2.10.4. Recent Developments
- 11.2.10.5. Financials (Based on Availability)
- 11.2.11 Pro-Pac Packaging Pty Ltd
- 11.2.11.1. Overview
- 11.2.11.2. Products
- 11.2.11.3. SWOT Analysis
- 11.2.11.4. Recent Developments
- 11.2.11.5. Financials (Based on Availability)
- 11.2.12 Filton Packaging Pty Ltd
- 11.2.12.1. Overview
- 11.2.12.2. Products
- 11.2.12.3. SWOT Analysis
- 11.2.12.4. Recent Developments
- 11.2.12.5. Financials (Based on Availability)
- 11.2.13 Econopak Flexible Packaging
- 11.2.13.1. Overview
- 11.2.13.2. Products
- 11.2.13.3. SWOT Analysis
- 11.2.13.4. Recent Developments
- 11.2.13.5. Financials (Based on Availability)
- 11.2.14 Vacupack Pty Ltd
- 11.2.14.1. Overview
- 11.2.14.2. Products
- 11.2.14.3. SWOT Analysis
- 11.2.14.4. Recent Developments
- 11.2.14.5. Financials (Based on Availability)
- 11.2.1 Visy Industries Australia Pty Ltd
List of Figures
- Figure 1: Global Plastic Packaging Industry in Australia Revenue Breakdown (Million, %) by Region 2024 & 2032
- Figure 2: Global Plastic Packaging Industry in Australia Volume Breakdown (K Tons, %) by Region 2024 & 2032
- Figure 3: Australia Plastic Packaging Industry in Australia Revenue (Million), by Country 2024 & 2032
- Figure 4: Australia Plastic Packaging Industry in Australia Volume (K Tons), by Country 2024 & 2032
- Figure 5: Australia Plastic Packaging Industry in Australia Revenue Share (%), by Country 2024 & 2032
- Figure 6: Australia Plastic Packaging Industry in Australia Volume Share (%), by Country 2024 & 2032
- Figure 7: North America Plastic Packaging Industry in Australia Revenue (Million), by Rigid Packaging 2024 & 2032
- Figure 8: North America Plastic Packaging Industry in Australia Volume (K Tons), by Rigid Packaging 2024 & 2032
- Figure 9: North America Plastic Packaging Industry in Australia Revenue Share (%), by Rigid Packaging 2024 & 2032
- Figure 10: North America Plastic Packaging Industry in Australia Volume Share (%), by Rigid Packaging 2024 & 2032
- Figure 11: North America Plastic Packaging Industry in Australia Revenue (Million), by Flexible Packaging 2024 & 2032
- Figure 12: North America Plastic Packaging Industry in Australia Volume (K Tons), by Flexible Packaging 2024 & 2032
- Figure 13: North America Plastic Packaging Industry in Australia Revenue Share (%), by Flexible Packaging 2024 & 2032
- Figure 14: North America Plastic Packaging Industry in Australia Volume Share (%), by Flexible Packaging 2024 & 2032
- Figure 15: North America Plastic Packaging Industry in Australia Revenue (Million), by Industrial Plastic Film Market 2024 & 2032
- Figure 16: North America Plastic Packaging Industry in Australia Volume (K Tons), by Industrial Plastic Film Market 2024 & 2032
- Figure 17: North America Plastic Packaging Industry in Australia Revenue Share (%), by Industrial Plastic Film Market 2024 & 2032
- Figure 18: North America Plastic Packaging Industry in Australia Volume Share (%), by Industrial Plastic Film Market 2024 & 2032
- Figure 19: North America Plastic Packaging Industry in Australia Revenue (Million), by End-user Industry 2024 & 2032
- Figure 20: North America Plastic Packaging Industry in Australia Volume (K Tons), by End-user Industry 2024 & 2032
- Figure 21: North America Plastic Packaging Industry in Australia Revenue Share (%), by End-user Industry 2024 & 2032
- Figure 22: North America Plastic Packaging Industry in Australia Volume Share (%), by End-user Industry 2024 & 2032
- Figure 23: North America Plastic Packaging Industry in Australia Revenue (Million), by Country 2024 & 2032
- Figure 24: North America Plastic Packaging Industry in Australia Volume (K Tons), by Country 2024 & 2032
- Figure 25: North America Plastic Packaging Industry in Australia Revenue Share (%), by Country 2024 & 2032
- Figure 26: North America Plastic Packaging Industry in Australia Volume Share (%), by Country 2024 & 2032
- Figure 27: South America Plastic Packaging Industry in Australia Revenue (Million), by Rigid Packaging 2024 & 2032
- Figure 28: South America Plastic Packaging Industry in Australia Volume (K Tons), by Rigid Packaging 2024 & 2032
- Figure 29: South America Plastic Packaging Industry in Australia Revenue Share (%), by Rigid Packaging 2024 & 2032
- Figure 30: South America Plastic Packaging Industry in Australia Volume Share (%), by Rigid Packaging 2024 & 2032
- Figure 31: South America Plastic Packaging Industry in Australia Revenue (Million), by Flexible Packaging 2024 & 2032
- Figure 32: South America Plastic Packaging Industry in Australia Volume (K Tons), by Flexible Packaging 2024 & 2032
- Figure 33: South America Plastic Packaging Industry in Australia Revenue Share (%), by Flexible Packaging 2024 & 2032
- Figure 34: South America Plastic Packaging Industry in Australia Volume Share (%), by Flexible Packaging 2024 & 2032
- Figure 35: South America Plastic Packaging Industry in Australia Revenue (Million), by Industrial Plastic Film Market 2024 & 2032
- Figure 36: South America Plastic Packaging Industry in Australia Volume (K Tons), by Industrial Plastic Film Market 2024 & 2032
- Figure 37: South America Plastic Packaging Industry in Australia Revenue Share (%), by Industrial Plastic Film Market 2024 & 2032
- Figure 38: South America Plastic Packaging Industry in Australia Volume Share (%), by Industrial Plastic Film Market 2024 & 2032
- Figure 39: South America Plastic Packaging Industry in Australia Revenue (Million), by End-user Industry 2024 & 2032
- Figure 40: South America Plastic Packaging Industry in Australia Volume (K Tons), by End-user Industry 2024 & 2032
- Figure 41: South America Plastic Packaging Industry in Australia Revenue Share (%), by End-user Industry 2024 & 2032
- Figure 42: South America Plastic Packaging Industry in Australia Volume Share (%), by End-user Industry 2024 & 2032
- Figure 43: South America Plastic Packaging Industry in Australia Revenue (Million), by Country 2024 & 2032
- Figure 44: South America Plastic Packaging Industry in Australia Volume (K Tons), by Country 2024 & 2032
- Figure 45: South America Plastic Packaging Industry in Australia Revenue Share (%), by Country 2024 & 2032
- Figure 46: South America Plastic Packaging Industry in Australia Volume Share (%), by Country 2024 & 2032
- Figure 47: Europe Plastic Packaging Industry in Australia Revenue (Million), by Rigid Packaging 2024 & 2032
- Figure 48: Europe Plastic Packaging Industry in Australia Volume (K Tons), by Rigid Packaging 2024 & 2032
- Figure 49: Europe Plastic Packaging Industry in Australia Revenue Share (%), by Rigid Packaging 2024 & 2032
- Figure 50: Europe Plastic Packaging Industry in Australia Volume Share (%), by Rigid Packaging 2024 & 2032
- Figure 51: Europe Plastic Packaging Industry in Australia Revenue (Million), by Flexible Packaging 2024 & 2032
- Figure 52: Europe Plastic Packaging Industry in Australia Volume (K Tons), by Flexible Packaging 2024 & 2032
- Figure 53: Europe Plastic Packaging Industry in Australia Revenue Share (%), by Flexible Packaging 2024 & 2032
- Figure 54: Europe Plastic Packaging Industry in Australia Volume Share (%), by Flexible Packaging 2024 & 2032
- Figure 55: Europe Plastic Packaging Industry in Australia Revenue (Million), by Industrial Plastic Film Market 2024 & 2032
- Figure 56: Europe Plastic Packaging Industry in Australia Volume (K Tons), by Industrial Plastic Film Market 2024 & 2032
- Figure 57: Europe Plastic Packaging Industry in Australia Revenue Share (%), by Industrial Plastic Film Market 2024 & 2032
- Figure 58: Europe Plastic Packaging Industry in Australia Volume Share (%), by Industrial Plastic Film Market 2024 & 2032
- Figure 59: Europe Plastic Packaging Industry in Australia Revenue (Million), by End-user Industry 2024 & 2032
- Figure 60: Europe Plastic Packaging Industry in Australia Volume (K Tons), by End-user Industry 2024 & 2032
- Figure 61: Europe Plastic Packaging Industry in Australia Revenue Share (%), by End-user Industry 2024 & 2032
- Figure 62: Europe Plastic Packaging Industry in Australia Volume Share (%), by End-user Industry 2024 & 2032
- Figure 63: Europe Plastic Packaging Industry in Australia Revenue (Million), by Country 2024 & 2032
- Figure 64: Europe Plastic Packaging Industry in Australia Volume (K Tons), by Country 2024 & 2032
- Figure 65: Europe Plastic Packaging Industry in Australia Revenue Share (%), by Country 2024 & 2032
- Figure 66: Europe Plastic Packaging Industry in Australia Volume Share (%), by Country 2024 & 2032
- Figure 67: Middle East & Africa Plastic Packaging Industry in Australia Revenue (Million), by Rigid Packaging 2024 & 2032
- Figure 68: Middle East & Africa Plastic Packaging Industry in Australia Volume (K Tons), by Rigid Packaging 2024 & 2032
- Figure 69: Middle East & Africa Plastic Packaging Industry in Australia Revenue Share (%), by Rigid Packaging 2024 & 2032
- Figure 70: Middle East & Africa Plastic Packaging Industry in Australia Volume Share (%), by Rigid Packaging 2024 & 2032
- Figure 71: Middle East & Africa Plastic Packaging Industry in Australia Revenue (Million), by Flexible Packaging 2024 & 2032
- Figure 72: Middle East & Africa Plastic Packaging Industry in Australia Volume (K Tons), by Flexible Packaging 2024 & 2032
- Figure 73: Middle East & Africa Plastic Packaging Industry in Australia Revenue Share (%), by Flexible Packaging 2024 & 2032
- Figure 74: Middle East & Africa Plastic Packaging Industry in Australia Volume Share (%), by Flexible Packaging 2024 & 2032
- Figure 75: Middle East & Africa Plastic Packaging Industry in Australia Revenue (Million), by Industrial Plastic Film Market 2024 & 2032
- Figure 76: Middle East & Africa Plastic Packaging Industry in Australia Volume (K Tons), by Industrial Plastic Film Market 2024 & 2032
- Figure 77: Middle East & Africa Plastic Packaging Industry in Australia Revenue Share (%), by Industrial Plastic Film Market 2024 & 2032
- Figure 78: Middle East & Africa Plastic Packaging Industry in Australia Volume Share (%), by Industrial Plastic Film Market 2024 & 2032
- Figure 79: Middle East & Africa Plastic Packaging Industry in Australia Revenue (Million), by End-user Industry 2024 & 2032
- Figure 80: Middle East & Africa Plastic Packaging Industry in Australia Volume (K Tons), by End-user Industry 2024 & 2032
- Figure 81: Middle East & Africa Plastic Packaging Industry in Australia Revenue Share (%), by End-user Industry 2024 & 2032
- Figure 82: Middle East & Africa Plastic Packaging Industry in Australia Volume Share (%), by End-user Industry 2024 & 2032
- Figure 83: Middle East & Africa Plastic Packaging Industry in Australia Revenue (Million), by Country 2024 & 2032
- Figure 84: Middle East & Africa Plastic Packaging Industry in Australia Volume (K Tons), by Country 2024 & 2032
- Figure 85: Middle East & Africa Plastic Packaging Industry in Australia Revenue Share (%), by Country 2024 & 2032
- Figure 86: Middle East & Africa Plastic Packaging Industry in Australia Volume Share (%), by Country 2024 & 2032
- Figure 87: Asia Pacific Plastic Packaging Industry in Australia Revenue (Million), by Rigid Packaging 2024 & 2032
- Figure 88: Asia Pacific Plastic Packaging Industry in Australia Volume (K Tons), by Rigid Packaging 2024 & 2032
- Figure 89: Asia Pacific Plastic Packaging Industry in Australia Revenue Share (%), by Rigid Packaging 2024 & 2032
- Figure 90: Asia Pacific Plastic Packaging Industry in Australia Volume Share (%), by Rigid Packaging 2024 & 2032
- Figure 91: Asia Pacific Plastic Packaging Industry in Australia Revenue (Million), by Flexible Packaging 2024 & 2032
- Figure 92: Asia Pacific Plastic Packaging Industry in Australia Volume (K Tons), by Flexible Packaging 2024 & 2032
- Figure 93: Asia Pacific Plastic Packaging Industry in Australia Revenue Share (%), by Flexible Packaging 2024 & 2032
- Figure 94: Asia Pacific Plastic Packaging Industry in Australia Volume Share (%), by Flexible Packaging 2024 & 2032
- Figure 95: Asia Pacific Plastic Packaging Industry in Australia Revenue (Million), by Industrial Plastic Film Market 2024 & 2032
- Figure 96: Asia Pacific Plastic Packaging Industry in Australia Volume (K Tons), by Industrial Plastic Film Market 2024 & 2032
- Figure 97: Asia Pacific Plastic Packaging Industry in Australia Revenue Share (%), by Industrial Plastic Film Market 2024 & 2032
- Figure 98: Asia Pacific Plastic Packaging Industry in Australia Volume Share (%), by Industrial Plastic Film Market 2024 & 2032
- Figure 99: Asia Pacific Plastic Packaging Industry in Australia Revenue (Million), by End-user Industry 2024 & 2032
- Figure 100: Asia Pacific Plastic Packaging Industry in Australia Volume (K Tons), by End-user Industry 2024 & 2032
- Figure 101: Asia Pacific Plastic Packaging Industry in Australia Revenue Share (%), by End-user Industry 2024 & 2032
- Figure 102: Asia Pacific Plastic Packaging Industry in Australia Volume Share (%), by End-user Industry 2024 & 2032
- Figure 103: Asia Pacific Plastic Packaging Industry in Australia Revenue (Million), by Country 2024 & 2032
- Figure 104: Asia Pacific Plastic Packaging Industry in Australia Volume (K Tons), by Country 2024 & 2032
- Figure 105: Asia Pacific Plastic Packaging Industry in Australia Revenue Share (%), by Country 2024 & 2032
- Figure 106: Asia Pacific Plastic Packaging Industry in Australia Volume Share (%), by Country 2024 & 2032
List of Tables
- Table 1: Global Plastic Packaging Industry in Australia Revenue Million Forecast, by Region 2019 & 2032
- Table 2: Global Plastic Packaging Industry in Australia Volume K Tons Forecast, by Region 2019 & 2032
- Table 3: Global Plastic Packaging Industry in Australia Revenue Million Forecast, by Rigid Packaging 2019 & 2032
- Table 4: Global Plastic Packaging Industry in Australia Volume K Tons Forecast, by Rigid Packaging 2019 & 2032
- Table 5: Global Plastic Packaging Industry in Australia Revenue Million Forecast, by Flexible Packaging 2019 & 2032
- Table 6: Global Plastic Packaging Industry in Australia Volume K Tons Forecast, by Flexible Packaging 2019 & 2032
- Table 7: Global Plastic Packaging Industry in Australia Revenue Million Forecast, by Industrial Plastic Film Market 2019 & 2032
- Table 8: Global Plastic Packaging Industry in Australia Volume K Tons Forecast, by Industrial Plastic Film Market 2019 & 2032
- Table 9: Global Plastic Packaging Industry in Australia Revenue Million Forecast, by End-user Industry 2019 & 2032
- Table 10: Global Plastic Packaging Industry in Australia Volume K Tons Forecast, by End-user Industry 2019 & 2032
- Table 11: Global Plastic Packaging Industry in Australia Revenue Million Forecast, by Region 2019 & 2032
- Table 12: Global Plastic Packaging Industry in Australia Volume K Tons Forecast, by Region 2019 & 2032
- Table 13: Global Plastic Packaging Industry in Australia Revenue Million Forecast, by Country 2019 & 2032
- Table 14: Global Plastic Packaging Industry in Australia Volume K Tons Forecast, by Country 2019 & 2032
- Table 15: Global Plastic Packaging Industry in Australia Revenue Million Forecast, by Rigid Packaging 2019 & 2032
- Table 16: Global Plastic Packaging Industry in Australia Volume K Tons Forecast, by Rigid Packaging 2019 & 2032
- Table 17: Global Plastic Packaging Industry in Australia Revenue Million Forecast, by Flexible Packaging 2019 & 2032
- Table 18: Global Plastic Packaging Industry in Australia Volume K Tons Forecast, by Flexible Packaging 2019 & 2032
- Table 19: Global Plastic Packaging Industry in Australia Revenue Million Forecast, by Industrial Plastic Film Market 2019 & 2032
- Table 20: Global Plastic Packaging Industry in Australia Volume K Tons Forecast, by Industrial Plastic Film Market 2019 & 2032
- Table 21: Global Plastic Packaging Industry in Australia Revenue Million Forecast, by End-user Industry 2019 & 2032
- Table 22: Global Plastic Packaging Industry in Australia Volume K Tons Forecast, by End-user Industry 2019 & 2032
- Table 23: Global Plastic Packaging Industry in Australia Revenue Million Forecast, by Country 2019 & 2032
- Table 24: Global Plastic Packaging Industry in Australia Volume K Tons Forecast, by Country 2019 & 2032
- Table 25: United States Plastic Packaging Industry in Australia Revenue (Million) Forecast, by Application 2019 & 2032
- Table 26: United States Plastic Packaging Industry in Australia Volume (K Tons) Forecast, by Application 2019 & 2032
- Table 27: Canada Plastic Packaging Industry in Australia Revenue (Million) Forecast, by Application 2019 & 2032
- Table 28: Canada Plastic Packaging Industry in Australia Volume (K Tons) Forecast, by Application 2019 & 2032
- Table 29: Mexico Plastic Packaging Industry in Australia Revenue (Million) Forecast, by Application 2019 & 2032
- Table 30: Mexico Plastic Packaging Industry in Australia Volume (K Tons) Forecast, by Application 2019 & 2032
- Table 31: Global Plastic Packaging Industry in Australia Revenue Million Forecast, by Rigid Packaging 2019 & 2032
- Table 32: Global Plastic Packaging Industry in Australia Volume K Tons Forecast, by Rigid Packaging 2019 & 2032
- Table 33: Global Plastic Packaging Industry in Australia Revenue Million Forecast, by Flexible Packaging 2019 & 2032
- Table 34: Global Plastic Packaging Industry in Australia Volume K Tons Forecast, by Flexible Packaging 2019 & 2032
- Table 35: Global Plastic Packaging Industry in Australia Revenue Million Forecast, by Industrial Plastic Film Market 2019 & 2032
- Table 36: Global Plastic Packaging Industry in Australia Volume K Tons Forecast, by Industrial Plastic Film Market 2019 & 2032
- Table 37: Global Plastic Packaging Industry in Australia Revenue Million Forecast, by End-user Industry 2019 & 2032
- Table 38: Global Plastic Packaging Industry in Australia Volume K Tons Forecast, by End-user Industry 2019 & 2032
- Table 39: Global Plastic Packaging Industry in Australia Revenue Million Forecast, by Country 2019 & 2032
- Table 40: Global Plastic Packaging Industry in Australia Volume K Tons Forecast, by Country 2019 & 2032
- Table 41: Brazil Plastic Packaging Industry in Australia Revenue (Million) Forecast, by Application 2019 & 2032
- Table 42: Brazil Plastic Packaging Industry in Australia Volume (K Tons) Forecast, by Application 2019 & 2032
- Table 43: Argentina Plastic Packaging Industry in Australia Revenue (Million) Forecast, by Application 2019 & 2032
- Table 44: Argentina Plastic Packaging Industry in Australia Volume (K Tons) Forecast, by Application 2019 & 2032
- Table 45: Rest of South America Plastic Packaging Industry in Australia Revenue (Million) Forecast, by Application 2019 & 2032
- Table 46: Rest of South America Plastic Packaging Industry in Australia Volume (K Tons) Forecast, by Application 2019 & 2032
- Table 47: Global Plastic Packaging Industry in Australia Revenue Million Forecast, by Rigid Packaging 2019 & 2032
- Table 48: Global Plastic Packaging Industry in Australia Volume K Tons Forecast, by Rigid Packaging 2019 & 2032
- Table 49: Global Plastic Packaging Industry in Australia Revenue Million Forecast, by Flexible Packaging 2019 & 2032
- Table 50: Global Plastic Packaging Industry in Australia Volume K Tons Forecast, by Flexible Packaging 2019 & 2032
- Table 51: Global Plastic Packaging Industry in Australia Revenue Million Forecast, by Industrial Plastic Film Market 2019 & 2032
- Table 52: Global Plastic Packaging Industry in Australia Volume K Tons Forecast, by Industrial Plastic Film Market 2019 & 2032
- Table 53: Global Plastic Packaging Industry in Australia Revenue Million Forecast, by End-user Industry 2019 & 2032
- Table 54: Global Plastic Packaging Industry in Australia Volume K Tons Forecast, by End-user Industry 2019 & 2032
- Table 55: Global Plastic Packaging Industry in Australia Revenue Million Forecast, by Country 2019 & 2032
- Table 56: Global Plastic Packaging Industry in Australia Volume K Tons Forecast, by Country 2019 & 2032
- Table 57: United Kingdom Plastic Packaging Industry in Australia Revenue (Million) Forecast, by Application 2019 & 2032
- Table 58: United Kingdom Plastic Packaging Industry in Australia Volume (K Tons) Forecast, by Application 2019 & 2032
- Table 59: Germany Plastic Packaging Industry in Australia Revenue (Million) Forecast, by Application 2019 & 2032
- Table 60: Germany Plastic Packaging Industry in Australia Volume (K Tons) Forecast, by Application 2019 & 2032
- Table 61: France Plastic Packaging Industry in Australia Revenue (Million) Forecast, by Application 2019 & 2032
- Table 62: France Plastic Packaging Industry in Australia Volume (K Tons) Forecast, by Application 2019 & 2032
- Table 63: Italy Plastic Packaging Industry in Australia Revenue (Million) Forecast, by Application 2019 & 2032
- Table 64: Italy Plastic Packaging Industry in Australia Volume (K Tons) Forecast, by Application 2019 & 2032
- Table 65: Spain Plastic Packaging Industry in Australia Revenue (Million) Forecast, by Application 2019 & 2032
- Table 66: Spain Plastic Packaging Industry in Australia Volume (K Tons) Forecast, by Application 2019 & 2032
- Table 67: Russia Plastic Packaging Industry in Australia Revenue (Million) Forecast, by Application 2019 & 2032
- Table 68: Russia Plastic Packaging Industry in Australia Volume (K Tons) Forecast, by Application 2019 & 2032
- Table 69: Benelux Plastic Packaging Industry in Australia Revenue (Million) Forecast, by Application 2019 & 2032
- Table 70: Benelux Plastic Packaging Industry in Australia Volume (K Tons) Forecast, by Application 2019 & 2032
- Table 71: Nordics Plastic Packaging Industry in Australia Revenue (Million) Forecast, by Application 2019 & 2032
- Table 72: Nordics Plastic Packaging Industry in Australia Volume (K Tons) Forecast, by Application 2019 & 2032
- Table 73: Rest of Europe Plastic Packaging Industry in Australia Revenue (Million) Forecast, by Application 2019 & 2032
- Table 74: Rest of Europe Plastic Packaging Industry in Australia Volume (K Tons) Forecast, by Application 2019 & 2032
- Table 75: Global Plastic Packaging Industry in Australia Revenue Million Forecast, by Rigid Packaging 2019 & 2032
- Table 76: Global Plastic Packaging Industry in Australia Volume K Tons Forecast, by Rigid Packaging 2019 & 2032
- Table 77: Global Plastic Packaging Industry in Australia Revenue Million Forecast, by Flexible Packaging 2019 & 2032
- Table 78: Global Plastic Packaging Industry in Australia Volume K Tons Forecast, by Flexible Packaging 2019 & 2032
- Table 79: Global Plastic Packaging Industry in Australia Revenue Million Forecast, by Industrial Plastic Film Market 2019 & 2032
- Table 80: Global Plastic Packaging Industry in Australia Volume K Tons Forecast, by Industrial Plastic Film Market 2019 & 2032
- Table 81: Global Plastic Packaging Industry in Australia Revenue Million Forecast, by End-user Industry 2019 & 2032
- Table 82: Global Plastic Packaging Industry in Australia Volume K Tons Forecast, by End-user Industry 2019 & 2032
- Table 83: Global Plastic Packaging Industry in Australia Revenue Million Forecast, by Country 2019 & 2032
- Table 84: Global Plastic Packaging Industry in Australia Volume K Tons Forecast, by Country 2019 & 2032
- Table 85: Turkey Plastic Packaging Industry in Australia Revenue (Million) Forecast, by Application 2019 & 2032
- Table 86: Turkey Plastic Packaging Industry in Australia Volume (K Tons) Forecast, by Application 2019 & 2032
- Table 87: Israel Plastic Packaging Industry in Australia Revenue (Million) Forecast, by Application 2019 & 2032
- Table 88: Israel Plastic Packaging Industry in Australia Volume (K Tons) Forecast, by Application 2019 & 2032
- Table 89: GCC Plastic Packaging Industry in Australia Revenue (Million) Forecast, by Application 2019 & 2032
- Table 90: GCC Plastic Packaging Industry in Australia Volume (K Tons) Forecast, by Application 2019 & 2032
- Table 91: North Africa Plastic Packaging Industry in Australia Revenue (Million) Forecast, by Application 2019 & 2032
- Table 92: North Africa Plastic Packaging Industry in Australia Volume (K Tons) Forecast, by Application 2019 & 2032
- Table 93: South Africa Plastic Packaging Industry in Australia Revenue (Million) Forecast, by Application 2019 & 2032
- Table 94: South Africa Plastic Packaging Industry in Australia Volume (K Tons) Forecast, by Application 2019 & 2032
- Table 95: Rest of Middle East & Africa Plastic Packaging Industry in Australia Revenue (Million) Forecast, by Application 2019 & 2032
- Table 96: Rest of Middle East & Africa Plastic Packaging Industry in Australia Volume (K Tons) Forecast, by Application 2019 & 2032
- Table 97: Global Plastic Packaging Industry in Australia Revenue Million Forecast, by Rigid Packaging 2019 & 2032
- Table 98: Global Plastic Packaging Industry in Australia Volume K Tons Forecast, by Rigid Packaging 2019 & 2032
- Table 99: Global Plastic Packaging Industry in Australia Revenue Million Forecast, by Flexible Packaging 2019 & 2032
- Table 100: Global Plastic Packaging Industry in Australia Volume K Tons Forecast, by Flexible Packaging 2019 & 2032
- Table 101: Global Plastic Packaging Industry in Australia Revenue Million Forecast, by Industrial Plastic Film Market 2019 & 2032
- Table 102: Global Plastic Packaging Industry in Australia Volume K Tons Forecast, by Industrial Plastic Film Market 2019 & 2032
- Table 103: Global Plastic Packaging Industry in Australia Revenue Million Forecast, by End-user Industry 2019 & 2032
- Table 104: Global Plastic Packaging Industry in Australia Volume K Tons Forecast, by End-user Industry 2019 & 2032
- Table 105: Global Plastic Packaging Industry in Australia Revenue Million Forecast, by Country 2019 & 2032
- Table 106: Global Plastic Packaging Industry in Australia Volume K Tons Forecast, by Country 2019 & 2032
- Table 107: China Plastic Packaging Industry in Australia Revenue (Million) Forecast, by Application 2019 & 2032
- Table 108: China Plastic Packaging Industry in Australia Volume (K Tons) Forecast, by Application 2019 & 2032
- Table 109: India Plastic Packaging Industry in Australia Revenue (Million) Forecast, by Application 2019 & 2032
- Table 110: India Plastic Packaging Industry in Australia Volume (K Tons) Forecast, by Application 2019 & 2032
- Table 111: Japan Plastic Packaging Industry in Australia Revenue (Million) Forecast, by Application 2019 & 2032
- Table 112: Japan Plastic Packaging Industry in Australia Volume (K Tons) Forecast, by Application 2019 & 2032
- Table 113: South Korea Plastic Packaging Industry in Australia Revenue (Million) Forecast, by Application 2019 & 2032
- Table 114: South Korea Plastic Packaging Industry in Australia Volume (K Tons) Forecast, by Application 2019 & 2032
- Table 115: ASEAN Plastic Packaging Industry in Australia Revenue (Million) Forecast, by Application 2019 & 2032
- Table 116: ASEAN Plastic Packaging Industry in Australia Volume (K Tons) Forecast, by Application 2019 & 2032
- Table 117: Oceania Plastic Packaging Industry in Australia Revenue (Million) Forecast, by Application 2019 & 2032
- Table 118: Oceania Plastic Packaging Industry in Australia Volume (K Tons) Forecast, by Application 2019 & 2032
- Table 119: Rest of Asia Pacific Plastic Packaging Industry in Australia Revenue (Million) Forecast, by Application 2019 & 2032
- Table 120: Rest of Asia Pacific Plastic Packaging Industry in Australia Volume (K Tons) Forecast, by Application 2019 & 2032
Frequently Asked Questions
1. What is the projected Compound Annual Growth Rate (CAGR) of the Plastic Packaging Industry in Australia?
The projected CAGR is approximately 2.14%.
2. Which companies are prominent players in the Plastic Packaging Industry in Australia?
Key companies in the market include Visy Industries Australia Pty Ltd, Gravure Packaging Ltd, Cospak Pty Ltd, Plasmo Pty Ltd*List Not Exhaustive, Flexible Packaging Solutions Pty Ltd, Orora Packaging Australia Pty Ltd, A&M Packaging Pty Ltd, Pact Group Holdings Australia Pty Ltd, Caspak Products Pty Ltd, Synergy Packaging (RPC Group), Pro-Pac Packaging Pty Ltd, Filton Packaging Pty Ltd, Econopak Flexible Packaging, Vacupack Pty Ltd.
3. What are the main segments of the Plastic Packaging Industry in Australia?
The market segments include Rigid Packaging, Flexible Packaging, Industrial Plastic Film Market, End-user Industry.
4. Can you provide details about the market size?
The market size is estimated to be USD 2.79 Million as of 2022.
5. What are some drivers contributing to market growth?
Increasing Demand from the Food Industry; Increased Eco-friendly Packaging and Recycled Plastics.
6. What are the notable trends driving market growth?
Increasing Demand from the Food Industry.
7. Are there any restraints impacting market growth?
4.; Fluctuating Cost of Raw Materials.
8. Can you provide examples of recent developments in the market?
October 2022 - To meet its goals for 2025, Mondelez Australia promotes recycled soft plastic packaging. To meet the country's 2025 targets, according to Mondelez Australia, more work needs to be done to increase the recyclability of soft plastic packaging rather than viewing it as the enemy.
9. What pricing options are available for accessing the report?
Pricing options include single-user, multi-user, and enterprise licenses priced at USD 3800, USD 4500, and USD 5800 respectively.
10. Is the market size provided in terms of value or volume?
The market size is provided in terms of value, measured in Million and volume, measured in K Tons.
11. Are there any specific market keywords associated with the report?
Yes, the market keyword associated with the report is "Plastic Packaging Industry in Australia," which aids in identifying and referencing the specific market segment covered.
12. How do I determine which pricing option suits my needs best?
The pricing options vary based on user requirements and access needs. Individual users may opt for single-user licenses, while businesses requiring broader access may choose multi-user or enterprise licenses for cost-effective access to the report.
13. Are there any additional resources or data provided in the Plastic Packaging Industry in Australia report?
While the report offers comprehensive insights, it's advisable to review the specific contents or supplementary materials provided to ascertain if additional resources or data are available.
14. How can I stay updated on further developments or reports in the Plastic Packaging Industry in Australia?
To stay informed about further developments, trends, and reports in the Plastic Packaging Industry in Australia, consider subscribing to industry newsletters, following relevant companies and organizations, or regularly checking reputable industry news sources and publications.
Methodology
Step 1 - Identification of Relevant Samples Size from Population Database


Step 2 - Approaches for Defining Global Market Size (Value, Volume* & Price*)

Note*: In applicable scenarios
Step 3 - Data Sources
Primary Research
- Web Analytics
- Survey Reports
- Research Institute
- Latest Research Reports
- Opinion Leaders
Secondary Research
- Annual Reports
- White Paper
- Latest Press Release
- Industry Association
- Paid Database
- Investor Presentations

Step 4 - Data Triangulation
Involves using different sources of information in order to increase the validity of a study
These sources are likely to be stakeholders in a program - participants, other researchers, program staff, other community members, and so on.
Then we put all data in single framework & apply various statistical tools to find out the dynamic on the market.
During the analysis stage, feedback from the stakeholder groups would be compared to determine areas of agreement as well as areas of divergence


