Exploring Growth Patterns in Plant Growth Chamber Market Market

Plant Growth Chamber Market by Production Analysis, by Consumption Analysis, by Import Market Analysis (Value & Volume), by Export Market Analysis (Value & Volume), by Price Trend Analysis, by North America (United States, Canada, Mexico), by South America (Brazil, Argentina, Rest of South America), by Europe (United Kingdom, Germany, France, Italy, Spain, Russia, Benelux, Nordics, Rest of Europe), by Middle East & Africa (Turkey, Israel, GCC, North Africa, South Africa, Rest of Middle East & Africa), by Asia Pacific (China, India, Japan, South Korea, ASEAN, Oceania, Rest of Asia Pacific) Forecast 2025-2033

Jun 27 2025
Base Year: 2024

150 Pages
Main Logo

Exploring Growth Patterns in Plant Growth Chamber Market Market


Home
Industries
Agriculture
sponsor image

Tailored for you

  • In-depth Analysis Tailored to Specified Regions or Segments
  • Company Profiles Customized to User Preferences
  • Comprehensive Insights Focused on Specific Segments or Regions
  • Customized Evaluation of Competitive Landscape to Meet Your Needs
  • Tailored Customization to Address Other Specific Requirements
Ask for customization


Key Insights

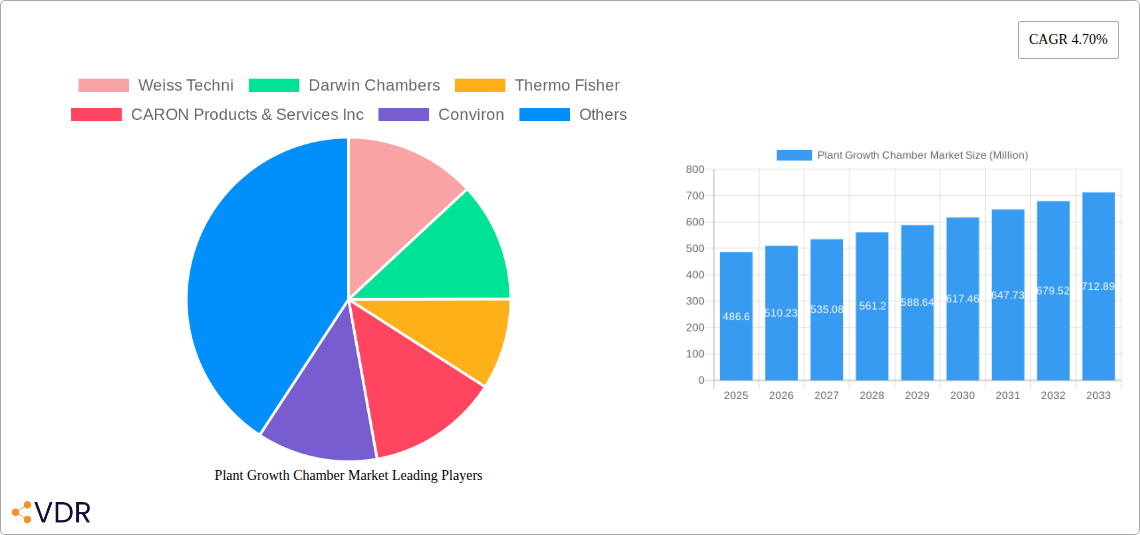
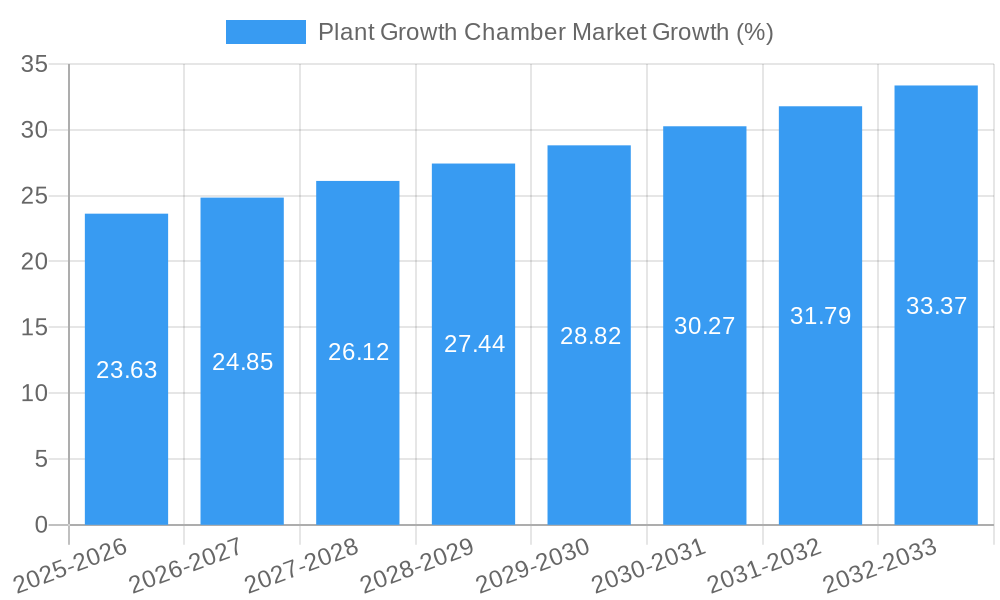
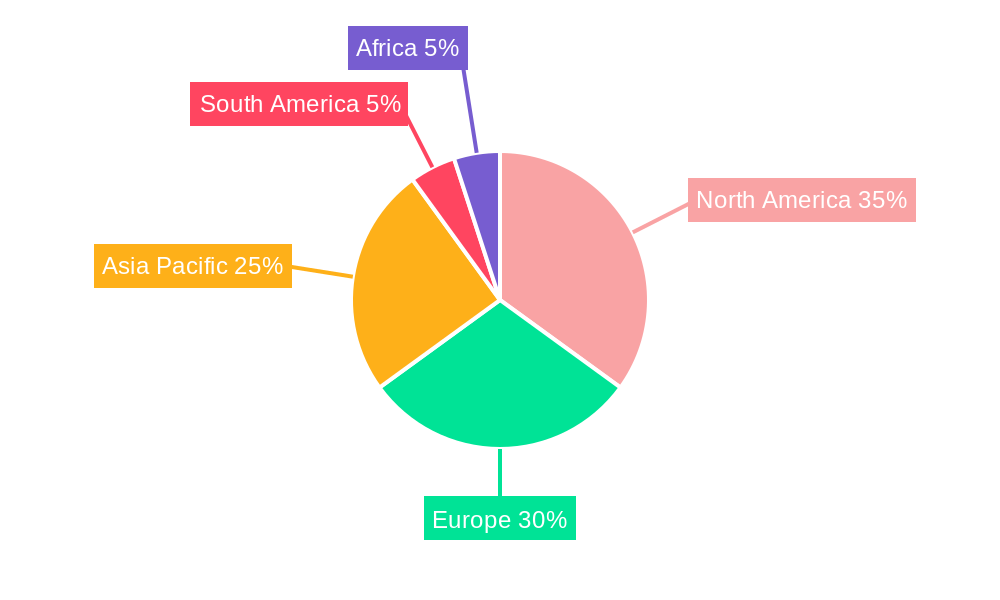
The global plant growth chamber market, valued at $486.60 million in 2025, is projected to experience robust growth, driven by escalating demand for controlled environment agriculture (CEA) and advancements in plant research. The market's Compound Annual Growth Rate (CAGR) of 4.70% from 2025 to 2033 indicates a steady expansion, fueled by several key factors. Increased investments in agricultural technology, particularly in vertical farming and precision agriculture, are significantly boosting market adoption. The rising need for year-round crop production, regardless of climatic conditions, is a major driver, especially in regions with limited arable land. Furthermore, the growing focus on plant-based foods and the increasing adoption of tissue culture techniques for plant propagation are contributing to market expansion. The segment comprising walk-in chambers is expected to witness higher growth compared to reach-in chambers due to their larger capacity and suitability for various research and commercial applications. Within applications, plant growth and seed germination are significant drivers, while environment optimization and tissue culture segments are expected to show faster growth due to advanced research and development in these areas. Competition among established players like Weiss Technik, Darwin Chambers, and Thermo Fisher, alongside emerging companies, fosters innovation and price competitiveness. Geographically, North America and Europe are currently major markets, but the Asia-Pacific region, particularly China and India, is poised for rapid expansion, driven by increasing agricultural investments and technological advancements.

The restraints on market growth include the high initial investment cost of plant growth chambers, which can be a barrier for smaller businesses and research institutions. However, this is being mitigated by the availability of financing options and leasing agreements. Moreover, the need for specialized maintenance and technical expertise can pose a challenge, though the emergence of user-friendly systems and robust service networks is addressing this issue. Regulatory compliance and standardization requirements in different regions may also impact market dynamics. Nevertheless, the overall market outlook remains positive, with continued technological advancements and growing demand expected to propel market growth throughout the forecast period. The increasing focus on sustainable agriculture and food security will further contribute to the market's expansion in the coming years.

Plant Growth Chamber Market Research Report - Market Size, Growth & Forecast

Plant Growth Chamber Market: A Comprehensive Market Report (2019-2033)

This comprehensive report provides an in-depth analysis of the Plant Growth Chamber market, encompassing market dynamics, growth trends, regional analysis, product landscape, key players, and future outlook. The report covers the parent market of Environmental Simulation Equipment and the child market of Plant Growth Chambers, offering a granular view of this vital sector within the life sciences industry. The study period spans from 2019 to 2033, with 2025 serving as the base and estimated year. The market size is valued in million units.

Plant Growth Chamber Market Dynamics & Structure

The Plant Growth Chamber market exhibits a moderately concentrated landscape, with key players vying for market share through product innovation and strategic acquisitions. Technological advancements, particularly in environmental control and automation, are driving market growth. Stringent regulatory frameworks regarding environmental impact and safety standards influence market operations. Competitive substitutes include simpler, less sophisticated growth systems, however, the increasing need for precise environmental control favors plant growth chambers. End-user demographics encompass research institutions, agricultural universities, pharmaceutical companies, and commercial growers. The market has witnessed significant M&A activity, indicative of consolidation and expansion strategies.

  • Market Concentration: Moderately Concentrated (xx%)
  • Technological Innovation Drivers: Automation, Precision Environmental Control, IoT Integration
  • Regulatory Frameworks: Stringent safety and environmental standards impacting design and manufacturing.
  • Competitive Product Substitutes: Simpler growth systems (e.g., greenhouses).
  • End-User Demographics: Research institutions (xx%), Agricultural Universities (xx%), Pharmaceutical Companies (xx%), Commercial Growers (xx%)
  • M&A Trends: Significant consolidation, with xx major deals in the past 5 years.

Plant Growth Chamber Market Growth Trends & Insights

The Plant Growth Chamber market has witnessed consistent growth over the historical period (2019-2024), driven by increasing research activities, rising demand for high-quality produce, and the growing adoption of controlled-environment agriculture (CEA). The market size is projected to reach xx Million units by 2025 and experience a CAGR of xx% during the forecast period (2025-2033). Technological disruptions, such as the integration of AI and machine learning for optimized environmental control and improved data analysis, are accelerating market expansion. Consumer behavior shifts toward sustainably produced food and a growing preference for high-quality, consistent plant products are key growth catalysts.

Plant Growth Chamber Market Growth

Dominant Regions, Countries, or Segments in Plant Growth Chamber Market

North America currently holds the largest market share in the Plant Growth Chamber market, followed by Europe and Asia-Pacific. Within equipment types, the reach-in segment dominates due to its cost-effectiveness and suitability for smaller research settings. The application segment for short plants holds significant market share, driven by high demand in the pharmaceutical and research industries. However, the tall plants segment exhibits considerable growth potential, fueled by large-scale agricultural applications. Plant growth and seed germination functions are the primary drivers, reflecting the core application areas. Tissue culture also shows high growth potential.

  • Leading Region: North America (xx% market share)
  • Key Drivers (North America): Strong research infrastructure, advanced agricultural practices, high disposable income
  • Leading Equipment Type: Reach-in (xx% market share)
  • Leading Application: Short Plants (xx% market share)
  • Dominant Function: Plant Growth (xx% market share)

Plant Growth Chamber Market Product Landscape

Plant growth chambers now offer advanced features such as precise temperature and humidity control, customizable lighting systems (including LED options), and sophisticated CO2 management. Innovative designs focus on energy efficiency and user-friendly interfaces. Products are differentiated based on capacity, features, and price points, catering to diverse user needs. Key selling propositions emphasize precision, reliability, and data-driven insights.

Key Drivers, Barriers & Challenges in Plant Growth Chamber Market

Key Drivers:

  • Increasing investment in agricultural research & development.
  • Growing adoption of controlled-environment agriculture (CEA).
  • Technological advancements improving efficiency and precision.

Key Challenges:

  • High initial investment costs.
  • Complex maintenance requirements.
  • Competition from alternative growth systems.
  • Supply chain disruptions impacting component availability (xx% impact on production in 2022).

Emerging Opportunities in Plant Growth Chamber Market

  • Expanding applications in vertical farming and urban agriculture.
  • Integration of IoT and AI for data-driven decision making.
  • Development of energy-efficient and sustainable designs.
  • Penetration into developing economies with growing agricultural sectors.

Growth Accelerators in the Plant Growth Chamber Market Industry

Strategic partnerships between equipment manufacturers and agricultural technology companies are driving innovation and market expansion. Government initiatives supporting research and development in agriculture are further stimulating growth. The development of customized plant growth chambers for specific plant species and research needs presents significant opportunities.

Key Players Shaping the Plant Growth Chamber Market Market

  • Weiss Techni
  • Darwin Chambers
  • Thermo Fisher
  • CARON Products & Services Inc
  • Conviron
  • Aralab
  • Percival Scientific Inc
  • Brs Bvba
  • BINDER GmbH
  • Hettich Benelux BV
  • Saveer Biotech Limited
  • Freezers India

Notable Milestones in Plant Growth Chamber Market Sector

  • January 2022: Conviron launched its new EVO series of plant growth chambers, enhancing spatial uniformity and suitability for various plant heights.
  • August 2021: Caron acquired Bigneat, expanding its product portfolio in the life sciences sector.
  • May 2021: Weiss Umwelttechnik GmbH merged with Vötsch Industrietechnik GmbH, strengthening its position in environmental simulation.

In-Depth Plant Growth Chamber Market Market Outlook

The Plant Growth Chamber market is poised for sustained growth driven by technological advancements, increasing demand from various sectors, and supportive government policies. Strategic collaborations and expansion into new applications, such as vertical farming and personalized agriculture, are expected to unlock further market potential. The market’s future looks promising, with continued innovation and expansion across diverse geographical regions.

Plant Growth Chamber Market Segmentation

  • 1. Production Analysis
  • 2. Consumption Analysis
  • 3. Import Market Analysis (Value & Volume)
  • 4. Export Market Analysis (Value & Volume)
  • 5. Price Trend Analysis

Plant Growth Chamber Market Segmentation By Geography

  • 1. North America
    • 1.1. United States
    • 1.2. Canada
    • 1.3. Mexico
  • 2. South America
    • 2.1. Brazil
    • 2.2. Argentina
    • 2.3. Rest of South America
  • 3. Europe
    • 3.1. United Kingdom
    • 3.2. Germany
    • 3.3. France
    • 3.4. Italy
    • 3.5. Spain
    • 3.6. Russia
    • 3.7. Benelux
    • 3.8. Nordics
    • 3.9. Rest of Europe
  • 4. Middle East & Africa
    • 4.1. Turkey
    • 4.2. Israel
    • 4.3. GCC
    • 4.4. North Africa
    • 4.5. South Africa
    • 4.6. Rest of Middle East & Africa
  • 5. Asia Pacific
    • 5.1. China
    • 5.2. India
    • 5.3. Japan
    • 5.4. South Korea
    • 5.5. ASEAN
    • 5.6. Oceania
    • 5.7. Rest of Asia Pacific
Plant Growth Chamber Market Regional Share


Plant Growth Chamber Market REPORT HIGHLIGHTS

AspectsDetails
Study Period 2019-2033
Base Year 2024
Estimated Year 2025
Forecast Period2025-2033
Historical Period2019-2024
Growth RateCAGR of 4.70% from 2019-2033
Segmentation
    • By Production Analysis
    • By Consumption Analysis
    • By Import Market Analysis (Value & Volume)
    • By Export Market Analysis (Value & Volume)
    • By Price Trend Analysis
  • By Geography
    • North America
      • United States
      • Canada
      • Mexico
    • South America
      • Brazil
      • Argentina
      • Rest of South America
    • Europe
      • United Kingdom
      • Germany
      • France
      • Italy
      • Spain
      • Russia
      • Benelux
      • Nordics
      • Rest of Europe
    • Middle East & Africa
      • Turkey
      • Israel
      • GCC
      • North Africa
      • South Africa
      • Rest of Middle East & Africa
    • Asia Pacific
      • China
      • India
      • Japan
      • South Korea
      • ASEAN
      • Oceania
      • Rest of Asia Pacific


Table of Contents

  1. 1. Introduction
    • 1.1. Research Scope
    • 1.2. Market Segmentation
    • 1.3. Research Methodology
    • 1.4. Definitions and Assumptions
  2. 2. Executive Summary
    • 2.1. Introduction
  3. 3. Market Dynamics
    • 3.1. Introduction
      • 3.2. Market Drivers
        • 3.2.1. Seed Treatment As A Solution To Enhance Yield; Growing Awareness For Seed Treatment Among The Farmers; Rising Trend Of Organic Farming
      • 3.3. Market Restrains
        • 3.3.1. Limitations Across Farm-Level Seed Treatment; Rising Environmental Concerns
      • 3.4. Market Trends
        • 3.4.1. Increasing Demand for Food and Decreasing Arable Land
  4. 4. Market Factor Analysis
    • 4.1. Porters Five Forces
    • 4.2. Supply/Value Chain
    • 4.3. PESTEL analysis
    • 4.4. Market Entropy
    • 4.5. Patent/Trademark Analysis
  5. 5. Global Plant Growth Chamber Market Analysis, Insights and Forecast, 2019-2031
    • 5.1. Market Analysis, Insights and Forecast - by Production Analysis
      • 5.2. Market Analysis, Insights and Forecast - by Consumption Analysis
        • 5.3. Market Analysis, Insights and Forecast - by Import Market Analysis (Value & Volume)
          • 5.4. Market Analysis, Insights and Forecast - by Export Market Analysis (Value & Volume)
            • 5.5. Market Analysis, Insights and Forecast - by Price Trend Analysis
              • 5.6. Market Analysis, Insights and Forecast - by Region
                • 5.6.1. North America
                • 5.6.2. South America
                • 5.6.3. Europe
                • 5.6.4. Middle East & Africa
                • 5.6.5. Asia Pacific
            • 6. North America Plant Growth Chamber Market Analysis, Insights and Forecast, 2019-2031
              • 6.1. Market Analysis, Insights and Forecast - by Production Analysis
                • 6.2. Market Analysis, Insights and Forecast - by Consumption Analysis
                  • 6.3. Market Analysis, Insights and Forecast - by Import Market Analysis (Value & Volume)
                    • 6.4. Market Analysis, Insights and Forecast - by Export Market Analysis (Value & Volume)
                      • 6.5. Market Analysis, Insights and Forecast - by Price Trend Analysis
                      • 7. South America Plant Growth Chamber Market Analysis, Insights and Forecast, 2019-2031
                        • 7.1. Market Analysis, Insights and Forecast - by Production Analysis
                          • 7.2. Market Analysis, Insights and Forecast - by Consumption Analysis
                            • 7.3. Market Analysis, Insights and Forecast - by Import Market Analysis (Value & Volume)
                              • 7.4. Market Analysis, Insights and Forecast - by Export Market Analysis (Value & Volume)
                                • 7.5. Market Analysis, Insights and Forecast - by Price Trend Analysis
                                • 8. Europe Plant Growth Chamber Market Analysis, Insights and Forecast, 2019-2031
                                  • 8.1. Market Analysis, Insights and Forecast - by Production Analysis
                                    • 8.2. Market Analysis, Insights and Forecast - by Consumption Analysis
                                      • 8.3. Market Analysis, Insights and Forecast - by Import Market Analysis (Value & Volume)
                                        • 8.4. Market Analysis, Insights and Forecast - by Export Market Analysis (Value & Volume)
                                          • 8.5. Market Analysis, Insights and Forecast - by Price Trend Analysis
                                          • 9. Middle East & Africa Plant Growth Chamber Market Analysis, Insights and Forecast, 2019-2031
                                            • 9.1. Market Analysis, Insights and Forecast - by Production Analysis
                                              • 9.2. Market Analysis, Insights and Forecast - by Consumption Analysis
                                                • 9.3. Market Analysis, Insights and Forecast - by Import Market Analysis (Value & Volume)
                                                  • 9.4. Market Analysis, Insights and Forecast - by Export Market Analysis (Value & Volume)
                                                    • 9.5. Market Analysis, Insights and Forecast - by Price Trend Analysis
                                                    • 10. Asia Pacific Plant Growth Chamber Market Analysis, Insights and Forecast, 2019-2031
                                                      • 10.1. Market Analysis, Insights and Forecast - by Production Analysis
                                                        • 10.2. Market Analysis, Insights and Forecast - by Consumption Analysis
                                                          • 10.3. Market Analysis, Insights and Forecast - by Import Market Analysis (Value & Volume)
                                                            • 10.4. Market Analysis, Insights and Forecast - by Export Market Analysis (Value & Volume)
                                                              • 10.5. Market Analysis, Insights and Forecast - by Price Trend Analysis
                                                              • 11. North America Plant Growth Chamber Market Analysis, Insights and Forecast, 2019-2031
                                                                  • 11.1. Market Analysis, Insights and Forecast - By Country/Sub-region
                                                                    • 11.1.1 United States
                                                                    • 11.1.2 Canada
                                                                    • 11.1.3 Mexico
                                                                    • 11.1.4 Rest of North America
                                                              • 12. Europe Plant Growth Chamber Market Analysis, Insights and Forecast, 2019-2031
                                                                  • 12.1. Market Analysis, Insights and Forecast - By Country/Sub-region
                                                                    • 12.1.1 Germany
                                                                    • 12.1.2 United Kingdom
                                                                    • 12.1.3 France
                                                                    • 12.1.4 Italy
                                                                    • 12.1.5 Russia
                                                                    • 12.1.6 Spain
                                                                    • 12.1.7 Rest of Europe
                                                              • 13. Asia Pacific Plant Growth Chamber Market Analysis, Insights and Forecast, 2019-2031
                                                                  • 13.1. Market Analysis, Insights and Forecast - By Country/Sub-region
                                                                    • 13.1.1 China
                                                                    • 13.1.2 Japan
                                                                    • 13.1.3 India
                                                                    • 13.1.4 Australia
                                                                    • 13.1.5 Rest of Asia Pacific
                                                              • 14. South America Plant Growth Chamber Market Analysis, Insights and Forecast, 2019-2031
                                                                  • 14.1. Market Analysis, Insights and Forecast - By Country/Sub-region
                                                                    • 14.1.1 Brazil
                                                                    • 14.1.2 Argentina
                                                                    • 14.1.3 Rest of South America
                                                              • 15. Africa Plant Growth Chamber Market Analysis, Insights and Forecast, 2019-2031
                                                                  • 15.1. Market Analysis, Insights and Forecast - By Country/Sub-region
                                                                    • 15.1.1 South Africa
                                                                    • 15.1.2 Rest of Africa
                                                              • 16. Competitive Analysis
                                                                • 16.1. Global Market Share Analysis 2024
                                                                  • 16.2. Company Profiles
                                                                    • 16.2.1 Weiss Techni
                                                                      • 16.2.1.1. Overview
                                                                      • 16.2.1.2. Products
                                                                      • 16.2.1.3. SWOT Analysis
                                                                      • 16.2.1.4. Recent Developments
                                                                      • 16.2.1.5. Financials (Based on Availability)
                                                                    • 16.2.2 Darwin Chambers
                                                                      • 16.2.2.1. Overview
                                                                      • 16.2.2.2. Products
                                                                      • 16.2.2.3. SWOT Analysis
                                                                      • 16.2.2.4. Recent Developments
                                                                      • 16.2.2.5. Financials (Based on Availability)
                                                                    • 16.2.3 Thermo Fisher
                                                                      • 16.2.3.1. Overview
                                                                      • 16.2.3.2. Products
                                                                      • 16.2.3.3. SWOT Analysis
                                                                      • 16.2.3.4. Recent Developments
                                                                      • 16.2.3.5. Financials (Based on Availability)
                                                                    • 16.2.4 CARON Products & Services Inc
                                                                      • 16.2.4.1. Overview
                                                                      • 16.2.4.2. Products
                                                                      • 16.2.4.3. SWOT Analysis
                                                                      • 16.2.4.4. Recent Developments
                                                                      • 16.2.4.5. Financials (Based on Availability)
                                                                    • 16.2.5 Conviron
                                                                      • 16.2.5.1. Overview
                                                                      • 16.2.5.2. Products
                                                                      • 16.2.5.3. SWOT Analysis
                                                                      • 16.2.5.4. Recent Developments
                                                                      • 16.2.5.5. Financials (Based on Availability)
                                                                    • 16.2.6 Aralab
                                                                      • 16.2.6.1. Overview
                                                                      • 16.2.6.2. Products
                                                                      • 16.2.6.3. SWOT Analysis
                                                                      • 16.2.6.4. Recent Developments
                                                                      • 16.2.6.5. Financials (Based on Availability)
                                                                    • 16.2.7 Percival Scientific Inc
                                                                      • 16.2.7.1. Overview
                                                                      • 16.2.7.2. Products
                                                                      • 16.2.7.3. SWOT Analysis
                                                                      • 16.2.7.4. Recent Developments
                                                                      • 16.2.7.5. Financials (Based on Availability)
                                                                    • 16.2.8 Brs Bvba
                                                                      • 16.2.8.1. Overview
                                                                      • 16.2.8.2. Products
                                                                      • 16.2.8.3. SWOT Analysis
                                                                      • 16.2.8.4. Recent Developments
                                                                      • 16.2.8.5. Financials (Based on Availability)
                                                                    • 16.2.9 BINDER GmbH
                                                                      • 16.2.9.1. Overview
                                                                      • 16.2.9.2. Products
                                                                      • 16.2.9.3. SWOT Analysis
                                                                      • 16.2.9.4. Recent Developments
                                                                      • 16.2.9.5. Financials (Based on Availability)
                                                                    • 16.2.10 Hettich Benelux BV
                                                                      • 16.2.10.1. Overview
                                                                      • 16.2.10.2. Products
                                                                      • 16.2.10.3. SWOT Analysis
                                                                      • 16.2.10.4. Recent Developments
                                                                      • 16.2.10.5. Financials (Based on Availability)
                                                                    • 16.2.11 Saveer Biotech Limited
                                                                      • 16.2.11.1. Overview
                                                                      • 16.2.11.2. Products
                                                                      • 16.2.11.3. SWOT Analysis
                                                                      • 16.2.11.4. Recent Developments
                                                                      • 16.2.11.5. Financials (Based on Availability)
                                                                    • 16.2.12 Freezers India
                                                                      • 16.2.12.1. Overview
                                                                      • 16.2.12.2. Products
                                                                      • 16.2.12.3. SWOT Analysis
                                                                      • 16.2.12.4. Recent Developments
                                                                      • 16.2.12.5. Financials (Based on Availability)

                                                              List of Figures

                                                              1. Figure 1: Global Plant Growth Chamber Market Revenue Breakdown (Million, %) by Region 2024 & 2032
                                                              2. Figure 2: North America Plant Growth Chamber Market Revenue (Million), by Country 2024 & 2032
                                                              3. Figure 3: North America Plant Growth Chamber Market Revenue Share (%), by Country 2024 & 2032
                                                              4. Figure 4: Europe Plant Growth Chamber Market Revenue (Million), by Country 2024 & 2032
                                                              5. Figure 5: Europe Plant Growth Chamber Market Revenue Share (%), by Country 2024 & 2032
                                                              6. Figure 6: Asia Pacific Plant Growth Chamber Market Revenue (Million), by Country 2024 & 2032
                                                              7. Figure 7: Asia Pacific Plant Growth Chamber Market Revenue Share (%), by Country 2024 & 2032
                                                              8. Figure 8: South America Plant Growth Chamber Market Revenue (Million), by Country 2024 & 2032
                                                              9. Figure 9: South America Plant Growth Chamber Market Revenue Share (%), by Country 2024 & 2032
                                                              10. Figure 10: Africa Plant Growth Chamber Market Revenue (Million), by Country 2024 & 2032
                                                              11. Figure 11: Africa Plant Growth Chamber Market Revenue Share (%), by Country 2024 & 2032
                                                              12. Figure 12: North America Plant Growth Chamber Market Revenue (Million), by Production Analysis 2024 & 2032
                                                              13. Figure 13: North America Plant Growth Chamber Market Revenue Share (%), by Production Analysis 2024 & 2032
                                                              14. Figure 14: North America Plant Growth Chamber Market Revenue (Million), by Consumption Analysis 2024 & 2032
                                                              15. Figure 15: North America Plant Growth Chamber Market Revenue Share (%), by Consumption Analysis 2024 & 2032
                                                              16. Figure 16: North America Plant Growth Chamber Market Revenue (Million), by Import Market Analysis (Value & Volume) 2024 & 2032
                                                              17. Figure 17: North America Plant Growth Chamber Market Revenue Share (%), by Import Market Analysis (Value & Volume) 2024 & 2032
                                                              18. Figure 18: North America Plant Growth Chamber Market Revenue (Million), by Export Market Analysis (Value & Volume) 2024 & 2032
                                                              19. Figure 19: North America Plant Growth Chamber Market Revenue Share (%), by Export Market Analysis (Value & Volume) 2024 & 2032
                                                              20. Figure 20: North America Plant Growth Chamber Market Revenue (Million), by Price Trend Analysis 2024 & 2032
                                                              21. Figure 21: North America Plant Growth Chamber Market Revenue Share (%), by Price Trend Analysis 2024 & 2032
                                                              22. Figure 22: North America Plant Growth Chamber Market Revenue (Million), by Country 2024 & 2032
                                                              23. Figure 23: North America Plant Growth Chamber Market Revenue Share (%), by Country 2024 & 2032
                                                              24. Figure 24: South America Plant Growth Chamber Market Revenue (Million), by Production Analysis 2024 & 2032
                                                              25. Figure 25: South America Plant Growth Chamber Market Revenue Share (%), by Production Analysis 2024 & 2032
                                                              26. Figure 26: South America Plant Growth Chamber Market Revenue (Million), by Consumption Analysis 2024 & 2032
                                                              27. Figure 27: South America Plant Growth Chamber Market Revenue Share (%), by Consumption Analysis 2024 & 2032
                                                              28. Figure 28: South America Plant Growth Chamber Market Revenue (Million), by Import Market Analysis (Value & Volume) 2024 & 2032
                                                              29. Figure 29: South America Plant Growth Chamber Market Revenue Share (%), by Import Market Analysis (Value & Volume) 2024 & 2032
                                                              30. Figure 30: South America Plant Growth Chamber Market Revenue (Million), by Export Market Analysis (Value & Volume) 2024 & 2032
                                                              31. Figure 31: South America Plant Growth Chamber Market Revenue Share (%), by Export Market Analysis (Value & Volume) 2024 & 2032
                                                              32. Figure 32: South America Plant Growth Chamber Market Revenue (Million), by Price Trend Analysis 2024 & 2032
                                                              33. Figure 33: South America Plant Growth Chamber Market Revenue Share (%), by Price Trend Analysis 2024 & 2032
                                                              34. Figure 34: South America Plant Growth Chamber Market Revenue (Million), by Country 2024 & 2032
                                                              35. Figure 35: South America Plant Growth Chamber Market Revenue Share (%), by Country 2024 & 2032
                                                              36. Figure 36: Europe Plant Growth Chamber Market Revenue (Million), by Production Analysis 2024 & 2032
                                                              37. Figure 37: Europe Plant Growth Chamber Market Revenue Share (%), by Production Analysis 2024 & 2032
                                                              38. Figure 38: Europe Plant Growth Chamber Market Revenue (Million), by Consumption Analysis 2024 & 2032
                                                              39. Figure 39: Europe Plant Growth Chamber Market Revenue Share (%), by Consumption Analysis 2024 & 2032
                                                              40. Figure 40: Europe Plant Growth Chamber Market Revenue (Million), by Import Market Analysis (Value & Volume) 2024 & 2032
                                                              41. Figure 41: Europe Plant Growth Chamber Market Revenue Share (%), by Import Market Analysis (Value & Volume) 2024 & 2032
                                                              42. Figure 42: Europe Plant Growth Chamber Market Revenue (Million), by Export Market Analysis (Value & Volume) 2024 & 2032
                                                              43. Figure 43: Europe Plant Growth Chamber Market Revenue Share (%), by Export Market Analysis (Value & Volume) 2024 & 2032
                                                              44. Figure 44: Europe Plant Growth Chamber Market Revenue (Million), by Price Trend Analysis 2024 & 2032
                                                              45. Figure 45: Europe Plant Growth Chamber Market Revenue Share (%), by Price Trend Analysis 2024 & 2032
                                                              46. Figure 46: Europe Plant Growth Chamber Market Revenue (Million), by Country 2024 & 2032
                                                              47. Figure 47: Europe Plant Growth Chamber Market Revenue Share (%), by Country 2024 & 2032
                                                              48. Figure 48: Middle East & Africa Plant Growth Chamber Market Revenue (Million), by Production Analysis 2024 & 2032
                                                              49. Figure 49: Middle East & Africa Plant Growth Chamber Market Revenue Share (%), by Production Analysis 2024 & 2032
                                                              50. Figure 50: Middle East & Africa Plant Growth Chamber Market Revenue (Million), by Consumption Analysis 2024 & 2032
                                                              51. Figure 51: Middle East & Africa Plant Growth Chamber Market Revenue Share (%), by Consumption Analysis 2024 & 2032
                                                              52. Figure 52: Middle East & Africa Plant Growth Chamber Market Revenue (Million), by Import Market Analysis (Value & Volume) 2024 & 2032
                                                              53. Figure 53: Middle East & Africa Plant Growth Chamber Market Revenue Share (%), by Import Market Analysis (Value & Volume) 2024 & 2032
                                                              54. Figure 54: Middle East & Africa Plant Growth Chamber Market Revenue (Million), by Export Market Analysis (Value & Volume) 2024 & 2032
                                                              55. Figure 55: Middle East & Africa Plant Growth Chamber Market Revenue Share (%), by Export Market Analysis (Value & Volume) 2024 & 2032
                                                              56. Figure 56: Middle East & Africa Plant Growth Chamber Market Revenue (Million), by Price Trend Analysis 2024 & 2032
                                                              57. Figure 57: Middle East & Africa Plant Growth Chamber Market Revenue Share (%), by Price Trend Analysis 2024 & 2032
                                                              58. Figure 58: Middle East & Africa Plant Growth Chamber Market Revenue (Million), by Country 2024 & 2032
                                                              59. Figure 59: Middle East & Africa Plant Growth Chamber Market Revenue Share (%), by Country 2024 & 2032
                                                              60. Figure 60: Asia Pacific Plant Growth Chamber Market Revenue (Million), by Production Analysis 2024 & 2032
                                                              61. Figure 61: Asia Pacific Plant Growth Chamber Market Revenue Share (%), by Production Analysis 2024 & 2032
                                                              62. Figure 62: Asia Pacific Plant Growth Chamber Market Revenue (Million), by Consumption Analysis 2024 & 2032
                                                              63. Figure 63: Asia Pacific Plant Growth Chamber Market Revenue Share (%), by Consumption Analysis 2024 & 2032
                                                              64. Figure 64: Asia Pacific Plant Growth Chamber Market Revenue (Million), by Import Market Analysis (Value & Volume) 2024 & 2032
                                                              65. Figure 65: Asia Pacific Plant Growth Chamber Market Revenue Share (%), by Import Market Analysis (Value & Volume) 2024 & 2032
                                                              66. Figure 66: Asia Pacific Plant Growth Chamber Market Revenue (Million), by Export Market Analysis (Value & Volume) 2024 & 2032
                                                              67. Figure 67: Asia Pacific Plant Growth Chamber Market Revenue Share (%), by Export Market Analysis (Value & Volume) 2024 & 2032
                                                              68. Figure 68: Asia Pacific Plant Growth Chamber Market Revenue (Million), by Price Trend Analysis 2024 & 2032
                                                              69. Figure 69: Asia Pacific Plant Growth Chamber Market Revenue Share (%), by Price Trend Analysis 2024 & 2032
                                                              70. Figure 70: Asia Pacific Plant Growth Chamber Market Revenue (Million), by Country 2024 & 2032
                                                              71. Figure 71: Asia Pacific Plant Growth Chamber Market Revenue Share (%), by Country 2024 & 2032

                                                              List of Tables

                                                              1. Table 1: Global Plant Growth Chamber Market Revenue Million Forecast, by Region 2019 & 2032
                                                              2. Table 2: Global Plant Growth Chamber Market Revenue Million Forecast, by Production Analysis 2019 & 2032
                                                              3. Table 3: Global Plant Growth Chamber Market Revenue Million Forecast, by Consumption Analysis 2019 & 2032
                                                              4. Table 4: Global Plant Growth Chamber Market Revenue Million Forecast, by Import Market Analysis (Value & Volume) 2019 & 2032
                                                              5. Table 5: Global Plant Growth Chamber Market Revenue Million Forecast, by Export Market Analysis (Value & Volume) 2019 & 2032
                                                              6. Table 6: Global Plant Growth Chamber Market Revenue Million Forecast, by Price Trend Analysis 2019 & 2032
                                                              7. Table 7: Global Plant Growth Chamber Market Revenue Million Forecast, by Region 2019 & 2032
                                                              8. Table 8: Global Plant Growth Chamber Market Revenue Million Forecast, by Country 2019 & 2032
                                                              9. Table 9: United States Plant Growth Chamber Market Revenue (Million) Forecast, by Application 2019 & 2032
                                                              10. Table 10: Canada Plant Growth Chamber Market Revenue (Million) Forecast, by Application 2019 & 2032
                                                              11. Table 11: Mexico Plant Growth Chamber Market Revenue (Million) Forecast, by Application 2019 & 2032
                                                              12. Table 12: Rest of North America Plant Growth Chamber Market Revenue (Million) Forecast, by Application 2019 & 2032
                                                              13. Table 13: Global Plant Growth Chamber Market Revenue Million Forecast, by Country 2019 & 2032
                                                              14. Table 14: Germany Plant Growth Chamber Market Revenue (Million) Forecast, by Application 2019 & 2032
                                                              15. Table 15: United Kingdom Plant Growth Chamber Market Revenue (Million) Forecast, by Application 2019 & 2032
                                                              16. Table 16: France Plant Growth Chamber Market Revenue (Million) Forecast, by Application 2019 & 2032
                                                              17. Table 17: Italy Plant Growth Chamber Market Revenue (Million) Forecast, by Application 2019 & 2032
                                                              18. Table 18: Russia Plant Growth Chamber Market Revenue (Million) Forecast, by Application 2019 & 2032
                                                              19. Table 19: Spain Plant Growth Chamber Market Revenue (Million) Forecast, by Application 2019 & 2032
                                                              20. Table 20: Rest of Europe Plant Growth Chamber Market Revenue (Million) Forecast, by Application 2019 & 2032
                                                              21. Table 21: Global Plant Growth Chamber Market Revenue Million Forecast, by Country 2019 & 2032
                                                              22. Table 22: China Plant Growth Chamber Market Revenue (Million) Forecast, by Application 2019 & 2032
                                                              23. Table 23: Japan Plant Growth Chamber Market Revenue (Million) Forecast, by Application 2019 & 2032
                                                              24. Table 24: India Plant Growth Chamber Market Revenue (Million) Forecast, by Application 2019 & 2032
                                                              25. Table 25: Australia Plant Growth Chamber Market Revenue (Million) Forecast, by Application 2019 & 2032
                                                              26. Table 26: Rest of Asia Pacific Plant Growth Chamber Market Revenue (Million) Forecast, by Application 2019 & 2032
                                                              27. Table 27: Global Plant Growth Chamber Market Revenue Million Forecast, by Country 2019 & 2032
                                                              28. Table 28: Brazil Plant Growth Chamber Market Revenue (Million) Forecast, by Application 2019 & 2032
                                                              29. Table 29: Argentina Plant Growth Chamber Market Revenue (Million) Forecast, by Application 2019 & 2032
                                                              30. Table 30: Rest of South America Plant Growth Chamber Market Revenue (Million) Forecast, by Application 2019 & 2032
                                                              31. Table 31: Global Plant Growth Chamber Market Revenue Million Forecast, by Country 2019 & 2032
                                                              32. Table 32: South Africa Plant Growth Chamber Market Revenue (Million) Forecast, by Application 2019 & 2032
                                                              33. Table 33: Rest of Africa Plant Growth Chamber Market Revenue (Million) Forecast, by Application 2019 & 2032
                                                              34. Table 34: Global Plant Growth Chamber Market Revenue Million Forecast, by Production Analysis 2019 & 2032
                                                              35. Table 35: Global Plant Growth Chamber Market Revenue Million Forecast, by Consumption Analysis 2019 & 2032
                                                              36. Table 36: Global Plant Growth Chamber Market Revenue Million Forecast, by Import Market Analysis (Value & Volume) 2019 & 2032
                                                              37. Table 37: Global Plant Growth Chamber Market Revenue Million Forecast, by Export Market Analysis (Value & Volume) 2019 & 2032
                                                              38. Table 38: Global Plant Growth Chamber Market Revenue Million Forecast, by Price Trend Analysis 2019 & 2032
                                                              39. Table 39: Global Plant Growth Chamber Market Revenue Million Forecast, by Country 2019 & 2032
                                                              40. Table 40: United States Plant Growth Chamber Market Revenue (Million) Forecast, by Application 2019 & 2032
                                                              41. Table 41: Canada Plant Growth Chamber Market Revenue (Million) Forecast, by Application 2019 & 2032
                                                              42. Table 42: Mexico Plant Growth Chamber Market Revenue (Million) Forecast, by Application 2019 & 2032
                                                              43. Table 43: Global Plant Growth Chamber Market Revenue Million Forecast, by Production Analysis 2019 & 2032
                                                              44. Table 44: Global Plant Growth Chamber Market Revenue Million Forecast, by Consumption Analysis 2019 & 2032
                                                              45. Table 45: Global Plant Growth Chamber Market Revenue Million Forecast, by Import Market Analysis (Value & Volume) 2019 & 2032
                                                              46. Table 46: Global Plant Growth Chamber Market Revenue Million Forecast, by Export Market Analysis (Value & Volume) 2019 & 2032
                                                              47. Table 47: Global Plant Growth Chamber Market Revenue Million Forecast, by Price Trend Analysis 2019 & 2032
                                                              48. Table 48: Global Plant Growth Chamber Market Revenue Million Forecast, by Country 2019 & 2032
                                                              49. Table 49: Brazil Plant Growth Chamber Market Revenue (Million) Forecast, by Application 2019 & 2032
                                                              50. Table 50: Argentina Plant Growth Chamber Market Revenue (Million) Forecast, by Application 2019 & 2032
                                                              51. Table 51: Rest of South America Plant Growth Chamber Market Revenue (Million) Forecast, by Application 2019 & 2032
                                                              52. Table 52: Global Plant Growth Chamber Market Revenue Million Forecast, by Production Analysis 2019 & 2032
                                                              53. Table 53: Global Plant Growth Chamber Market Revenue Million Forecast, by Consumption Analysis 2019 & 2032
                                                              54. Table 54: Global Plant Growth Chamber Market Revenue Million Forecast, by Import Market Analysis (Value & Volume) 2019 & 2032
                                                              55. Table 55: Global Plant Growth Chamber Market Revenue Million Forecast, by Export Market Analysis (Value & Volume) 2019 & 2032
                                                              56. Table 56: Global Plant Growth Chamber Market Revenue Million Forecast, by Price Trend Analysis 2019 & 2032
                                                              57. Table 57: Global Plant Growth Chamber Market Revenue Million Forecast, by Country 2019 & 2032
                                                              58. Table 58: United Kingdom Plant Growth Chamber Market Revenue (Million) Forecast, by Application 2019 & 2032
                                                              59. Table 59: Germany Plant Growth Chamber Market Revenue (Million) Forecast, by Application 2019 & 2032
                                                              60. Table 60: France Plant Growth Chamber Market Revenue (Million) Forecast, by Application 2019 & 2032
                                                              61. Table 61: Italy Plant Growth Chamber Market Revenue (Million) Forecast, by Application 2019 & 2032
                                                              62. Table 62: Spain Plant Growth Chamber Market Revenue (Million) Forecast, by Application 2019 & 2032
                                                              63. Table 63: Russia Plant Growth Chamber Market Revenue (Million) Forecast, by Application 2019 & 2032
                                                              64. Table 64: Benelux Plant Growth Chamber Market Revenue (Million) Forecast, by Application 2019 & 2032
                                                              65. Table 65: Nordics Plant Growth Chamber Market Revenue (Million) Forecast, by Application 2019 & 2032
                                                              66. Table 66: Rest of Europe Plant Growth Chamber Market Revenue (Million) Forecast, by Application 2019 & 2032
                                                              67. Table 67: Global Plant Growth Chamber Market Revenue Million Forecast, by Production Analysis 2019 & 2032
                                                              68. Table 68: Global Plant Growth Chamber Market Revenue Million Forecast, by Consumption Analysis 2019 & 2032
                                                              69. Table 69: Global Plant Growth Chamber Market Revenue Million Forecast, by Import Market Analysis (Value & Volume) 2019 & 2032
                                                              70. Table 70: Global Plant Growth Chamber Market Revenue Million Forecast, by Export Market Analysis (Value & Volume) 2019 & 2032
                                                              71. Table 71: Global Plant Growth Chamber Market Revenue Million Forecast, by Price Trend Analysis 2019 & 2032
                                                              72. Table 72: Global Plant Growth Chamber Market Revenue Million Forecast, by Country 2019 & 2032
                                                              73. Table 73: Turkey Plant Growth Chamber Market Revenue (Million) Forecast, by Application 2019 & 2032
                                                              74. Table 74: Israel Plant Growth Chamber Market Revenue (Million) Forecast, by Application 2019 & 2032
                                                              75. Table 75: GCC Plant Growth Chamber Market Revenue (Million) Forecast, by Application 2019 & 2032
                                                              76. Table 76: North Africa Plant Growth Chamber Market Revenue (Million) Forecast, by Application 2019 & 2032
                                                              77. Table 77: South Africa Plant Growth Chamber Market Revenue (Million) Forecast, by Application 2019 & 2032
                                                              78. Table 78: Rest of Middle East & Africa Plant Growth Chamber Market Revenue (Million) Forecast, by Application 2019 & 2032
                                                              79. Table 79: Global Plant Growth Chamber Market Revenue Million Forecast, by Production Analysis 2019 & 2032
                                                              80. Table 80: Global Plant Growth Chamber Market Revenue Million Forecast, by Consumption Analysis 2019 & 2032
                                                              81. Table 81: Global Plant Growth Chamber Market Revenue Million Forecast, by Import Market Analysis (Value & Volume) 2019 & 2032
                                                              82. Table 82: Global Plant Growth Chamber Market Revenue Million Forecast, by Export Market Analysis (Value & Volume) 2019 & 2032
                                                              83. Table 83: Global Plant Growth Chamber Market Revenue Million Forecast, by Price Trend Analysis 2019 & 2032
                                                              84. Table 84: Global Plant Growth Chamber Market Revenue Million Forecast, by Country 2019 & 2032
                                                              85. Table 85: China Plant Growth Chamber Market Revenue (Million) Forecast, by Application 2019 & 2032
                                                              86. Table 86: India Plant Growth Chamber Market Revenue (Million) Forecast, by Application 2019 & 2032
                                                              87. Table 87: Japan Plant Growth Chamber Market Revenue (Million) Forecast, by Application 2019 & 2032
                                                              88. Table 88: South Korea Plant Growth Chamber Market Revenue (Million) Forecast, by Application 2019 & 2032
                                                              89. Table 89: ASEAN Plant Growth Chamber Market Revenue (Million) Forecast, by Application 2019 & 2032
                                                              90. Table 90: Oceania Plant Growth Chamber Market Revenue (Million) Forecast, by Application 2019 & 2032
                                                              91. Table 91: Rest of Asia Pacific Plant Growth Chamber Market Revenue (Million) Forecast, by Application 2019 & 2032


                                                              Frequently Asked Questions

                                                              1. What is the projected Compound Annual Growth Rate (CAGR) of the Plant Growth Chamber Market?

                                                              The projected CAGR is approximately 4.70%.

                                                              2. Which companies are prominent players in the Plant Growth Chamber Market?

                                                              Key companies in the market include Weiss Techni, Darwin Chambers, Thermo Fisher, CARON Products & Services Inc, Conviron, Aralab, Percival Scientific Inc, Brs Bvba, BINDER GmbH, Hettich Benelux BV, Saveer Biotech Limited, Freezers India.

                                                              3. What are the main segments of the Plant Growth Chamber Market?

                                                              The market segments include Production Analysis, Consumption Analysis, Import Market Analysis (Value & Volume), Export Market Analysis (Value & Volume), Price Trend Analysis.

                                                              4. Can you provide details about the market size?

                                                              The market size is estimated to be USD 486.60 Million as of 2022.

                                                              5. What are some drivers contributing to market growth?

                                                              Seed Treatment As A Solution To Enhance Yield; Growing Awareness For Seed Treatment Among The Farmers; Rising Trend Of Organic Farming.

                                                              6. What are the notable trends driving market growth?

                                                              Increasing Demand for Food and Decreasing Arable Land.

                                                              7. Are there any restraints impacting market growth?

                                                              Limitations Across Farm-Level Seed Treatment; Rising Environmental Concerns.

                                                              8. Can you provide examples of recent developments in the market?

                                                              January 2022: Conviron launched a new EVO series of plant growth chambers, featuring a range of LE intensities, delivering a high degree of spatial uniformity for plant growth suitable for both short, medium, and tall plants.

                                                              9. What pricing options are available for accessing the report?

                                                              Pricing options include single-user, multi-user, and enterprise licenses priced at USD 4750, USD 5250, and USD 8750 respectively.

                                                              10. Is the market size provided in terms of value or volume?

                                                              The market size is provided in terms of value, measured in Million.

                                                              11. Are there any specific market keywords associated with the report?

                                                              Yes, the market keyword associated with the report is "Plant Growth Chamber Market," which aids in identifying and referencing the specific market segment covered.

                                                              12. How do I determine which pricing option suits my needs best?

                                                              The pricing options vary based on user requirements and access needs. Individual users may opt for single-user licenses, while businesses requiring broader access may choose multi-user or enterprise licenses for cost-effective access to the report.

                                                              13. Are there any additional resources or data provided in the Plant Growth Chamber Market report?

                                                              While the report offers comprehensive insights, it's advisable to review the specific contents or supplementary materials provided to ascertain if additional resources or data are available.

                                                              14. How can I stay updated on further developments or reports in the Plant Growth Chamber Market?

                                                              To stay informed about further developments, trends, and reports in the Plant Growth Chamber Market, consider subscribing to industry newsletters, following relevant companies and organizations, or regularly checking reputable industry news sources and publications.


                                                              Methodology

                                                              Step 1 - Identification of Relevant Samples Size from Population Database

                                                              Step Chart
                                                              Bar Chart
                                                              Method Chart

                                                              Step 2 - Approaches for Defining Global Market Size (Value, Volume* & Price*)

                                                              Approach Chart
                                                              Top-down and bottom-up approaches are used to validate the global market size and estimate the market size for manufactures, regional segments, product, and application.

                                                              Note*: In applicable scenarios

                                                              Step 3 - Data Sources

                                                              Primary Research

                                                              • Web Analytics
                                                              • Survey Reports
                                                              • Research Institute
                                                              • Latest Research Reports
                                                              • Opinion Leaders

                                                              Secondary Research

                                                              • Annual Reports
                                                              • White Paper
                                                              • Latest Press Release
                                                              • Industry Association
                                                              • Paid Database
                                                              • Investor Presentations
                                                              Analyst Chart

                                                              Step 4 - Data Triangulation

                                                              Involves using different sources of information in order to increase the validity of a study

                                                              These sources are likely to be stakeholders in a program - participants, other researchers, program staff, other community members, and so on.

                                                              Then we put all data in single framework & apply various statistical tools to find out the dynamic on the market.

                                                              During the analysis stage, feedback from the stakeholder groups would be compared to determine areas of agreement as well as areas of divergence

                                                              Additionally, after gathering mixed and scattered data from a wide range of sources, data is triangulated and correlated to come up with estimated figures which are further validated through primary mediums or industry experts, opinion leaders.

                                                              About Visionary Data Reports

                                                              Visionary Data Reports provides future-focused market research, advanced analytics, and strategic insights for technology, healthcare, green energy, and finance. Our reports help you anticipate trends, innovate, and lead in your industry. Our expert team combines primary research, data science, and industry knowledge to deliver actionable intelligence. We offer syndicated reports, custom analytics, and consulting services tailored to your business needs. At Visionary Data Reports, we are committed to quality, transparency, and client satisfaction. Every report is rigorously validated to ensure accuracy and relevance. Our global perspective and forward-thinking approach help you understand both current and emerging market dynamics.

                                                              Stay ahead with Visionary Data Reports. Subscribe to our newsletter for the latest insights and research highlights, and follow us on social media for real-time updates. Visionary Data Reports – Your Guide to Tomorrow’s Opportunities.

                                                              • Home
                                                              • About Us
                                                              • Industries
                                                                • Aerospace & Defense
                                                                • Agriculture
                                                                • Animal Nutrition & Wellness
                                                                • Automotive
                                                                • Chemicals & Materials
                                                                • Consumer Goods and Services
                                                                • Energy & Power
                                                                • Financial Services and Investment Intelligence
                                                                • Food & Beverage
                                                                • Home and Property Improvement
                                                                • Hospitality and Tourism
                                                                • Logistics
                                                                • Manufacturing Products and Services
                                                                • Packaging
                                                                • Professional and Commercial Services
                                                                • Real Estate and Construction
                                                                • Retail
                                                                • Technology, Media and Telecom
                                                                • Healthcare
                                                              • Services
                                                              • Contact
                                                              Main Logo
                                                              • Home
                                                              • About Us
                                                              • Industries
                                                                • Aerospace & Defense
                                                                • Agriculture
                                                                • Animal Nutrition & Wellness
                                                                • Automotive
                                                                • Chemicals & Materials
                                                                • Consumer Goods and Services
                                                                • Energy & Power
                                                                • Financial Services and Investment Intelligence
                                                                • Food & Beverage
                                                                • Home and Property Improvement
                                                                • Hospitality and Tourism
                                                                • Logistics
                                                                • Manufacturing Products and Services
                                                                • Packaging
                                                                • Professional and Commercial Services
                                                                • Real Estate and Construction
                                                                • Retail
                                                                • Technology, Media and Telecom
                                                                • Healthcare
                                                              • Services
                                                              • Contact
                                                              +17162654855
                                                              [email protected]

                                                              +17162654855

                                                              [email protected]

                                                              Business Address

                                                              Head Office

                                                              Office no. A 5010, fifth floor, Solitaire Business Hub, Near Phoenix mall, Pune, Maharashtra 411014

                                                              Contact Information

                                                              Craig Francis

                                                              Business Development Head

                                                              +17162654855

                                                              [email protected]

                                                              Connect With Us

                                                              Secure Payment Partners

                                                              payment image
                                                              RetailLogisticsPackagingAutomotiveHealthcareAgricultureEnergy & PowerFood & BeverageAerospace & DefenseChemicals & MaterialsHospitality and TourismAnimal Nutrition & WellnessConsumer Goods and ServicesReal Estate and ConstructionHome and Property ImprovementTechnology, Media and TelecomManufacturing Products and ServicesFinancial Services and Investment Intelligence

                                                              © 2025 All rights reserved


                                                              Privacy Policy
                                                              Terms and Conditions
                                                              FAQ
                                                              artwork spiralartwork spiralRelated Reports
                                                              artwork underline

                                                              Emerging Trends in Brazil Maize Market: A Technology Perspective 2025-2033

                                                              Discover the dynamic Brazil maize market forecast (2025-2033)! This in-depth analysis reveals key growth drivers, including animal feed, biofuel, and human consumption, alongside major players like Syngenta and Corteva. Explore market size, CAGR, and regional insights to understand this lucrative opportunity.

                                                              July 2025
                                                              Base Year: 2024
                                                              No Of Pages: 180
                                                              Price: $3800

                                                              Future Forecasts for North America Seed Treatment Market Industry Growth

                                                              Discover the booming North American seed treatment market! This in-depth analysis reveals a CAGR of 4.20% (2025-2033), driven by precision farming, pest control needs, and government support. Explore key players, market segments (fungicides, insecticides, crops), and regional trends in the US, Canada, and Mexico. Get the data-driven insights you need to succeed.

                                                              July 2025
                                                              Base Year: 2024
                                                              No Of Pages: 150
                                                              Price: $3800

                                                              Africa Chia Seeds Industry Market’s Drivers and Challenges: Strategic Overview 2025-2033

                                                              Discover the booming African chia seed market! Our analysis reveals a $13.87M market in 2025, projected to grow at a 2.10% CAGR through 2033. Explore key trends, segments (organic, hybrid, processed, omega-3 rich), applications (food & beverage, supplements, personal care), and leading companies. Get insights for investment and market entry.

                                                              July 2025
                                                              Base Year: 2024
                                                              No Of Pages: 180
                                                              Price: $4750

                                                              Strategic Trends in Asia-Pacific Seed Coating Materials Market Market 2025-2033

                                                              The Asia-Pacific seed coating materials market is booming, with an 8% CAGR. Discover key trends, leading companies (BASF, Bayer), and segment analysis (polymers, colorants) driving growth in this $XX million market. Explore the forecast to 2033.

                                                              July 2025
                                                              Base Year: 2024
                                                              No Of Pages: 150
                                                              Price: $3800

                                                              Comprehensive Review of UK Fruits and Vegetables Market Growth Potential

                                                              Discover the booming UK fruits and vegetables market! This in-depth analysis reveals a £31.58 billion market with a 2.97% CAGR (2025-2033), driven by health trends and major players like Tesco and Sainsbury's. Explore regional data, consumption patterns, and future growth potential.

                                                              July 2025
                                                              Base Year: 2024
                                                              No Of Pages: 180
                                                              Price: $3800

                                                              Malaysia Agrochemical Market Market’s Drivers and Challenges: Strategic Overview 2025-2033

                                                              Discover the booming Malaysian agrochemical market! This comprehensive analysis reveals a RM 679.59 million market in 2025, projected to grow at a 4.56% CAGR until 2033. Explore key drivers, trends, restraints, and leading companies shaping this dynamic sector. Learn about fertilizers, pesticides, and other agrochemical segments.

                                                              July 2025
                                                              Base Year: 2024
                                                              No Of Pages: 150
                                                              Price: $3800

                                                              Drivers of Change in Agricultural Surfactant Market Market 2025-2033

                                                              The global agricultural surfactant market is booming, projected to reach $3.56 billion by 2033 with a 6.70% CAGR. Driven by precision agriculture and sustainable farming, this market analysis explores key segments (anionic, nonionic, bio-based), top players (BASF, Clariant), and regional growth trends. Discover the future of agricultural surfactants.

                                                              July 2025
                                                              Base Year: 2024
                                                              No Of Pages: 234
                                                              Price: $4750

                                                              Cameroon Grains Industry Industry Analysis and Consumer Behavior

                                                              Discover the booming Cameroon grains industry! Explore market size, growth trends (4.80% CAGR), key players (Sodecoton, CDC, etc.), and challenges impacting cereals, pulses, and oilseeds in Cameroon from 2019-2033. Invest wisely in this promising African market.

                                                              July 2025
                                                              Base Year: 2024
                                                              No Of Pages: 180
                                                              Price: $3800

                                                              Analyzing Consumer Behavior in Agriculture Market in Tanzania Market

                                                              Discover the booming Tanzanian agriculture market! Projected to reach $17.44 billion in 2025, with a 5.63% CAGR, this report analyzes market size, key players (Syngenta, Rijk Zwaan), growth drivers, and future trends in Tanzania's agricultural sector. Explore market segments, including food crops and investment opportunities.

                                                              July 2025
                                                              Base Year: 2024
                                                              No Of Pages: 150
                                                              Price: $3800

                                                              Analyzing Consumer Behavior in Artificial Intelligence in Agriculture Industry Market

                                                              Discover the booming AI in Agriculture market! This comprehensive analysis reveals a 4.20% CAGR, key drivers, trends, restraints, and regional insights from 2019-2033. Learn about leading companies and applications like precision farming, drone analytics, and weather tracking. Explore market size projections and future growth potential.

                                                              July 2025
                                                              Base Year: 2024
                                                              No Of Pages: 150
                                                              Price: $4750

                                                              Exploring Forestry Machinery Market’s Market Size Dynamics 2025-2033

                                                              The global forestry machinery market is booming, projected to reach $15 billion by 2033, driven by rising timber demand and technological advancements. Explore market trends, key players (Deere, Komatsu, etc.), and regional growth in our comprehensive analysis.

                                                              July 2025
                                                              Base Year: 2024
                                                              No Of Pages: 150
                                                              Price: $4750

                                                              Nutrition Canary Seed Market Competitive Strategies: Trends and Forecasts 2025-2033

                                                              Discover the booming nutrition canary seed market! Explore key trends, growth drivers, and regional market share projections for 2025-2033. Learn about leading companies and the increasing demand driven by health-conscious consumers and the birdseed industry.

                                                              July 2025
                                                              Base Year: 2024
                                                              No Of Pages: 234
                                                              Price: $4750

                                                              Consumer Behavior and Cashews Market in South America Trends

                                                              Discover the booming South American cashew market! This comprehensive analysis reveals a $582.24 million market in 2025, projected to grow at a 5.20% CAGR through 2033. Explore key trends, drivers, and leading companies shaping this lucrative industry.

                                                              July 2025
                                                              Base Year: 2024
                                                              No Of Pages: 180
                                                              Price: $3800

                                                              Strategic Growth Drivers for Rye Industry Market

                                                              Discover the latest market analysis of the global rye industry, projecting a steady CAGR of 2.20% to 2033. Explore key drivers, restraints, and regional trends impacting the growth of rye in food, feed, and beverage applications. Learn about leading companies and future market opportunities.

                                                              July 2025
                                                              Base Year: 2024
                                                              No Of Pages: 234
                                                              Price: $4750

                                                              Comprehensive Overview of Water Soluble Fertilizer Industry Trends: 2025-2033

                                                              Discover the booming water-soluble fertilizer market! Explore its $XX million valuation in 2025, projected 3.80% CAGR growth to 2033, key drivers, trends, and regional insights. Learn about top players and lucrative segments like fertigation and horticultural crops.

                                                              July 2025
                                                              Base Year: 2024
                                                              No Of Pages: 150
                                                              Price: $3800

                                                              Asia-Pacific Agricultural Tractors Market Market Expansion: Growth Outlook 2025-2033

                                                              Discover the booming Asia-Pacific Agricultural Tractors market! Our analysis reveals a $15 billion USD market in 2025, projected to grow at a 6% CAGR through 2033. Explore market size, growth trends, and regional breakdowns for India, China, and other key countries. Learn how technological advancements and government initiatives are shaping the future of farming.

                                                              July 2025
                                                              Base Year: 2024
                                                              No Of Pages: 197
                                                              Price: $3800

                                                              Asia-Pacific Agricultural Enzymes Market Market’s Consumer Preferences: Trends and Analysis 2025-2033

                                                              The Asia-Pacific agricultural enzymes market is booming, projected to reach $XX million by 2025, with a CAGR of 10.30%. This report analyzes market drivers, trends, restraints, and key players like Novozymes and BASF, covering segments like carbohydrases and applications in crop protection. Discover regional insights and forecast data for 2025-2033.

                                                              July 2025
                                                              Base Year: 2024
                                                              No Of Pages: 197
                                                              Price: $3800

                                                              Strategic Vision for USA Agricultural Irrigation Machinery Market Industry Trends

                                                              Discover the booming US agricultural irrigation machinery market! This in-depth analysis reveals projected growth to $3.8B by 2033, driven by water scarcity, precision agriculture, and smart irrigation technology. Explore key players, regional trends, and market segmentation in drip, sprinkler, and pivot irrigation.

                                                              July 2025
                                                              Base Year: 2024
                                                              No Of Pages: 150
                                                              Price: $3800

                                                              Electric Lawn Mowers Market Insightful Market Analysis: Trends and Opportunities 2025-2033

                                                              Discover the booming electric lawn mower market! This comprehensive analysis reveals a CAGR of 6.50%, driven by eco-consciousness and technological advancements. Explore market size, key players (Toro, Husqvarna, etc.), regional trends, and future projections (2025-2033) for residential, professional, and golf course applications.

                                                              July 2025
                                                              Base Year: 2024
                                                              No Of Pages: 150
                                                              Price: $4750

                                                              Asia-pacific Forage Seed Market Report 2025: Growth Driven by Government Incentives and Partnerships

                                                              Discover the booming Asia-Pacific forage seed market! Explore key trends, growth drivers (including increasing livestock & adoption of hybrid seeds), and challenges impacting alfalfa, forage corn, and other crops. Learn about leading companies and regional market shares. Projected CAGR of 4.70% to 2033.

                                                              July 2025
                                                              Base Year: 2024
                                                              No Of Pages: 150
                                                              Price: $3800