

Key Insights
The global pipeline maintenance services market is projected for significant expansion, fueled by the escalating need for secure and efficient oil and gas transportation, alongside stringent regulatory mandates for pipeline safety and integrity. This market is anticipated to grow at a Compound Annual Growth Rate (CAGR) of 6.6%, reaching a market size of $26.64 billion by 2025. Key service areas, including pigging, flushing, and chemical cleaning, are integral to maintaining operational efficiency. Pipeline repair and integrity management are also critical segments, addressing aging infrastructure and unexpected damage. Currently, the onshore segment leads in market share due to the extensive global network of onshore pipelines. However, the offshore sector is poised for considerable growth, driven by ongoing exploration and production. Leading companies such as IKM Gruppen AS, Shell Plc, and Kinder Morgan Inc. are instrumental in driving market innovation and consolidation. Geographically, North America and Europe are dominant due to established infrastructure and robust regulations, while Asia Pacific is expected to witness substantial growth, aligning with rapid industrialization and increasing energy demands. Government investments in pipeline infrastructure development and modernization further propel this expansion.
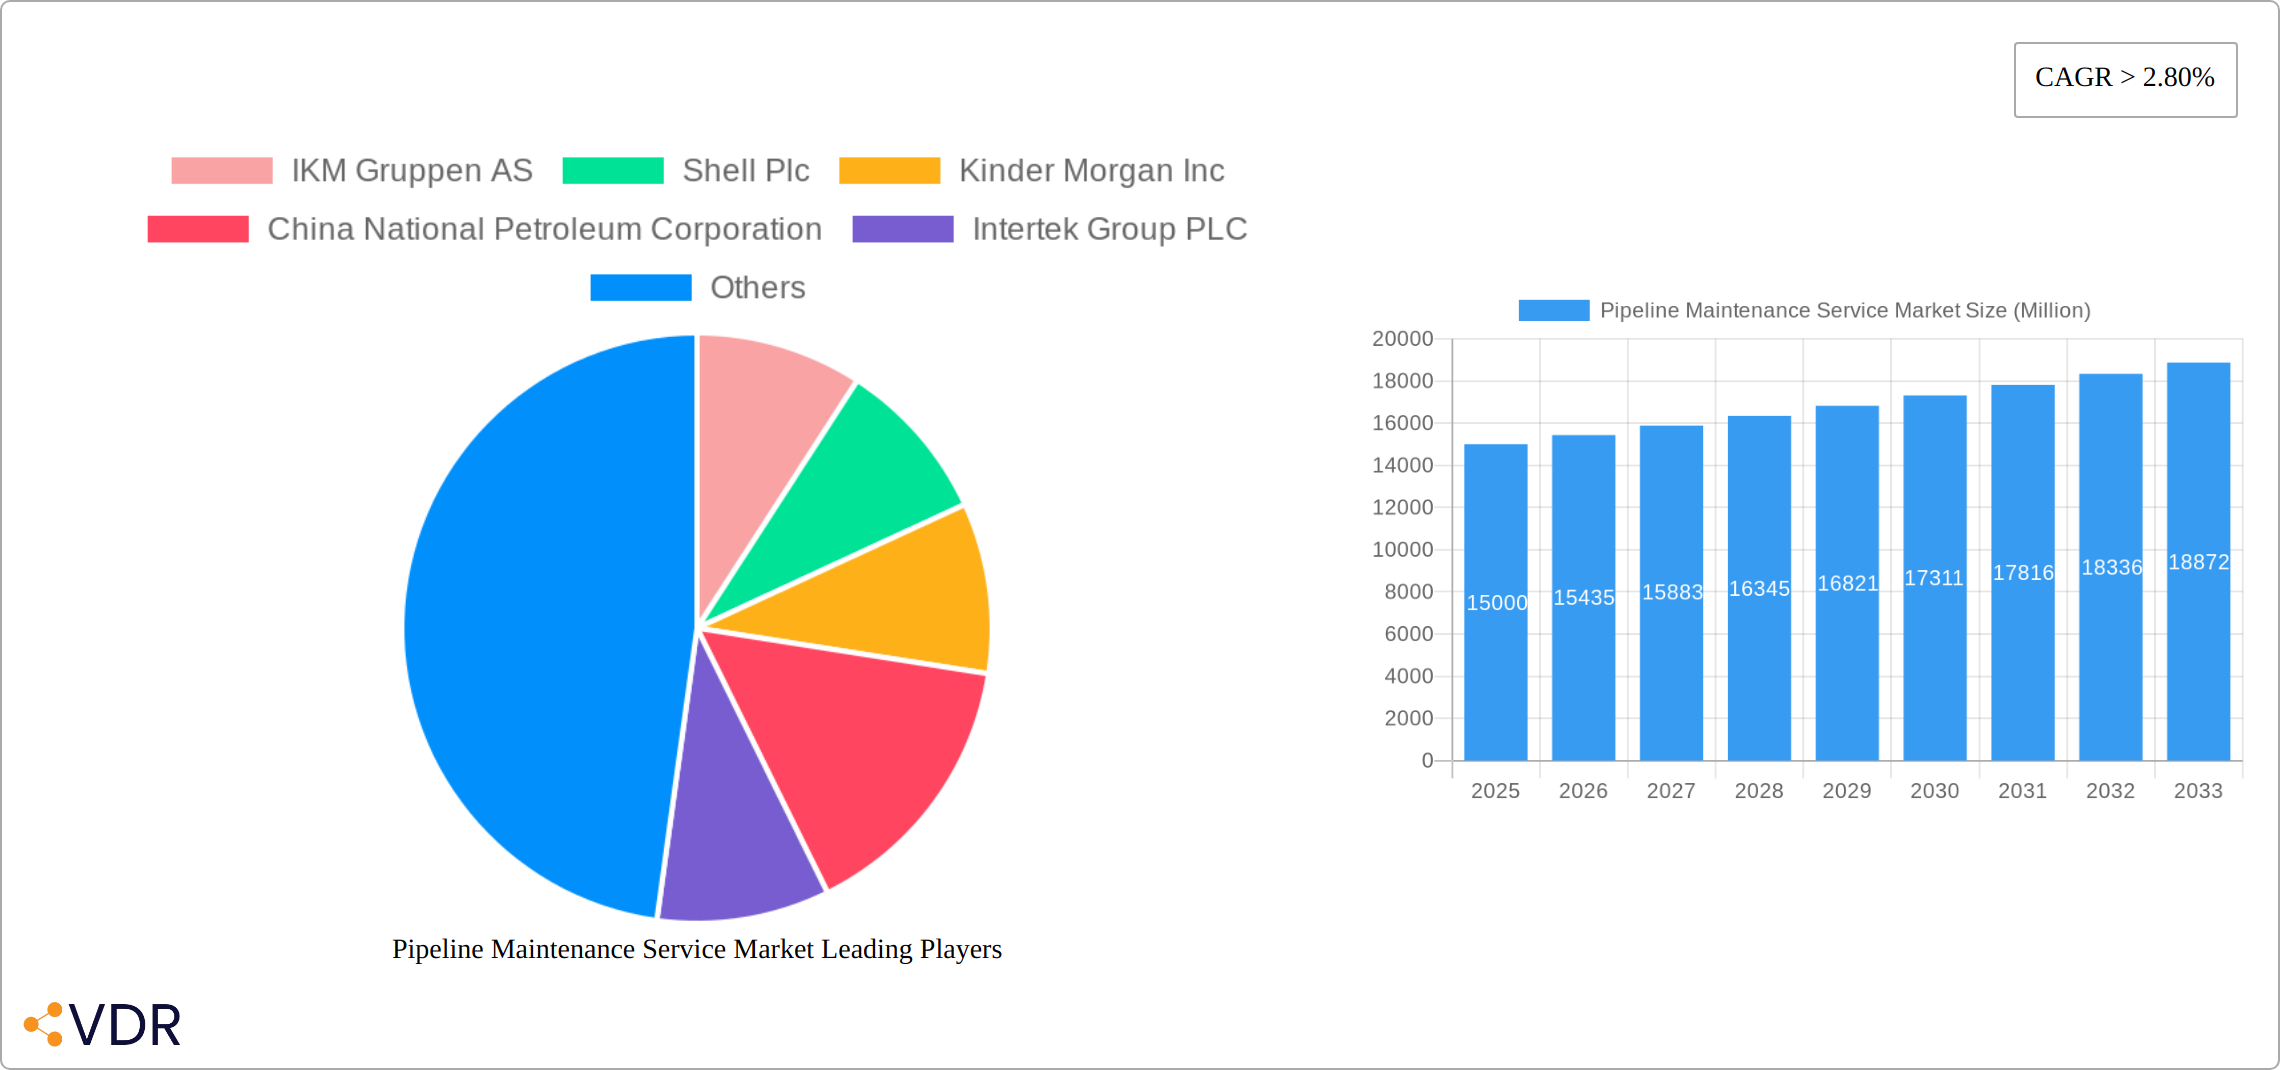
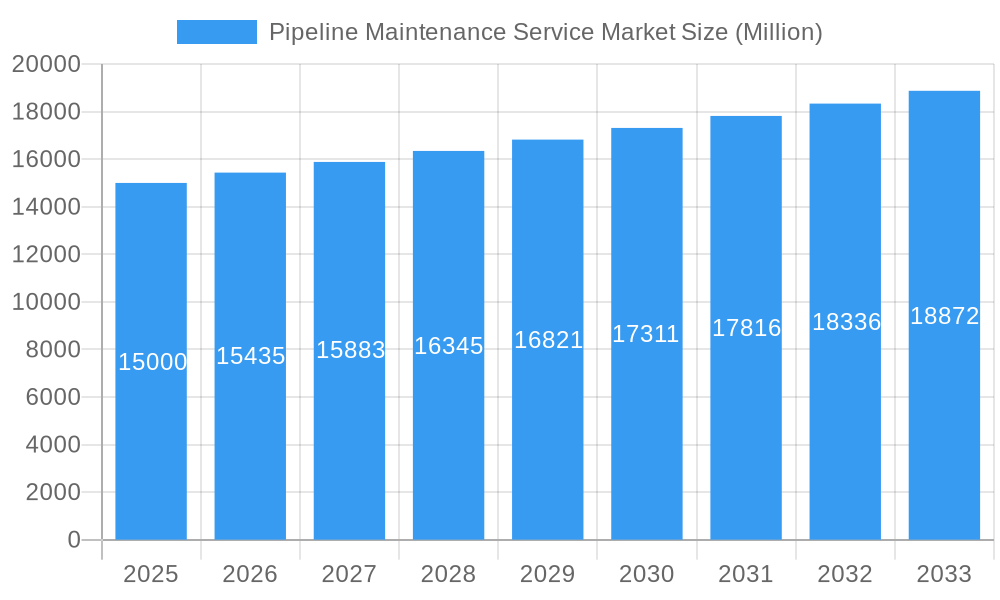
Pipeline Maintenance Service Market Market Size (In Billion)
Several factors are shaping the market's growth. Evolving environmental regulations are driving the adoption of advanced cleaning and maintenance methodologies. Technological advancements in pipeline inspection are enhancing predictive maintenance strategies. The increasing integration of digitalization and data analytics is optimizing maintenance planning and reducing operational downtime. Nevertheless, challenges such as volatile oil prices, substantial investment requirements for specialized equipment, and regional skilled labor shortages persist. Overcoming these hurdles through innovation, workforce development, and strategic alliances will be vital for sustained market growth. The projected expansion offers substantial opportunities for providers of advanced pipeline maintenance solutions, particularly in rapidly developing economies within Asia Pacific and other emerging regions.
Pipeline Maintenance Service Market Company Market Share
Pipeline Maintenance Service Market: A Comprehensive Report (2019-2033)
This in-depth report provides a comprehensive analysis of the global Pipeline Maintenance Service Market, encompassing market dynamics, growth trends, regional segmentation, product landscape, key players, and future outlook. The study period covers 2019-2033, with 2025 as the base and estimated year. This report is invaluable for industry professionals, investors, and strategic decision-makers seeking actionable insights into this crucial sector. The market is segmented by service type (Pigging, Flushing & Chemical Cleaning, Pipeline Repair & Maintenance, Drying, Others) and location of deployment (Onshore, Offshore).
Pipeline Maintenance Service Market Dynamics & Structure
The Pipeline Maintenance Service Market is characterized by a moderately concentrated structure, with key players like IKM Gruppen AS, Shell Plc, Kinder Morgan Inc., and China National Petroleum Corporation holding significant market share. However, the presence of numerous smaller, specialized service providers fosters competition. The market is driven by technological innovation, particularly in areas like advanced inspection technologies (e.g., smart pigs, robotic inspection), predictive maintenance analytics, and automation. Regulatory frameworks, varying across regions, play a crucial role, influencing safety standards and operational protocols. Substitute products are limited, as pipeline integrity management remains paramount. The end-user demographic primarily comprises pipeline operators, including energy companies (e.g., BP Plc, ExxonMobil Corporation, Chevron Corporation) and government-owned entities. M&A activity has been moderate, with deals primarily focused on acquiring specialized expertise or expanding geographical reach. The total M&A deal volume from 2019-2024 was approximately xx Million.
- Market Concentration: Moderately concentrated, with top 5 players holding approximately xx% market share (2024).
- Technological Innovation: Strong driver, with focus on advanced inspection, predictive maintenance, and automation.
- Regulatory Framework: Significant influence on safety standards and operational practices, varying regionally.
- Competitive Substitutes: Limited, due to the critical nature of pipeline integrity.
- End-User Demographics: Primarily pipeline operators (energy companies and government entities).
- M&A Trends: Moderate activity, driven by expansion and expertise acquisition.
Pipeline Maintenance Service Market Growth Trends & Insights
The global Pipeline Maintenance Service Market experienced robust growth during the historical period (2019-2024), expanding from xx Million in 2019 to xx Million in 2024, registering a CAGR of xx%. This growth is primarily attributed to increasing global energy demand, expansion of pipeline infrastructure (especially in developing economies), and stringent regulatory requirements related to pipeline safety. The market penetration rate for advanced maintenance technologies is currently estimated at xx%, with considerable potential for future growth. Technological disruptions, such as the adoption of digital twins and AI-powered predictive analytics, are further accelerating market expansion. Consumer behavior shifts are minimal, with a focus on reliable, safe, and cost-effective solutions. The market is projected to continue its growth trajectory during the forecast period (2025-2033), reaching xx Million by 2033, at a CAGR of xx%.
Dominant Regions, Countries, or Segments in Pipeline Maintenance Service Market
North America and Europe continue to hold a dominant position in the Pipeline Maintenance Service Market. This leadership is primarily attributed to their extensive and mature pipeline networks, coupled with an unwavering commitment to stringent safety and environmental regulations. Furthermore, a high degree of technological adoption in these regions facilitates efficient and advanced maintenance practices. In parallel, the Asia-Pacific region is experiencing a remarkable growth trajectory. This expansion is fueled by the burgeoning energy sector, significant investments in new pipeline construction projects to meet rising energy demands, and the increasing integration of renewable energy sources requiring robust transport infrastructure. Within the service segment, Pipeline Repair & Maintenance commands the largest market share, reflecting the ongoing need for integrity management of existing assets. This is closely followed by essential services such as Pigging, Flushing & Chemical Cleaning, which are critical for maintaining pipeline efficiency and longevity. Currently, Onshore pipeline deployments represent a larger market share due to the sheer volume of existing infrastructure. However, the Offshore segment is projected to witness a faster growth rate. This surge is driven by escalating offshore oil and gas exploration and production activities, necessitating specialized and advanced maintenance solutions for subsea and deep-water pipelines.
- Key Drivers (North America & Europe): Established and aging pipeline infrastructure requiring continuous upkeep, rigorous regulatory frameworks emphasizing safety and environmental protection, and high adoption rates of advanced inspection and repair technologies.
- Key Drivers (Asia-Pacific): Rapidly expanding energy sector, substantial government and private sector investments in the construction of new, long-distance pipeline networks, and a growing focus on enhancing energy security.
- Dominant Service Type: Pipeline Repair & Maintenance, addressing critical needs for integrity management and operational continuity.
- Dominant Deployment: Onshore infrastructure, accounting for the majority of current maintenance activities.
- High-Growth Potential: Asia-Pacific leads in growth due to new infrastructure development, followed by the Middle East and Africa, which are also experiencing significant investments in energy transport and industrialization.
Pipeline Maintenance Service Market Product Landscape
The Pipeline Maintenance Service Market offers a range of products and services, including advanced inspection technologies (e.g., smart pigs, inline inspection tools), specialized cleaning and repair equipment, and comprehensive maintenance packages. These services are tailored to specific pipeline types, materials, and operating conditions. The unique selling propositions often include enhanced efficiency, reduced downtime, improved safety, and extended pipeline lifespan. Technological advancements are focused on automation, data analytics, and remote monitoring capabilities.
Key Drivers, Barriers & Challenges in Pipeline Maintenance Service Market
Key Drivers: The relentless increase in global energy demand, coupled with the continuous expansion of pipeline infrastructure worldwide, serves as a primary growth catalyst. Furthermore, increasingly stringent safety, environmental, and regulatory standards are compelling operators to invest more in proactive and comprehensive maintenance. Technological advancements, particularly in areas like artificial intelligence (AI)-powered predictive maintenance and advanced sensor technologies, are enabling more efficient and cost-effective interventions, thereby driving market adoption of these services.
Key Barriers & Challenges: The market faces significant hurdles, including the substantial initial investment costs associated with adopting cutting-edge technologies and advanced inspection equipment. A persistent challenge is the shortage of skilled labor proficient in operating and maintaining these sophisticated systems and performing specialized repair tasks. Geopolitical instability in certain regions can disrupt project timelines and implementation, leading to delays and increased costs. Moreover, navigating and ensuring compliance with diverse and rigorous regulatory frameworks across different jurisdictions requires considerable effort and resources. These challenges, if not effectively mitigated through strategic planning, technological innovation, and workforce development, could potentially impede market growth by an estimated 15-20% by 2033.
Emerging Opportunities in Pipeline Maintenance Service Market
The pipeline maintenance service market is ripe with opportunities stemming from the integration of transformative technologies. The development and widespread adoption of autonomous systems, such as drones equipped with advanced imaging and sensor capabilities for remote pipeline inspection, are opening new avenues. The implementation of AI-driven predictive maintenance platforms, which can analyze vast datasets to forecast potential failures before they occur, offers significant value in terms of cost savings and operational uptime. Furthermore, the deployment of robotic solutions for complex underwater or hazardous environment repairs presents a substantial growth area. Untapped markets in developing regions, characterized by rapidly expanding energy infrastructures and a growing need for reliable and efficient maintenance services, offer substantial long-term potential for market players.
Growth Accelerators in the Pipeline Maintenance Service Market Industry
Long-term growth will be fueled by technological breakthroughs, strategic partnerships between service providers and pipeline operators, and expansion into new geographical markets, particularly in developing economies. Increased government investments in infrastructure development and strengthening safety regulations will also contribute significantly to market expansion.
Key Players Shaping the Pipeline Maintenance Service Market Market
- IKM Gruppen AS
- Shell Plc (Shell Plc)
- Kinder Morgan Inc. (Kinder Morgan Inc.)
- China National Petroleum Corporation
- Intertek Group PLC (Intertek Group PLC)
- T D Williamson Inc.
- Chevron Corporation (Chevron Corporation)
- Oil States Industries Inc.
- EnerMech Ltd.
- STATS Group
- Pipeline Operators
- BP Plc (BP Plc)
- Dacon Inspection Services Co Ltd
- Baker Hughes A GE Co. (Baker Hughes A GE Co.)
- ExxonMobil Corporation (ExxonMobil Corporation)
- Pipeline Maintenance Services Providers
Notable Milestones in Pipeline Maintenance Service Market Sector
- October 2021: Optilan completes the first year of operation on the BTC pipeline project, highlighting growth in new pipeline construction and system expansions.
- October 2020: Stork secures a five-year pipeline maintenance contract in Peru, demonstrating the increasing demand for comprehensive maintenance services.
- November 2020: CenterPoint Energy announces a $240 million pipeline modernization plan, signifying investments in pipeline infrastructure upgrades.
In-Depth Pipeline Maintenance Service Market Market Outlook
The Pipeline Maintenance Service Market is on a trajectory of sustained and robust growth, underpinned by the enduring global demand for energy, continuous expansion of vital pipeline infrastructure, and the relentless pace of technological innovation. The future landscape of the market will be significantly shaped by strategic partnerships between service providers and operators, substantial investments in research and development to foster next-generation maintenance solutions, and an increasing emphasis on developing sustainable and environmentally conscious maintenance practices. To fully capitalize on the market's immense potential, stakeholders must proactively address critical challenges related to cost optimization for advanced technologies, ensuring an adequate supply of skilled personnel, and navigating the complex and evolving regulatory environment. Success will hinge on the ability to deliver efficient, reliable, and cost-effective maintenance solutions that meet the growing demands of a dynamic energy sector.
Pipeline Maintenance Service Market Segmentation
-
1. Service Type
- 1.1. Pigging
- 1.2. Flushing & Chemical Cleaning
- 1.3. Pipeline Repair & Maintenance
- 1.4. Drying
- 1.5. Others
-
2. Location of Deployment
- 2.1. Onshore
- 2.2. Offshore
Pipeline Maintenance Service Market Segmentation By Geography
- 1. North America
- 2. Europe
- 3. Asia Pacific
- 4. South America
- 5. Middle East and Africa
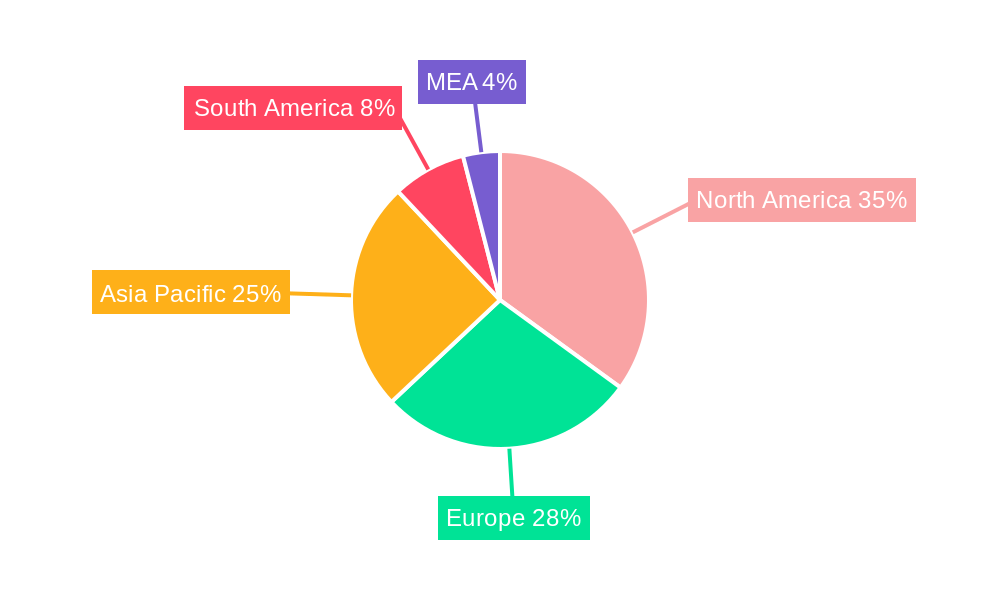
Pipeline Maintenance Service Market Regional Market Share
Geographic Coverage of Pipeline Maintenance Service Market
Pipeline Maintenance Service Market REPORT HIGHLIGHTS
| Aspects | Details |
|---|---|
| Study Period | 2020-2034 |
| Base Year | 2025 |
| Estimated Year | 2026 |
| Forecast Period | 2026-2034 |
| Historical Period | 2020-2025 |
| Growth Rate | CAGR of 6.6% from 2020-2034 |
| Segmentation |
|
Table of Contents
- 1. Introduction
- 1.1. Research Scope
- 1.2. Market Segmentation
- 1.3. Research Methodology
- 1.4. Definitions and Assumptions
- 2. Executive Summary
- 2.1. Introduction
- 3. Market Dynamics
- 3.1. Introduction
- 3.2. Market Drivers
- 3.2.1. 4.; Increasing Gas Production and Infrastructure4.; Increasing Exploration and Production Activities
- 3.3. Market Restrains
- 3.3.1. 4.; Increasing Adoption of Clean Power Sources
- 3.4. Market Trends
- 3.4.1. Pipeline Repair & Maintenance Segment to have a Significant Share in the Market
- 4. Market Factor Analysis
- 4.1. Porters Five Forces
- 4.2. Supply/Value Chain
- 4.3. PESTEL analysis
- 4.4. Market Entropy
- 4.5. Patent/Trademark Analysis
- 5. Global Pipeline Maintenance Service Market Analysis, Insights and Forecast, 2020-2032
- 5.1. Market Analysis, Insights and Forecast - by Service Type
- 5.1.1. Pigging
- 5.1.2. Flushing & Chemical Cleaning
- 5.1.3. Pipeline Repair & Maintenance
- 5.1.4. Drying
- 5.1.5. Others
- 5.2. Market Analysis, Insights and Forecast - by Location of Deployment
- 5.2.1. Onshore
- 5.2.2. Offshore
- 5.3. Market Analysis, Insights and Forecast - by Region
- 5.3.1. North America
- 5.3.2. Europe
- 5.3.3. Asia Pacific
- 5.3.4. South America
- 5.3.5. Middle East and Africa
- 5.1. Market Analysis, Insights and Forecast - by Service Type
- 6. North America Pipeline Maintenance Service Market Analysis, Insights and Forecast, 2020-2032
- 6.1. Market Analysis, Insights and Forecast - by Service Type
- 6.1.1. Pigging
- 6.1.2. Flushing & Chemical Cleaning
- 6.1.3. Pipeline Repair & Maintenance
- 6.1.4. Drying
- 6.1.5. Others
- 6.2. Market Analysis, Insights and Forecast - by Location of Deployment
- 6.2.1. Onshore
- 6.2.2. Offshore
- 6.1. Market Analysis, Insights and Forecast - by Service Type
- 7. Europe Pipeline Maintenance Service Market Analysis, Insights and Forecast, 2020-2032
- 7.1. Market Analysis, Insights and Forecast - by Service Type
- 7.1.1. Pigging
- 7.1.2. Flushing & Chemical Cleaning
- 7.1.3. Pipeline Repair & Maintenance
- 7.1.4. Drying
- 7.1.5. Others
- 7.2. Market Analysis, Insights and Forecast - by Location of Deployment
- 7.2.1. Onshore
- 7.2.2. Offshore
- 7.1. Market Analysis, Insights and Forecast - by Service Type
- 8. Asia Pacific Pipeline Maintenance Service Market Analysis, Insights and Forecast, 2020-2032
- 8.1. Market Analysis, Insights and Forecast - by Service Type
- 8.1.1. Pigging
- 8.1.2. Flushing & Chemical Cleaning
- 8.1.3. Pipeline Repair & Maintenance
- 8.1.4. Drying
- 8.1.5. Others
- 8.2. Market Analysis, Insights and Forecast - by Location of Deployment
- 8.2.1. Onshore
- 8.2.2. Offshore
- 8.1. Market Analysis, Insights and Forecast - by Service Type
- 9. South America Pipeline Maintenance Service Market Analysis, Insights and Forecast, 2020-2032
- 9.1. Market Analysis, Insights and Forecast - by Service Type
- 9.1.1. Pigging
- 9.1.2. Flushing & Chemical Cleaning
- 9.1.3. Pipeline Repair & Maintenance
- 9.1.4. Drying
- 9.1.5. Others
- 9.2. Market Analysis, Insights and Forecast - by Location of Deployment
- 9.2.1. Onshore
- 9.2.2. Offshore
- 9.1. Market Analysis, Insights and Forecast - by Service Type
- 10. Middle East and Africa Pipeline Maintenance Service Market Analysis, Insights and Forecast, 2020-2032
- 10.1. Market Analysis, Insights and Forecast - by Service Type
- 10.1.1. Pigging
- 10.1.2. Flushing & Chemical Cleaning
- 10.1.3. Pipeline Repair & Maintenance
- 10.1.4. Drying
- 10.1.5. Others
- 10.2. Market Analysis, Insights and Forecast - by Location of Deployment
- 10.2.1. Onshore
- 10.2.2. Offshore
- 10.1. Market Analysis, Insights and Forecast - by Service Type
- 11. Competitive Analysis
- 11.1. Global Market Share Analysis 2025
- 11.2. Company Profiles
- 11.2.1 IKM Gruppen AS
- 11.2.1.1. Overview
- 11.2.1.2. Products
- 11.2.1.3. SWOT Analysis
- 11.2.1.4. Recent Developments
- 11.2.1.5. Financials (Based on Availability)
- 11.2.2 Shell Plc
- 11.2.2.1. Overview
- 11.2.2.2. Products
- 11.2.2.3. SWOT Analysis
- 11.2.2.4. Recent Developments
- 11.2.2.5. Financials (Based on Availability)
- 11.2.3 Kinder Morgan Inc
- 11.2.3.1. Overview
- 11.2.3.2. Products
- 11.2.3.3. SWOT Analysis
- 11.2.3.4. Recent Developments
- 11.2.3.5. Financials (Based on Availability)
- 11.2.4 China National Petroleum Corporation
- 11.2.4.1. Overview
- 11.2.4.2. Products
- 11.2.4.3. SWOT Analysis
- 11.2.4.4. Recent Developments
- 11.2.4.5. Financials (Based on Availability)
- 11.2.5 Intertek Group PLC
- 11.2.5.1. Overview
- 11.2.5.2. Products
- 11.2.5.3. SWOT Analysis
- 11.2.5.4. Recent Developments
- 11.2.5.5. Financials (Based on Availability)
- 11.2.6 T D Williamson Inc
- 11.2.6.1. Overview
- 11.2.6.2. Products
- 11.2.6.3. SWOT Analysis
- 11.2.6.4. Recent Developments
- 11.2.6.5. Financials (Based on Availability)
- 11.2.7 Chevron Corporation
- 11.2.7.1. Overview
- 11.2.7.2. Products
- 11.2.7.3. SWOT Analysis
- 11.2.7.4. Recent Developments
- 11.2.7.5. Financials (Based on Availability)
- 11.2.8 Oil States Industries Inc
- 11.2.8.1. Overview
- 11.2.8.2. Products
- 11.2.8.3. SWOT Analysis
- 11.2.8.4. Recent Developments
- 11.2.8.5. Financials (Based on Availability)
- 11.2.9 EnerMech Ltd
- 11.2.9.1. Overview
- 11.2.9.2. Products
- 11.2.9.3. SWOT Analysis
- 11.2.9.4. Recent Developments
- 11.2.9.5. Financials (Based on Availability)
- 11.2.10 STATS Group
- 11.2.10.1. Overview
- 11.2.10.2. Products
- 11.2.10.3. SWOT Analysis
- 11.2.10.4. Recent Developments
- 11.2.10.5. Financials (Based on Availability)
- 11.2.11 Pipeline Operators
- 11.2.11.1. Overview
- 11.2.11.2. Products
- 11.2.11.3. SWOT Analysis
- 11.2.11.4. Recent Developments
- 11.2.11.5. Financials (Based on Availability)
- 11.2.12 BP Plc
- 11.2.12.1. Overview
- 11.2.12.2. Products
- 11.2.12.3. SWOT Analysis
- 11.2.12.4. Recent Developments
- 11.2.12.5. Financials (Based on Availability)
- 11.2.13 Dacon Inspection Services Co Ltd
- 11.2.13.1. Overview
- 11.2.13.2. Products
- 11.2.13.3. SWOT Analysis
- 11.2.13.4. Recent Developments
- 11.2.13.5. Financials (Based on Availability)
- 11.2.14 Baker Hughes A GE Co
- 11.2.14.1. Overview
- 11.2.14.2. Products
- 11.2.14.3. SWOT Analysis
- 11.2.14.4. Recent Developments
- 11.2.14.5. Financials (Based on Availability)
- 11.2.15 ExxonMobil Corporation
- 11.2.15.1. Overview
- 11.2.15.2. Products
- 11.2.15.3. SWOT Analysis
- 11.2.15.4. Recent Developments
- 11.2.15.5. Financials (Based on Availability)
- 11.2.16 Pipeline Maintenance Services Providers
- 11.2.16.1. Overview
- 11.2.16.2. Products
- 11.2.16.3. SWOT Analysis
- 11.2.16.4. Recent Developments
- 11.2.16.5. Financials (Based on Availability)
- 11.2.1 IKM Gruppen AS
List of Figures
- Figure 1: Global Pipeline Maintenance Service Market Revenue Breakdown (billion, %) by Region 2025 & 2033
- Figure 2: North America Pipeline Maintenance Service Market Revenue (billion), by Service Type 2025 & 2033
- Figure 3: North America Pipeline Maintenance Service Market Revenue Share (%), by Service Type 2025 & 2033
- Figure 4: North America Pipeline Maintenance Service Market Revenue (billion), by Location of Deployment 2025 & 2033
- Figure 5: North America Pipeline Maintenance Service Market Revenue Share (%), by Location of Deployment 2025 & 2033
- Figure 6: North America Pipeline Maintenance Service Market Revenue (billion), by Country 2025 & 2033
- Figure 7: North America Pipeline Maintenance Service Market Revenue Share (%), by Country 2025 & 2033
- Figure 8: Europe Pipeline Maintenance Service Market Revenue (billion), by Service Type 2025 & 2033
- Figure 9: Europe Pipeline Maintenance Service Market Revenue Share (%), by Service Type 2025 & 2033
- Figure 10: Europe Pipeline Maintenance Service Market Revenue (billion), by Location of Deployment 2025 & 2033
- Figure 11: Europe Pipeline Maintenance Service Market Revenue Share (%), by Location of Deployment 2025 & 2033
- Figure 12: Europe Pipeline Maintenance Service Market Revenue (billion), by Country 2025 & 2033
- Figure 13: Europe Pipeline Maintenance Service Market Revenue Share (%), by Country 2025 & 2033
- Figure 14: Asia Pacific Pipeline Maintenance Service Market Revenue (billion), by Service Type 2025 & 2033
- Figure 15: Asia Pacific Pipeline Maintenance Service Market Revenue Share (%), by Service Type 2025 & 2033
- Figure 16: Asia Pacific Pipeline Maintenance Service Market Revenue (billion), by Location of Deployment 2025 & 2033
- Figure 17: Asia Pacific Pipeline Maintenance Service Market Revenue Share (%), by Location of Deployment 2025 & 2033
- Figure 18: Asia Pacific Pipeline Maintenance Service Market Revenue (billion), by Country 2025 & 2033
- Figure 19: Asia Pacific Pipeline Maintenance Service Market Revenue Share (%), by Country 2025 & 2033
- Figure 20: South America Pipeline Maintenance Service Market Revenue (billion), by Service Type 2025 & 2033
- Figure 21: South America Pipeline Maintenance Service Market Revenue Share (%), by Service Type 2025 & 2033
- Figure 22: South America Pipeline Maintenance Service Market Revenue (billion), by Location of Deployment 2025 & 2033
- Figure 23: South America Pipeline Maintenance Service Market Revenue Share (%), by Location of Deployment 2025 & 2033
- Figure 24: South America Pipeline Maintenance Service Market Revenue (billion), by Country 2025 & 2033
- Figure 25: South America Pipeline Maintenance Service Market Revenue Share (%), by Country 2025 & 2033
- Figure 26: Middle East and Africa Pipeline Maintenance Service Market Revenue (billion), by Service Type 2025 & 2033
- Figure 27: Middle East and Africa Pipeline Maintenance Service Market Revenue Share (%), by Service Type 2025 & 2033
- Figure 28: Middle East and Africa Pipeline Maintenance Service Market Revenue (billion), by Location of Deployment 2025 & 2033
- Figure 29: Middle East and Africa Pipeline Maintenance Service Market Revenue Share (%), by Location of Deployment 2025 & 2033
- Figure 30: Middle East and Africa Pipeline Maintenance Service Market Revenue (billion), by Country 2025 & 2033
- Figure 31: Middle East and Africa Pipeline Maintenance Service Market Revenue Share (%), by Country 2025 & 2033
List of Tables
- Table 1: Global Pipeline Maintenance Service Market Revenue billion Forecast, by Service Type 2020 & 2033
- Table 2: Global Pipeline Maintenance Service Market Revenue billion Forecast, by Location of Deployment 2020 & 2033
- Table 3: Global Pipeline Maintenance Service Market Revenue billion Forecast, by Region 2020 & 2033
- Table 4: Global Pipeline Maintenance Service Market Revenue billion Forecast, by Service Type 2020 & 2033
- Table 5: Global Pipeline Maintenance Service Market Revenue billion Forecast, by Location of Deployment 2020 & 2033
- Table 6: Global Pipeline Maintenance Service Market Revenue billion Forecast, by Country 2020 & 2033
- Table 7: Global Pipeline Maintenance Service Market Revenue billion Forecast, by Service Type 2020 & 2033
- Table 8: Global Pipeline Maintenance Service Market Revenue billion Forecast, by Location of Deployment 2020 & 2033
- Table 9: Global Pipeline Maintenance Service Market Revenue billion Forecast, by Country 2020 & 2033
- Table 10: Global Pipeline Maintenance Service Market Revenue billion Forecast, by Service Type 2020 & 2033
- Table 11: Global Pipeline Maintenance Service Market Revenue billion Forecast, by Location of Deployment 2020 & 2033
- Table 12: Global Pipeline Maintenance Service Market Revenue billion Forecast, by Country 2020 & 2033
- Table 13: Global Pipeline Maintenance Service Market Revenue billion Forecast, by Service Type 2020 & 2033
- Table 14: Global Pipeline Maintenance Service Market Revenue billion Forecast, by Location of Deployment 2020 & 2033
- Table 15: Global Pipeline Maintenance Service Market Revenue billion Forecast, by Country 2020 & 2033
- Table 16: Global Pipeline Maintenance Service Market Revenue billion Forecast, by Service Type 2020 & 2033
- Table 17: Global Pipeline Maintenance Service Market Revenue billion Forecast, by Location of Deployment 2020 & 2033
- Table 18: Global Pipeline Maintenance Service Market Revenue billion Forecast, by Country 2020 & 2033
Frequently Asked Questions
1. What is the projected Compound Annual Growth Rate (CAGR) of the Pipeline Maintenance Service Market?
The projected CAGR is approximately 6.6%.
2. Which companies are prominent players in the Pipeline Maintenance Service Market?
Key companies in the market include IKM Gruppen AS, Shell Plc, Kinder Morgan Inc, China National Petroleum Corporation, Intertek Group PLC, T D Williamson Inc, Chevron Corporation, Oil States Industries Inc, EnerMech Ltd, STATS Group, Pipeline Operators, BP Plc, Dacon Inspection Services Co Ltd, Baker Hughes A GE Co, ExxonMobil Corporation, Pipeline Maintenance Services Providers.
3. What are the main segments of the Pipeline Maintenance Service Market?
The market segments include Service Type, Location of Deployment.
4. Can you provide details about the market size?
The market size is estimated to be USD 26.64 billion as of 2022.
5. What are some drivers contributing to market growth?
4.; Increasing Gas Production and Infrastructure4.; Increasing Exploration and Production Activities.
6. What are the notable trends driving market growth?
Pipeline Repair & Maintenance Segment to have a Significant Share in the Market.
7. Are there any restraints impacting market growth?
4.; Increasing Adoption of Clean Power Sources.
8. Can you provide examples of recent developments in the market?
In October 2021, Optilan, a leading telecommunications and security systems integrator, announced completion of the first year of operation on the BTC pipeline project. The company reavelaed that out of the 14 completed projects, six projects were new pipelines, five projects were expansions of existing systems, two projects reversed the direction that the commodity flowed on the pipeline and one project was a change in the commodity carried by the pipeline.
9. What pricing options are available for accessing the report?
Pricing options include single-user, multi-user, and enterprise licenses priced at USD 4750, USD 5250, and USD 8750 respectively.
10. Is the market size provided in terms of value or volume?
The market size is provided in terms of value, measured in billion.
11. Are there any specific market keywords associated with the report?
Yes, the market keyword associated with the report is "Pipeline Maintenance Service Market," which aids in identifying and referencing the specific market segment covered.
12. How do I determine which pricing option suits my needs best?
The pricing options vary based on user requirements and access needs. Individual users may opt for single-user licenses, while businesses requiring broader access may choose multi-user or enterprise licenses for cost-effective access to the report.
13. Are there any additional resources or data provided in the Pipeline Maintenance Service Market report?
While the report offers comprehensive insights, it's advisable to review the specific contents or supplementary materials provided to ascertain if additional resources or data are available.
14. How can I stay updated on further developments or reports in the Pipeline Maintenance Service Market?
To stay informed about further developments, trends, and reports in the Pipeline Maintenance Service Market, consider subscribing to industry newsletters, following relevant companies and organizations, or regularly checking reputable industry news sources and publications.
Methodology
Step 1 - Identification of Relevant Samples Size from Population Database


Step 2 - Approaches for Defining Global Market Size (Value, Volume* & Price*)

Note*: In applicable scenarios
Step 3 - Data Sources
Primary Research
- Web Analytics
- Survey Reports
- Research Institute
- Latest Research Reports
- Opinion Leaders
Secondary Research
- Annual Reports
- White Paper
- Latest Press Release
- Industry Association
- Paid Database
- Investor Presentations

Step 4 - Data Triangulation
Involves using different sources of information in order to increase the validity of a study
These sources are likely to be stakeholders in a program - participants, other researchers, program staff, other community members, and so on.
Then we put all data in single framework & apply various statistical tools to find out the dynamic on the market.
During the analysis stage, feedback from the stakeholder groups would be compared to determine areas of agreement as well as areas of divergence