

Key Insights
The photo printing market, valued at $23.99 billion in 2025, is projected to experience steady growth, driven by several key factors. The increasing popularity of personalized photo products, fueled by social media sharing and a desire for tangible keepsakes, is a significant driver. Technological advancements, such as improved print quality, wider format options, and innovative photo products (e.g., canvases, mugs, phone cases), cater to diverse consumer preferences and boost market expansion. The rising adoption of online photo printing services, offering convenience and accessibility, further contributes to market growth. While the market faces restraints from the prevalence of digital photo storage and the competitive pricing landscape, the continued demand for high-quality prints and personalized gifts ensures sustained market momentum. Major players like Shutterfly, Snapfish, and Vistaprint compete through brand recognition, service offerings, and pricing strategies.
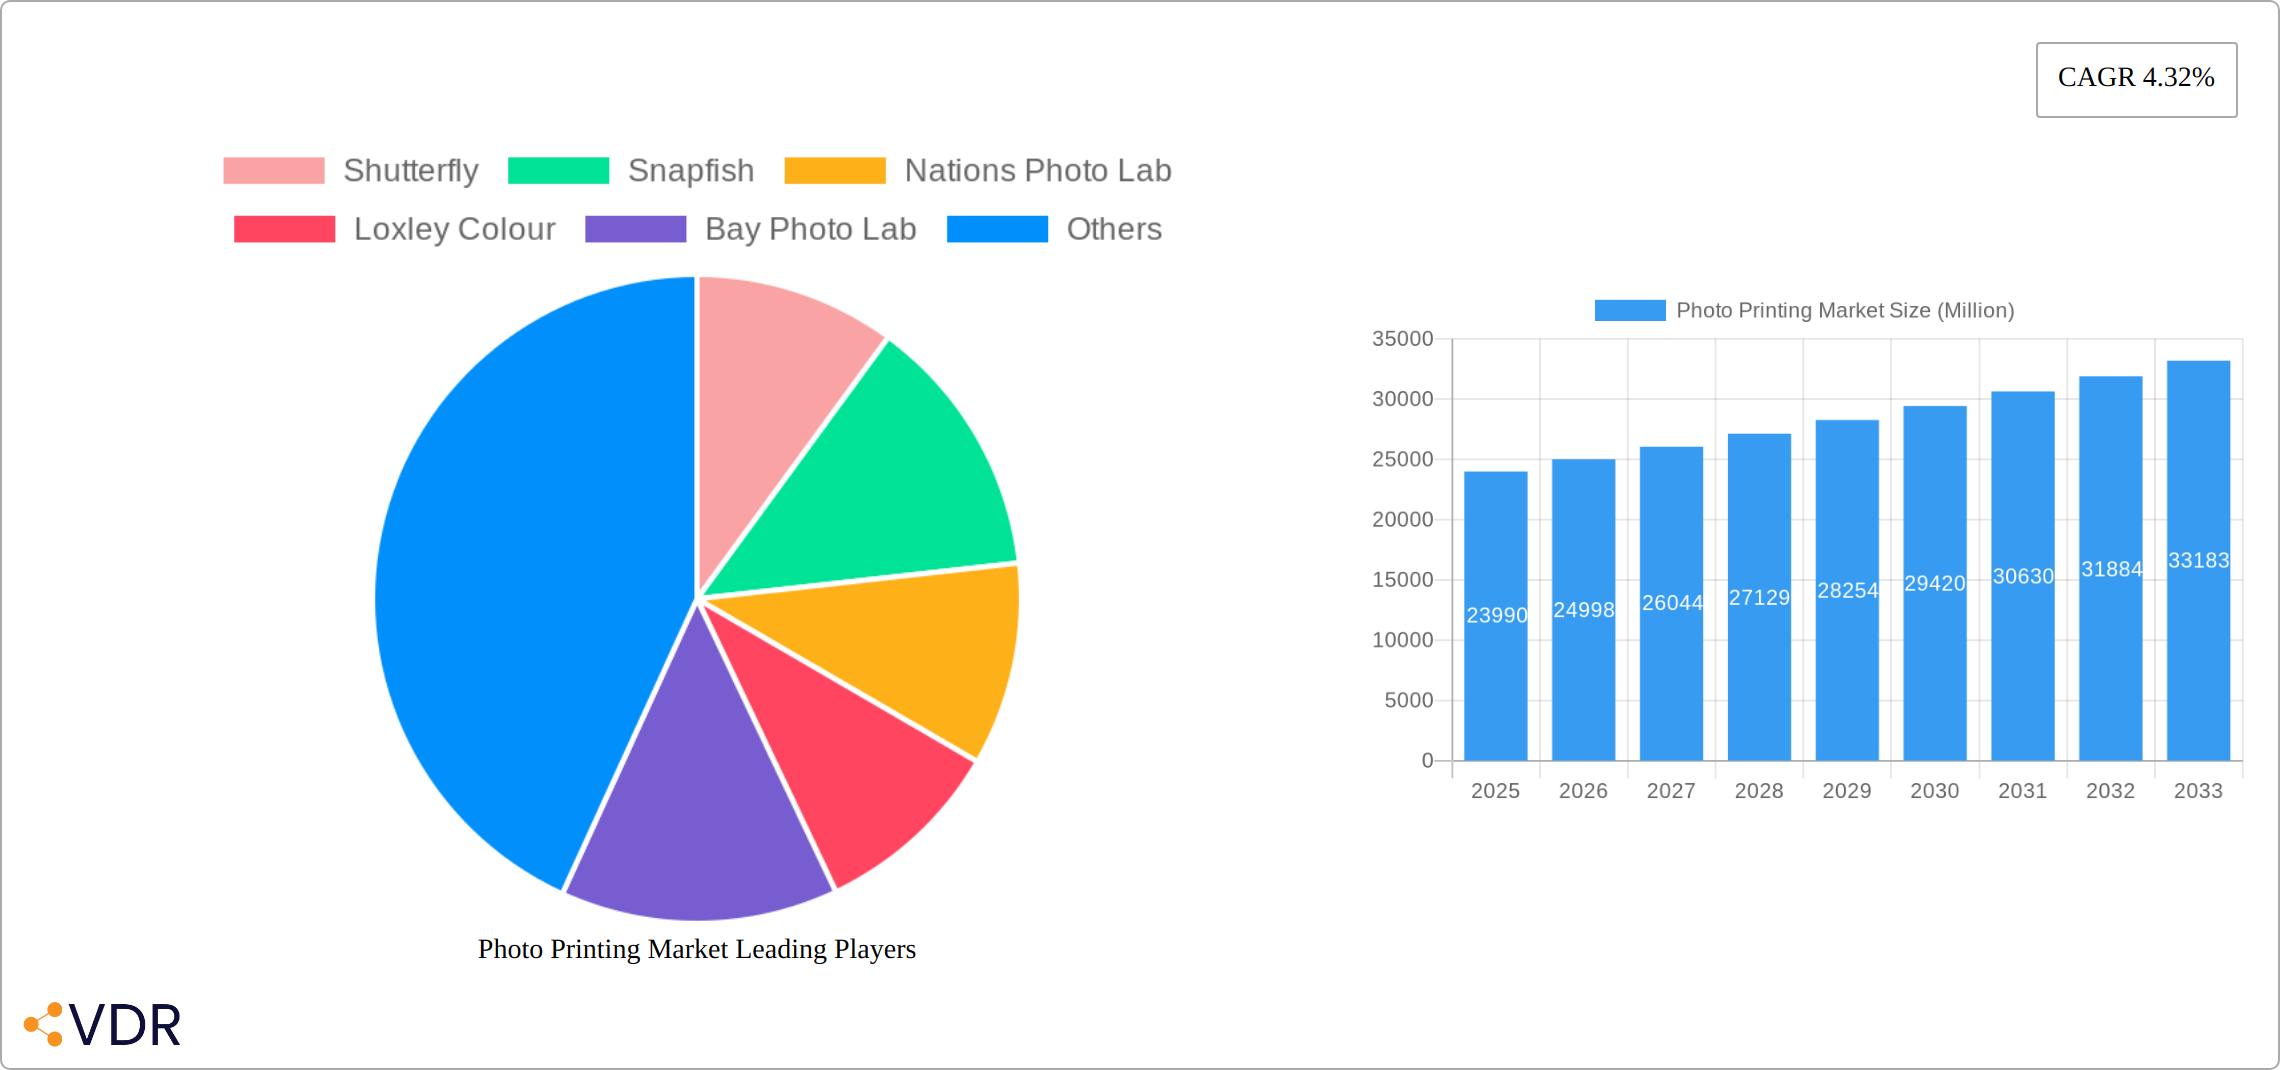
Photo Printing Market Market Size (In Billion)
The projected Compound Annual Growth Rate (CAGR) of 4.32% from 2025 to 2033 indicates a consistent, albeit moderate, expansion. This growth is expected to be influenced by evolving consumer behavior, including increased demand for premium print options and personalized photo gifts. Geographic variations in market growth will likely reflect differences in digital literacy, disposable income levels, and the adoption of online services. The market segmentation, while not explicitly detailed, likely includes various print sizes, product types (photo books, prints, calendars, etc.), and customer segments (individual consumers, businesses, professionals). Continued innovation in printing technology, coupled with strategic marketing and customer engagement, will be crucial for market participants to maintain a competitive edge in this dynamic landscape.
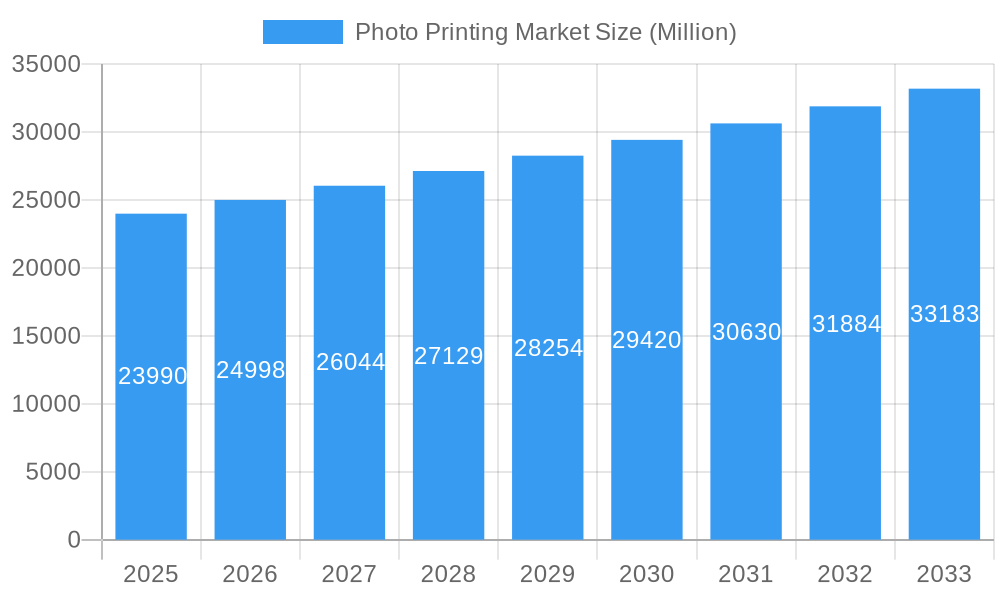
Photo Printing Market Company Market Share
Photo Printing Market: A Comprehensive Market Report (2019-2033)
This comprehensive report provides an in-depth analysis of the Photo Printing Market, covering the period from 2019 to 2033. We delve into market dynamics, growth trends, regional dominance, product landscapes, and key players, offering invaluable insights for industry professionals, investors, and strategic decision-makers. The report utilizes a robust methodology, incorporating both qualitative and quantitative data to provide a complete picture of this dynamic market. The parent market is the broader digital printing market, while the child market focuses specifically on photographic printing services and products. Market values are presented in million units.
Photo Printing Market Market Dynamics & Structure
The photo printing market is characterized by a moderately fragmented structure, featuring a competitive landscape where several key players actively vie for market share. Market concentration is anticipated to experience a slight uptick within the forecast period, primarily driven by ongoing industry consolidation and the formation of strategic partnerships. Technological innovation stands as a paramount driver, with continuous advancements in printing technologies such as high-resolution inkjet and sophisticated dye-sublimation processes, leading to superior image fidelity, accelerated turnaround times, and an expanded spectrum of product offerings. Furthermore, prevailing regulatory frameworks, particularly those pertaining to environmental sustainability and stringent data privacy mandates, significantly influence operational strategies and business practices. The market also navigates the competitive pressure exerted by digital display technologies and the ubiquitous nature of online photo-sharing platforms, which present alternative avenues for image consumption. The end-user demographics are notably diverse, encompassing individual consumers seeking personal mementos, businesses requiring promotional materials, and professional photographers demanding high-quality outputs. Mergers and acquisitions (M&A) activity is projected to remain moderate, with an estimated xx M&A deals anticipated during the forecast period spanning 2025-2033.
- Market Concentration: Moderately fragmented, with the top 5 players estimated to hold approximately xx% of the market share in 2025.
- Technological Innovation: A strong emphasis on achieving enhanced image quality, developing highly personalized products, and accelerating printing speeds to meet evolving consumer demands.
- Regulatory Landscape: An increasing focus on promoting environmentally responsible printing practices and adhering to robust data protection regulations.
- Competitive Substitutes: The pervasive use of digital displays and cloud-based online photo storage services present ongoing challenges and alternative options to traditional photo printing methods.
- End-User Demographics: A broad spectrum of demand is generated by individual consumers, commercial enterprises, and professional photographers, each with distinct printing needs.
- M&A Activity: Moderate levels of M&A activity are expected, with a projected xx deals anticipated to occur throughout the 2025-2033 period.
Photo Printing Market Growth Trends & Insights
The global photo printing market is currently experiencing robust and steady growth, propelled by a confluence of influential factors. While the initial advent of digital photography presented a perceived threat, the enduring demand for tangible photographic products remains strong, significantly fueled by a pervasive sense of nostalgia and the inherent human desire for personalized keepsakes. The market size is projected to reach xx million units by 2025, demonstrating a Compound Annual Growth Rate (CAGR) of xx% during the forecast period (2025-2033). This upward trajectory is further bolstered by increasing disposable incomes observed in emerging economies, coupled with the burgeoning popularity of personalized gift items and home decor solutions that prominently feature printed photographs. Technological advancements, particularly the integration of high-quality mobile printing solutions, are actively contributing to this positive market momentum. Moreover, a notable shift in consumer behavior towards prioritizing experiential purchases and embracing personalized products is proving highly conducive to market expansion.
Dominant Regions, Countries, or Segments in Photo Printing Market
North America is currently the dominant region in the photo printing market, followed by Europe and Asia-Pacific. This dominance is driven by factors such as high disposable incomes, advanced infrastructure, and established market players. The US holds the largest market share within North America, fuelled by high consumer spending and a well-developed e-commerce sector. However, strong growth is anticipated in Asia-Pacific regions due to rising disposable incomes and increasing digital camera usage, especially in rapidly developing economies like India and China.
- North America: High disposable income, strong e-commerce infrastructure, established market players.
- Europe: Significant market presence, increasing demand for personalized photo products.
- Asia-Pacific: Rapid growth potential, driven by increasing disposable incomes and digital adoption.
- Other Regions: Moderate growth, with regional variations impacting market dynamics.
Photo Printing Market Product Landscape
The photo printing market boasts an extensive and diverse array of products designed to cater to a wide range of preferences and applications. This includes a variety of print formats in different sizes and finishes, meticulously crafted photo books, impactful canvas prints, customizable calendars, and a multitude of other personalized photographic items. Recent market innovations are increasingly concentrating on the utilization of premium materials, the adoption of unique printing techniques such as striking metallic prints, and the enhancement of personalization options to offer truly bespoke solutions. This inherent diversity ensures that the market can effectively address distinct customer needs across various price points. Furthermore, emerging technologies, including sophisticated AI-powered photo enhancement tools, are actively shaping and enriching the product offerings available to consumers.
Key Drivers, Barriers & Challenges in Photo Printing Market
Key Drivers: Rising disposable incomes, increasing demand for personalized products, advancements in printing technology, and the growing popularity of online photo printing services.
Challenges & Restraints: Intense competition among various players, the rising popularity of digital photo sharing, environmental concerns related to printing processes, and fluctuations in raw material prices. The increase in raw material prices has created a significant increase in the cost of production, leading to reduced profit margins for companies involved in photo printing. Increased competitive pressure led to a decline in market share for some companies.
Emerging Opportunities in Photo Printing Market
Emerging opportunities lie in expanding into new markets, particularly in developing economies, offering eco-friendly printing options, and focusing on niche applications such as professional photo printing for events and businesses. There’s significant potential in integrating photo printing with other services like personalized home decor items, social media integration, and mobile printing solutions.
Growth Accelerators in the Photo Printing Market Industry
Strategic partnerships, like the one between HP and Canva, are crucial growth accelerators. Technological advancements continue to enhance printing quality, speed, and personalization. Expansion into new markets and the introduction of innovative product offerings further contribute to long-term growth potential.
Key Players Shaping the Photo Printing Market Market
- Shutterfly
- Snapfish
- Nations Photo Lab
- Loxley Colour
- Bay Photo Lab
- WhiteWall
- Mpix
- Vistaprint
- AdoramaPix
- Zazzle
Notable Milestones in Photo Printing Market Sector
- September 2023: Esko and Fiery, LLC solidified a significant technological partnership aimed at enhancing and streamlining packaging and digital print technologies.
- May 2024: HP Inc. strategically partnered with Canva, facilitating the seamless integration of design functionalities with local printing services, thereby expanding its reach to a user base of millions.
In-Depth Photo Printing Market Market Outlook
The photo printing market is strategically positioned for sustained and robust growth in the coming years, a trajectory primarily driven by the relentless pace of technological innovation and the continuous evolution of consumer preferences. Key to shaping the future landscape of this dynamic sector will be the proactive pursuit of strategic partnerships, the strategic expansion into untapped new markets, and the dedicated development of innovative and compelling product offerings. A steadfast commitment to delivering highly personalized experiences and embracing sustainable printing practices will be critically important for achieving enduring success in the upcoming years. The market is projected to witness an impressive growth of xx million units by 2033.
Photo Printing Market Segmentation
-
1. Product Type
- 1.1. Prints
- 1.2. Wall Art
- 1.3. Cards
- 1.4. Photo Gifts
- 1.5. Photo Books
- 1.6. Calendars
- 1.7. Other Product Types
-
2. Type
- 2.1. Film and Offset Printing
- 2.2. Digital Printing
-
3. Distribution Channel
- 3.1. Retail
- 3.2. Online
- 3.3. Instant Kiosk
Photo Printing Market Segmentation By Geography
-
1. North America
- 1.1. United States
- 1.2. Canada
- 1.3. Rest of North America
-
2. Europe
- 2.1. Germany
- 2.2. United Kingdom
- 2.3. France
- 2.4. Russia
- 2.5. Spain
- 2.6. Rest of Europe
-
3. Asia Pacific
- 3.1. India
- 3.2. China
- 3.3. Japan
- 3.4. Rest of Asia Pacific
-
4. South America
- 4.1. Brazil
- 4.2. Argentina
- 4.3. Rest of South America
-
5. Middle East and Africa
- 5.1. United Arab Emirates
- 5.2. Saudi Arabia
- 5.3. Rest of Middle East and Africa
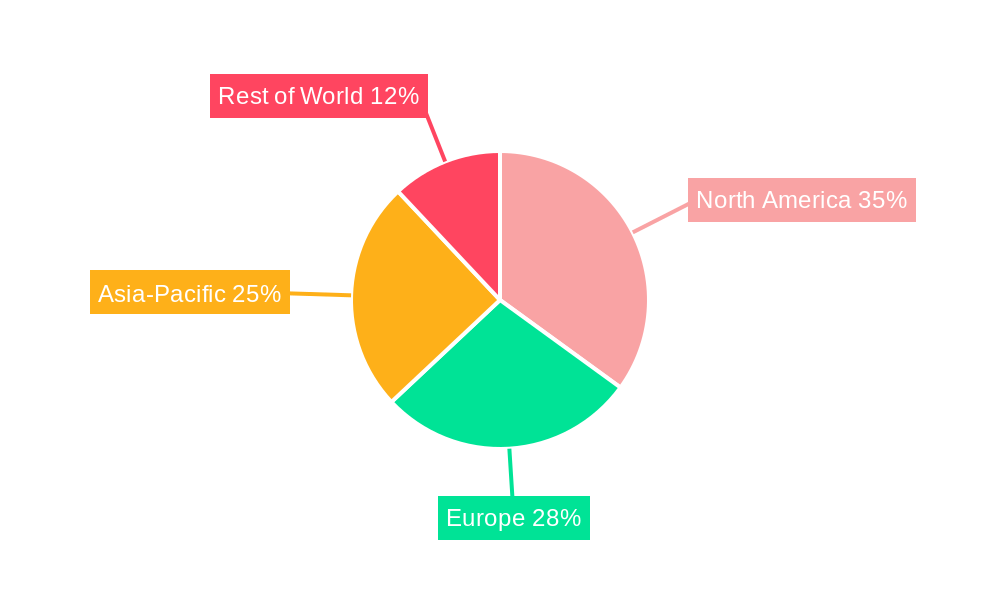
Photo Printing Market Regional Market Share
Geographic Coverage of Photo Printing Market
Photo Printing Market REPORT HIGHLIGHTS
| Aspects | Details |
|---|---|
| Study Period | 2020-2034 |
| Base Year | 2025 |
| Estimated Year | 2026 |
| Forecast Period | 2026-2034 |
| Historical Period | 2020-2025 |
| Growth Rate | CAGR of 4.32% from 2020-2034 |
| Segmentation |
|
Table of Contents
- 1. Introduction
- 1.1. Research Scope
- 1.2. Market Segmentation
- 1.3. Research Objective
- 1.4. Definitions and Assumptions
- 2. Executive Summary
- 2.1. Market Snapshot
- 3. Market Dynamics
- 3.1. Market Drivers
- 3.2. Market Restrains
- 3.3. Market Trends
- 3.4. Market Opportunities
- 4. Market Factor Analysis
- 4.1. Porters Five Forces
- 4.1.1. Bargaining Power of Suppliers
- 4.1.2. Bargaining Power of Buyers
- 4.1.3. Threat of New Entrants
- 4.1.4. Threat of Substitutes
- 4.1.5. Competitive Rivalry
- 4.2. PESTEL analysis
- 4.3. BCG Analysis
- 4.3.1. Stars (High Growth, High Market Share)
- 4.3.2. Cash Cows (Low Growth, High Market Share)
- 4.3.3. Question Mark (High Growth, Low Market Share)
- 4.3.4. Dogs (Low Growth, Low Market Share)
- 4.4. Ansoff Matrix Analysis
- 4.5. Supply Chain Analysis
- 4.6. Regulatory Landscape
- 4.7. Current Market Potential and Opportunity Assessment (TAM–SAM–SOM Framework)
- 4.8. VDR Analyst Note
- 4.1. Porters Five Forces
- 5. Market Analysis, Insights and Forecast 2021-2033
- 5.1. Market Analysis, Insights and Forecast - by Product Type
- 5.1.1. Prints
- 5.1.2. Wall Art
- 5.1.3. Cards
- 5.1.4. Photo Gifts
- 5.1.5. Photo Books
- 5.1.6. Calendars
- 5.1.7. Other Product Types
- 5.2. Market Analysis, Insights and Forecast - by Type
- 5.2.1. Film and Offset Printing
- 5.2.2. Digital Printing
- 5.3. Market Analysis, Insights and Forecast - by Distribution Channel
- 5.3.1. Retail
- 5.3.2. Online
- 5.3.3. Instant Kiosk
- 5.4. Market Analysis, Insights and Forecast - by Region
- 5.4.1. North America
- 5.4.2. Europe
- 5.4.3. Asia Pacific
- 5.4.4. South America
- 5.4.5. Middle East and Africa
- 5.1. Market Analysis, Insights and Forecast - by Product Type
- 6. Global Photo Printing Market Analysis, Insights and Forecast, 2021-2033
- 6.1. Market Analysis, Insights and Forecast - by Product Type
- 6.1.1. Prints
- 6.1.2. Wall Art
- 6.1.3. Cards
- 6.1.4. Photo Gifts
- 6.1.5. Photo Books
- 6.1.6. Calendars
- 6.1.7. Other Product Types
- 6.2. Market Analysis, Insights and Forecast - by Type
- 6.2.1. Film and Offset Printing
- 6.2.2. Digital Printing
- 6.3. Market Analysis, Insights and Forecast - by Distribution Channel
- 6.3.1. Retail
- 6.3.2. Online
- 6.3.3. Instant Kiosk
- 6.1. Market Analysis, Insights and Forecast - by Product Type
- 7. North America Photo Printing Market Analysis, Insights and Forecast, 2021-2033
- 7.1. Market Analysis, Insights and Forecast - by Product Type
- 7.1.1. Prints
- 7.1.2. Wall Art
- 7.1.3. Cards
- 7.1.4. Photo Gifts
- 7.1.5. Photo Books
- 7.1.6. Calendars
- 7.1.7. Other Product Types
- 7.2. Market Analysis, Insights and Forecast - by Type
- 7.2.1. Film and Offset Printing
- 7.2.2. Digital Printing
- 7.3. Market Analysis, Insights and Forecast - by Distribution Channel
- 7.3.1. Retail
- 7.3.2. Online
- 7.3.3. Instant Kiosk
- 7.1. Market Analysis, Insights and Forecast - by Product Type
- 8. Europe Photo Printing Market Analysis, Insights and Forecast, 2021-2033
- 8.1. Market Analysis, Insights and Forecast - by Product Type
- 8.1.1. Prints
- 8.1.2. Wall Art
- 8.1.3. Cards
- 8.1.4. Photo Gifts
- 8.1.5. Photo Books
- 8.1.6. Calendars
- 8.1.7. Other Product Types
- 8.2. Market Analysis, Insights and Forecast - by Type
- 8.2.1. Film and Offset Printing
- 8.2.2. Digital Printing
- 8.3. Market Analysis, Insights and Forecast - by Distribution Channel
- 8.3.1. Retail
- 8.3.2. Online
- 8.3.3. Instant Kiosk
- 8.1. Market Analysis, Insights and Forecast - by Product Type
- 9. Asia Pacific Photo Printing Market Analysis, Insights and Forecast, 2021-2033
- 9.1. Market Analysis, Insights and Forecast - by Product Type
- 9.1.1. Prints
- 9.1.2. Wall Art
- 9.1.3. Cards
- 9.1.4. Photo Gifts
- 9.1.5. Photo Books
- 9.1.6. Calendars
- 9.1.7. Other Product Types
- 9.2. Market Analysis, Insights and Forecast - by Type
- 9.2.1. Film and Offset Printing
- 9.2.2. Digital Printing
- 9.3. Market Analysis, Insights and Forecast - by Distribution Channel
- 9.3.1. Retail
- 9.3.2. Online
- 9.3.3. Instant Kiosk
- 9.1. Market Analysis, Insights and Forecast - by Product Type
- 10. South America Photo Printing Market Analysis, Insights and Forecast, 2021-2033
- 10.1. Market Analysis, Insights and Forecast - by Product Type
- 10.1.1. Prints
- 10.1.2. Wall Art
- 10.1.3. Cards
- 10.1.4. Photo Gifts
- 10.1.5. Photo Books
- 10.1.6. Calendars
- 10.1.7. Other Product Types
- 10.2. Market Analysis, Insights and Forecast - by Type
- 10.2.1. Film and Offset Printing
- 10.2.2. Digital Printing
- 10.3. Market Analysis, Insights and Forecast - by Distribution Channel
- 10.3.1. Retail
- 10.3.2. Online
- 10.3.3. Instant Kiosk
- 10.1. Market Analysis, Insights and Forecast - by Product Type
- 11. Middle East and Africa Photo Printing Market Analysis, Insights and Forecast, 2021-2033
- 11.1. Market Analysis, Insights and Forecast - by Product Type
- 11.1.1. Prints
- 11.1.2. Wall Art
- 11.1.3. Cards
- 11.1.4. Photo Gifts
- 11.1.5. Photo Books
- 11.1.6. Calendars
- 11.1.7. Other Product Types
- 11.2. Market Analysis, Insights and Forecast - by Type
- 11.2.1. Film and Offset Printing
- 11.2.2. Digital Printing
- 11.3. Market Analysis, Insights and Forecast - by Distribution Channel
- 11.3.1. Retail
- 11.3.2. Online
- 11.3.3. Instant Kiosk
- 11.1. Market Analysis, Insights and Forecast - by Product Type
- 12. Competitive Analysis
- 12.1. Company Profiles
- 12.1.1 Shutterfly
- 12.1.1.1. Company Overview
- 12.1.1.2. Products
- 12.1.1.3. Company Financials
- 12.1.1.4. SWOT Analysis
- 12.1.2 Snapfish
- 12.1.2.1. Company Overview
- 12.1.2.2. Products
- 12.1.2.3. Company Financials
- 12.1.2.4. SWOT Analysis
- 12.1.3 Nations Photo Lab
- 12.1.3.1. Company Overview
- 12.1.3.2. Products
- 12.1.3.3. Company Financials
- 12.1.3.4. SWOT Analysis
- 12.1.4 Loxley Colour
- 12.1.4.1. Company Overview
- 12.1.4.2. Products
- 12.1.4.3. Company Financials
- 12.1.4.4. SWOT Analysis
- 12.1.5 Bay Photo Lab
- 12.1.5.1. Company Overview
- 12.1.5.2. Products
- 12.1.5.3. Company Financials
- 12.1.5.4. SWOT Analysis
- 12.1.6 WhiteWall
- 12.1.6.1. Company Overview
- 12.1.6.2. Products
- 12.1.6.3. Company Financials
- 12.1.6.4. SWOT Analysis
- 12.1.7 Mpix
- 12.1.7.1. Company Overview
- 12.1.7.2. Products
- 12.1.7.3. Company Financials
- 12.1.7.4. SWOT Analysis
- 12.1.8 Vistaprint
- 12.1.8.1. Company Overview
- 12.1.8.2. Products
- 12.1.8.3. Company Financials
- 12.1.8.4. SWOT Analysis
- 12.1.9 AdoramaPix
- 12.1.9.1. Company Overview
- 12.1.9.2. Products
- 12.1.9.3. Company Financials
- 12.1.9.4. SWOT Analysis
- 12.1.10 Zazzle**List Not Exhaustive
- 12.1.10.1. Company Overview
- 12.1.10.2. Products
- 12.1.10.3. Company Financials
- 12.1.10.4. SWOT Analysis
- 12.1.1 Shutterfly
- 12.2. Market Entropy
- 12.2.1 Company's Key Areas Served
- 12.2.2 Recent Developments
- 12.3. Company Market Share Analysis 2025
- 12.3.1 Top 5 Companies Market Share Analysis
- 12.3.2 Top 3 Companies Market Share Analysis
- 12.4. List of Potential Customers
- 13. Research Methodology
List of Figures
- Figure 1: Global Photo Printing Market Revenue Breakdown (Million, %) by Region 2025 & 2033
- Figure 2: Global Photo Printing Market Volume Breakdown (Billion, %) by Region 2025 & 2033
- Figure 3: North America Photo Printing Market Revenue (Million), by Product Type 2025 & 2033
- Figure 4: North America Photo Printing Market Volume (Billion), by Product Type 2025 & 2033
- Figure 5: North America Photo Printing Market Revenue Share (%), by Product Type 2025 & 2033
- Figure 6: North America Photo Printing Market Volume Share (%), by Product Type 2025 & 2033
- Figure 7: North America Photo Printing Market Revenue (Million), by Type 2025 & 2033
- Figure 8: North America Photo Printing Market Volume (Billion), by Type 2025 & 2033
- Figure 9: North America Photo Printing Market Revenue Share (%), by Type 2025 & 2033
- Figure 10: North America Photo Printing Market Volume Share (%), by Type 2025 & 2033
- Figure 11: North America Photo Printing Market Revenue (Million), by Distribution Channel 2025 & 2033
- Figure 12: North America Photo Printing Market Volume (Billion), by Distribution Channel 2025 & 2033
- Figure 13: North America Photo Printing Market Revenue Share (%), by Distribution Channel 2025 & 2033
- Figure 14: North America Photo Printing Market Volume Share (%), by Distribution Channel 2025 & 2033
- Figure 15: North America Photo Printing Market Revenue (Million), by Country 2025 & 2033
- Figure 16: North America Photo Printing Market Volume (Billion), by Country 2025 & 2033
- Figure 17: North America Photo Printing Market Revenue Share (%), by Country 2025 & 2033
- Figure 18: North America Photo Printing Market Volume Share (%), by Country 2025 & 2033
- Figure 19: Europe Photo Printing Market Revenue (Million), by Product Type 2025 & 2033
- Figure 20: Europe Photo Printing Market Volume (Billion), by Product Type 2025 & 2033
- Figure 21: Europe Photo Printing Market Revenue Share (%), by Product Type 2025 & 2033
- Figure 22: Europe Photo Printing Market Volume Share (%), by Product Type 2025 & 2033
- Figure 23: Europe Photo Printing Market Revenue (Million), by Type 2025 & 2033
- Figure 24: Europe Photo Printing Market Volume (Billion), by Type 2025 & 2033
- Figure 25: Europe Photo Printing Market Revenue Share (%), by Type 2025 & 2033
- Figure 26: Europe Photo Printing Market Volume Share (%), by Type 2025 & 2033
- Figure 27: Europe Photo Printing Market Revenue (Million), by Distribution Channel 2025 & 2033
- Figure 28: Europe Photo Printing Market Volume (Billion), by Distribution Channel 2025 & 2033
- Figure 29: Europe Photo Printing Market Revenue Share (%), by Distribution Channel 2025 & 2033
- Figure 30: Europe Photo Printing Market Volume Share (%), by Distribution Channel 2025 & 2033
- Figure 31: Europe Photo Printing Market Revenue (Million), by Country 2025 & 2033
- Figure 32: Europe Photo Printing Market Volume (Billion), by Country 2025 & 2033
- Figure 33: Europe Photo Printing Market Revenue Share (%), by Country 2025 & 2033
- Figure 34: Europe Photo Printing Market Volume Share (%), by Country 2025 & 2033
- Figure 35: Asia Pacific Photo Printing Market Revenue (Million), by Product Type 2025 & 2033
- Figure 36: Asia Pacific Photo Printing Market Volume (Billion), by Product Type 2025 & 2033
- Figure 37: Asia Pacific Photo Printing Market Revenue Share (%), by Product Type 2025 & 2033
- Figure 38: Asia Pacific Photo Printing Market Volume Share (%), by Product Type 2025 & 2033
- Figure 39: Asia Pacific Photo Printing Market Revenue (Million), by Type 2025 & 2033
- Figure 40: Asia Pacific Photo Printing Market Volume (Billion), by Type 2025 & 2033
- Figure 41: Asia Pacific Photo Printing Market Revenue Share (%), by Type 2025 & 2033
- Figure 42: Asia Pacific Photo Printing Market Volume Share (%), by Type 2025 & 2033
- Figure 43: Asia Pacific Photo Printing Market Revenue (Million), by Distribution Channel 2025 & 2033
- Figure 44: Asia Pacific Photo Printing Market Volume (Billion), by Distribution Channel 2025 & 2033
- Figure 45: Asia Pacific Photo Printing Market Revenue Share (%), by Distribution Channel 2025 & 2033
- Figure 46: Asia Pacific Photo Printing Market Volume Share (%), by Distribution Channel 2025 & 2033
- Figure 47: Asia Pacific Photo Printing Market Revenue (Million), by Country 2025 & 2033
- Figure 48: Asia Pacific Photo Printing Market Volume (Billion), by Country 2025 & 2033
- Figure 49: Asia Pacific Photo Printing Market Revenue Share (%), by Country 2025 & 2033
- Figure 50: Asia Pacific Photo Printing Market Volume Share (%), by Country 2025 & 2033
- Figure 51: South America Photo Printing Market Revenue (Million), by Product Type 2025 & 2033
- Figure 52: South America Photo Printing Market Volume (Billion), by Product Type 2025 & 2033
- Figure 53: South America Photo Printing Market Revenue Share (%), by Product Type 2025 & 2033
- Figure 54: South America Photo Printing Market Volume Share (%), by Product Type 2025 & 2033
- Figure 55: South America Photo Printing Market Revenue (Million), by Type 2025 & 2033
- Figure 56: South America Photo Printing Market Volume (Billion), by Type 2025 & 2033
- Figure 57: South America Photo Printing Market Revenue Share (%), by Type 2025 & 2033
- Figure 58: South America Photo Printing Market Volume Share (%), by Type 2025 & 2033
- Figure 59: South America Photo Printing Market Revenue (Million), by Distribution Channel 2025 & 2033
- Figure 60: South America Photo Printing Market Volume (Billion), by Distribution Channel 2025 & 2033
- Figure 61: South America Photo Printing Market Revenue Share (%), by Distribution Channel 2025 & 2033
- Figure 62: South America Photo Printing Market Volume Share (%), by Distribution Channel 2025 & 2033
- Figure 63: South America Photo Printing Market Revenue (Million), by Country 2025 & 2033
- Figure 64: South America Photo Printing Market Volume (Billion), by Country 2025 & 2033
- Figure 65: South America Photo Printing Market Revenue Share (%), by Country 2025 & 2033
- Figure 66: South America Photo Printing Market Volume Share (%), by Country 2025 & 2033
- Figure 67: Middle East and Africa Photo Printing Market Revenue (Million), by Product Type 2025 & 2033
- Figure 68: Middle East and Africa Photo Printing Market Volume (Billion), by Product Type 2025 & 2033
- Figure 69: Middle East and Africa Photo Printing Market Revenue Share (%), by Product Type 2025 & 2033
- Figure 70: Middle East and Africa Photo Printing Market Volume Share (%), by Product Type 2025 & 2033
- Figure 71: Middle East and Africa Photo Printing Market Revenue (Million), by Type 2025 & 2033
- Figure 72: Middle East and Africa Photo Printing Market Volume (Billion), by Type 2025 & 2033
- Figure 73: Middle East and Africa Photo Printing Market Revenue Share (%), by Type 2025 & 2033
- Figure 74: Middle East and Africa Photo Printing Market Volume Share (%), by Type 2025 & 2033
- Figure 75: Middle East and Africa Photo Printing Market Revenue (Million), by Distribution Channel 2025 & 2033
- Figure 76: Middle East and Africa Photo Printing Market Volume (Billion), by Distribution Channel 2025 & 2033
- Figure 77: Middle East and Africa Photo Printing Market Revenue Share (%), by Distribution Channel 2025 & 2033
- Figure 78: Middle East and Africa Photo Printing Market Volume Share (%), by Distribution Channel 2025 & 2033
- Figure 79: Middle East and Africa Photo Printing Market Revenue (Million), by Country 2025 & 2033
- Figure 80: Middle East and Africa Photo Printing Market Volume (Billion), by Country 2025 & 2033
- Figure 81: Middle East and Africa Photo Printing Market Revenue Share (%), by Country 2025 & 2033
- Figure 82: Middle East and Africa Photo Printing Market Volume Share (%), by Country 2025 & 2033
List of Tables
- Table 1: Global Photo Printing Market Revenue Million Forecast, by Product Type 2020 & 2033
- Table 2: Global Photo Printing Market Volume Billion Forecast, by Product Type 2020 & 2033
- Table 3: Global Photo Printing Market Revenue Million Forecast, by Type 2020 & 2033
- Table 4: Global Photo Printing Market Volume Billion Forecast, by Type 2020 & 2033
- Table 5: Global Photo Printing Market Revenue Million Forecast, by Distribution Channel 2020 & 2033
- Table 6: Global Photo Printing Market Volume Billion Forecast, by Distribution Channel 2020 & 2033
- Table 7: Global Photo Printing Market Revenue Million Forecast, by Region 2020 & 2033
- Table 8: Global Photo Printing Market Volume Billion Forecast, by Region 2020 & 2033
- Table 9: Global Photo Printing Market Revenue Million Forecast, by Product Type 2020 & 2033
- Table 10: Global Photo Printing Market Volume Billion Forecast, by Product Type 2020 & 2033
- Table 11: Global Photo Printing Market Revenue Million Forecast, by Type 2020 & 2033
- Table 12: Global Photo Printing Market Volume Billion Forecast, by Type 2020 & 2033
- Table 13: Global Photo Printing Market Revenue Million Forecast, by Distribution Channel 2020 & 2033
- Table 14: Global Photo Printing Market Volume Billion Forecast, by Distribution Channel 2020 & 2033
- Table 15: Global Photo Printing Market Revenue Million Forecast, by Country 2020 & 2033
- Table 16: Global Photo Printing Market Volume Billion Forecast, by Country 2020 & 2033
- Table 17: United States Photo Printing Market Revenue (Million) Forecast, by Application 2020 & 2033
- Table 18: United States Photo Printing Market Volume (Billion) Forecast, by Application 2020 & 2033
- Table 19: Canada Photo Printing Market Revenue (Million) Forecast, by Application 2020 & 2033
- Table 20: Canada Photo Printing Market Volume (Billion) Forecast, by Application 2020 & 2033
- Table 21: Rest of North America Photo Printing Market Revenue (Million) Forecast, by Application 2020 & 2033
- Table 22: Rest of North America Photo Printing Market Volume (Billion) Forecast, by Application 2020 & 2033
- Table 23: Global Photo Printing Market Revenue Million Forecast, by Product Type 2020 & 2033
- Table 24: Global Photo Printing Market Volume Billion Forecast, by Product Type 2020 & 2033
- Table 25: Global Photo Printing Market Revenue Million Forecast, by Type 2020 & 2033
- Table 26: Global Photo Printing Market Volume Billion Forecast, by Type 2020 & 2033
- Table 27: Global Photo Printing Market Revenue Million Forecast, by Distribution Channel 2020 & 2033
- Table 28: Global Photo Printing Market Volume Billion Forecast, by Distribution Channel 2020 & 2033
- Table 29: Global Photo Printing Market Revenue Million Forecast, by Country 2020 & 2033
- Table 30: Global Photo Printing Market Volume Billion Forecast, by Country 2020 & 2033
- Table 31: Germany Photo Printing Market Revenue (Million) Forecast, by Application 2020 & 2033
- Table 32: Germany Photo Printing Market Volume (Billion) Forecast, by Application 2020 & 2033
- Table 33: United Kingdom Photo Printing Market Revenue (Million) Forecast, by Application 2020 & 2033
- Table 34: United Kingdom Photo Printing Market Volume (Billion) Forecast, by Application 2020 & 2033
- Table 35: France Photo Printing Market Revenue (Million) Forecast, by Application 2020 & 2033
- Table 36: France Photo Printing Market Volume (Billion) Forecast, by Application 2020 & 2033
- Table 37: Russia Photo Printing Market Revenue (Million) Forecast, by Application 2020 & 2033
- Table 38: Russia Photo Printing Market Volume (Billion) Forecast, by Application 2020 & 2033
- Table 39: Spain Photo Printing Market Revenue (Million) Forecast, by Application 2020 & 2033
- Table 40: Spain Photo Printing Market Volume (Billion) Forecast, by Application 2020 & 2033
- Table 41: Rest of Europe Photo Printing Market Revenue (Million) Forecast, by Application 2020 & 2033
- Table 42: Rest of Europe Photo Printing Market Volume (Billion) Forecast, by Application 2020 & 2033
- Table 43: Global Photo Printing Market Revenue Million Forecast, by Product Type 2020 & 2033
- Table 44: Global Photo Printing Market Volume Billion Forecast, by Product Type 2020 & 2033
- Table 45: Global Photo Printing Market Revenue Million Forecast, by Type 2020 & 2033
- Table 46: Global Photo Printing Market Volume Billion Forecast, by Type 2020 & 2033
- Table 47: Global Photo Printing Market Revenue Million Forecast, by Distribution Channel 2020 & 2033
- Table 48: Global Photo Printing Market Volume Billion Forecast, by Distribution Channel 2020 & 2033
- Table 49: Global Photo Printing Market Revenue Million Forecast, by Country 2020 & 2033
- Table 50: Global Photo Printing Market Volume Billion Forecast, by Country 2020 & 2033
- Table 51: India Photo Printing Market Revenue (Million) Forecast, by Application 2020 & 2033
- Table 52: India Photo Printing Market Volume (Billion) Forecast, by Application 2020 & 2033
- Table 53: China Photo Printing Market Revenue (Million) Forecast, by Application 2020 & 2033
- Table 54: China Photo Printing Market Volume (Billion) Forecast, by Application 2020 & 2033
- Table 55: Japan Photo Printing Market Revenue (Million) Forecast, by Application 2020 & 2033
- Table 56: Japan Photo Printing Market Volume (Billion) Forecast, by Application 2020 & 2033
- Table 57: Rest of Asia Pacific Photo Printing Market Revenue (Million) Forecast, by Application 2020 & 2033
- Table 58: Rest of Asia Pacific Photo Printing Market Volume (Billion) Forecast, by Application 2020 & 2033
- Table 59: Global Photo Printing Market Revenue Million Forecast, by Product Type 2020 & 2033
- Table 60: Global Photo Printing Market Volume Billion Forecast, by Product Type 2020 & 2033
- Table 61: Global Photo Printing Market Revenue Million Forecast, by Type 2020 & 2033
- Table 62: Global Photo Printing Market Volume Billion Forecast, by Type 2020 & 2033
- Table 63: Global Photo Printing Market Revenue Million Forecast, by Distribution Channel 2020 & 2033
- Table 64: Global Photo Printing Market Volume Billion Forecast, by Distribution Channel 2020 & 2033
- Table 65: Global Photo Printing Market Revenue Million Forecast, by Country 2020 & 2033
- Table 66: Global Photo Printing Market Volume Billion Forecast, by Country 2020 & 2033
- Table 67: Brazil Photo Printing Market Revenue (Million) Forecast, by Application 2020 & 2033
- Table 68: Brazil Photo Printing Market Volume (Billion) Forecast, by Application 2020 & 2033
- Table 69: Argentina Photo Printing Market Revenue (Million) Forecast, by Application 2020 & 2033
- Table 70: Argentina Photo Printing Market Volume (Billion) Forecast, by Application 2020 & 2033
- Table 71: Rest of South America Photo Printing Market Revenue (Million) Forecast, by Application 2020 & 2033
- Table 72: Rest of South America Photo Printing Market Volume (Billion) Forecast, by Application 2020 & 2033
- Table 73: Global Photo Printing Market Revenue Million Forecast, by Product Type 2020 & 2033
- Table 74: Global Photo Printing Market Volume Billion Forecast, by Product Type 2020 & 2033
- Table 75: Global Photo Printing Market Revenue Million Forecast, by Type 2020 & 2033
- Table 76: Global Photo Printing Market Volume Billion Forecast, by Type 2020 & 2033
- Table 77: Global Photo Printing Market Revenue Million Forecast, by Distribution Channel 2020 & 2033
- Table 78: Global Photo Printing Market Volume Billion Forecast, by Distribution Channel 2020 & 2033
- Table 79: Global Photo Printing Market Revenue Million Forecast, by Country 2020 & 2033
- Table 80: Global Photo Printing Market Volume Billion Forecast, by Country 2020 & 2033
- Table 81: United Arab Emirates Photo Printing Market Revenue (Million) Forecast, by Application 2020 & 2033
- Table 82: United Arab Emirates Photo Printing Market Volume (Billion) Forecast, by Application 2020 & 2033
- Table 83: Saudi Arabia Photo Printing Market Revenue (Million) Forecast, by Application 2020 & 2033
- Table 84: Saudi Arabia Photo Printing Market Volume (Billion) Forecast, by Application 2020 & 2033
- Table 85: Rest of Middle East and Africa Photo Printing Market Revenue (Million) Forecast, by Application 2020 & 2033
- Table 86: Rest of Middle East and Africa Photo Printing Market Volume (Billion) Forecast, by Application 2020 & 2033
Frequently Asked Questions
1. What is the projected Compound Annual Growth Rate (CAGR) of the Photo Printing Market?
The projected CAGR is approximately 4.32%.
2. Which companies are prominent players in the Photo Printing Market?
Key companies in the market include Shutterfly, Snapfish, Nations Photo Lab, Loxley Colour, Bay Photo Lab, WhiteWall, Mpix, Vistaprint, AdoramaPix, Zazzle**List Not Exhaustive.
3. What are the main segments of the Photo Printing Market?
The market segments include Product Type, Type, Distribution Channel.
4. Can you provide details about the market size?
The market size is estimated to be USD 23.99 Million as of 2022.
5. What are some drivers contributing to market growth?
Increasing Smartphone Adoption is Driving the Market.
6. What are the notable trends driving market growth?
Growth in E-commerce Sector is Fueling the Photo Printing Market.
7. Are there any restraints impacting market growth?
Increasing Smartphone Adoption is Driving the Market.
8. Can you provide examples of recent developments in the market?
May 2024: HP Inc. (NYSE: HPQ) unveiled a strategic, multi-year global partnership with Canva, positioning itself as the world's sole comprehensive visual communication platform. The collaboration aims to equip millions of Canva users globally with the ability to effortlessly craft online designs, generate visual content, and facilitate local printing.September 2023: A new technological partnership was formed between Esko and Fiery, LLC, which aims to provide cutting-edge solutions that improve packaging procedures and digital print technologies.
9. What pricing options are available for accessing the report?
Pricing options include single-user, multi-user, and enterprise licenses priced at USD 4750, USD 5250, and USD 8750 respectively.
10. Is the market size provided in terms of value or volume?
The market size is provided in terms of value, measured in Million and volume, measured in Billion.
11. Are there any specific market keywords associated with the report?
Yes, the market keyword associated with the report is "Photo Printing Market," which aids in identifying and referencing the specific market segment covered.
12. How do I determine which pricing option suits my needs best?
The pricing options vary based on user requirements and access needs. Individual users may opt for single-user licenses, while businesses requiring broader access may choose multi-user or enterprise licenses for cost-effective access to the report.
13. Are there any additional resources or data provided in the Photo Printing Market report?
While the report offers comprehensive insights, it's advisable to review the specific contents or supplementary materials provided to ascertain if additional resources or data are available.
14. How can I stay updated on further developments or reports in the Photo Printing Market?
To stay informed about further developments, trends, and reports in the Photo Printing Market, consider subscribing to industry newsletters, following relevant companies and organizations, or regularly checking reputable industry news sources and publications.
Methodology
Step 1 - Identification of Relevant Samples Size from Population Database


Step 2 - Approaches for Defining Global Market Size (Value, Volume* & Price*)

Note*: In applicable scenarios
Step 3 - Data Sources
Primary Research
- Web Analytics
- Survey Reports
- Research Institute
- Latest Research Reports
- Opinion Leaders
Secondary Research
- Annual Reports
- White Paper
- Latest Press Release
- Industry Association
- Paid Database
- Investor Presentations

Step 4 - Data Triangulation
Involves using different sources of information in order to increase the validity of a study
These sources are likely to be stakeholders in a program - participants, other researchers, program staff, other community members, and so on.
Then we put all data in single framework & apply various statistical tools to find out the dynamic on the market.
During the analysis stage, feedback from the stakeholder groups would be compared to determine areas of agreement as well as areas of divergence