

Key Insights
The Phase Change Materials (PCM) market is poised for significant expansion, driven by escalating demand across multiple industries. Projections indicate a robust compound annual growth rate (CAGR) of 17.58%. This surge is primarily attributed to the growing need for energy-efficient solutions in building and construction, advancements in temperature-controlled packaging, and the critical thermal management requirements of the electronics sector. Furthermore, the integration of PCMs in textiles for enhanced comfort and in transportation for improved fuel efficiency are key growth drivers. Organic PCMs are increasingly favored for their eco-friendly attributes, while micro-encapsulation technologies offer superior handling and application flexibility.
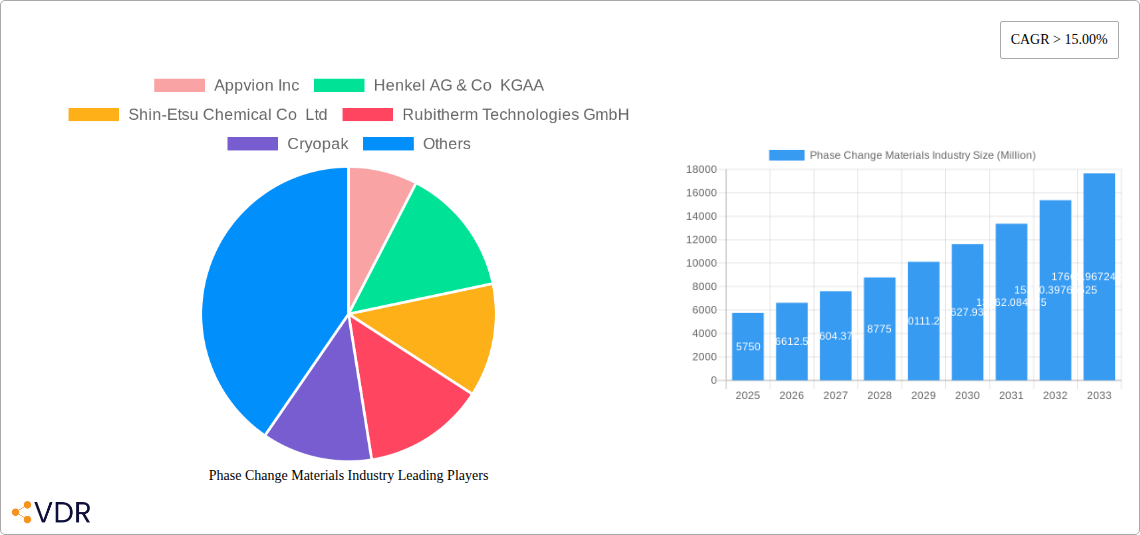
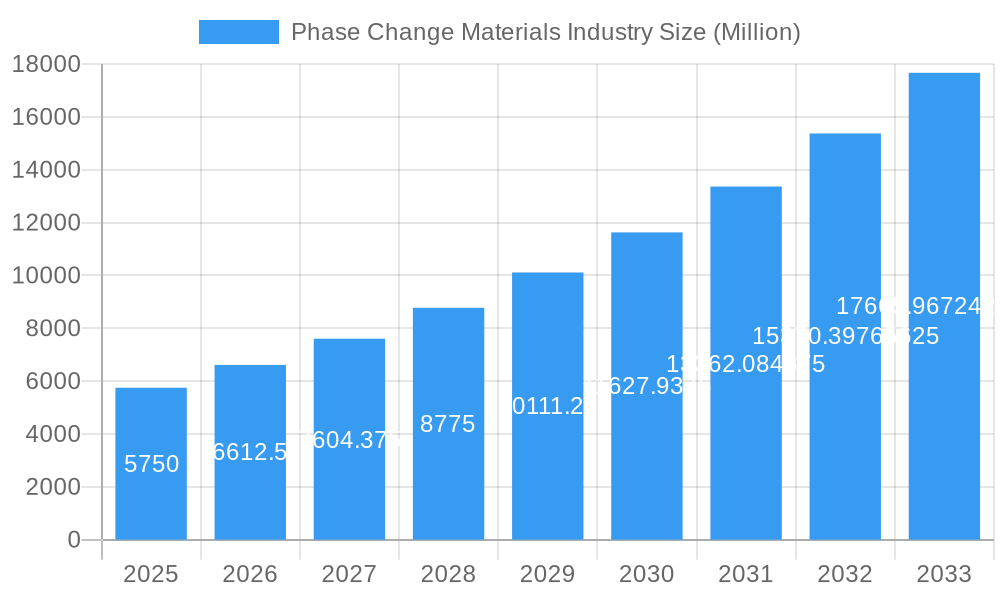
Phase Change Materials Industry Market Size (In Million)
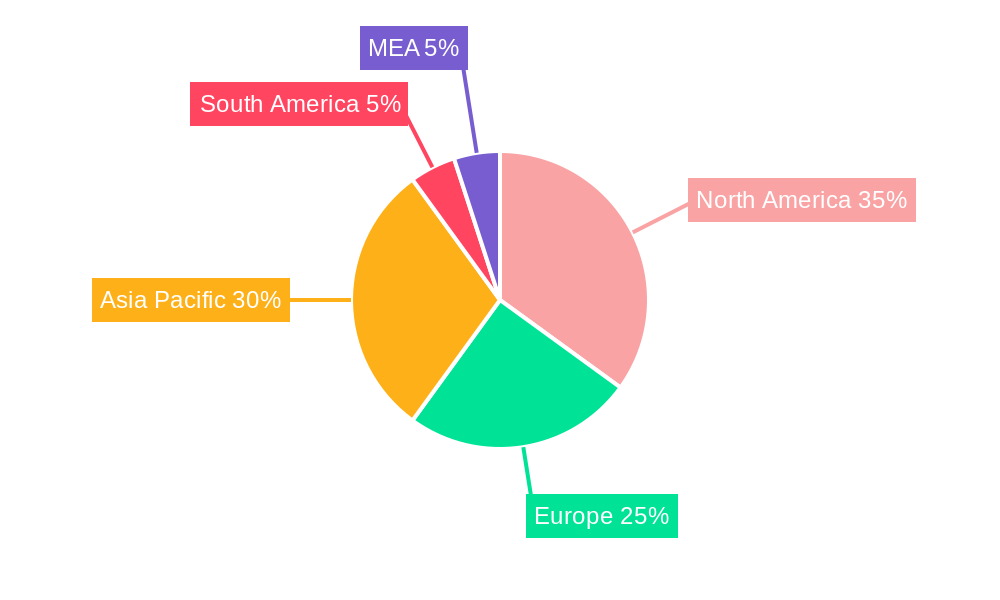
The building and construction sector currently dominates the market, with packaging and textiles following closely. However, the electronics and transportation sectors are anticipated to experience substantial PCM adoption growth, fueled by the industry's drive toward miniaturization and enhanced thermal performance. While initial investment costs and long-term stability concerns present challenges, continuous research and development are addressing these limitations, paving the way for broader market penetration. This growth trajectory is expected across all major regions, with North America and Asia Pacific leading due to strong industrial expansion and supportive government initiatives for energy efficiency.
Phase Change Materials Industry Company Market Share
The market size is projected to reach 729.76 million by 2025. Segmentation by product type (organic, inorganic, bio-based), encapsulation technology (macro, micro, molecular), and end-user industry presents diverse opportunities for market participants. Companies engaged in PCM manufacturing and application are expected to witness considerable revenue growth, encouraging further innovation and market expansion. A thorough competitive landscape analysis will highlight the varying strengths of players based on their product portfolios, technological expertise, and global presence.
Phase Change Materials (PCM) Industry Market Report: 2019-2033
This comprehensive report provides a detailed analysis of the Phase Change Materials (PCM) industry, encompassing market dynamics, growth trends, regional analysis, product landscape, key players, and future outlook. The study period covers 2019-2033, with a focus on the forecast period of 2025-2033 and a base year of 2025. The report segments the market by product type (organic, inorganic, bio-based), encapsulation technology (macro, micro, molecular), and end-user industry (building & construction, packaging, textiles, electronics, transportation, others). The global market size is projected at xx Million in 2025 and is expected to grow at a CAGR of xx% during the forecast period.
Phase Change Materials Industry Market Dynamics & Structure
The PCM market is characterized by moderate concentration, with several key players holding significant market share. Technological innovation, driven by the need for energy efficiency and sustainability, is a major growth driver. Regulatory frameworks promoting energy conservation and green building practices further influence market expansion. Competitive product substitutes, such as traditional insulation materials, pose a challenge, while the rise of bio-based PCMs presents a significant opportunity. M&A activity remains moderate, with xx deals recorded in the historical period (2019-2024), reflecting strategic consolidation within the industry. End-user demographics heavily influence demand, with the building and construction sector being the largest consumer.
- Market Concentration: Moderately concentrated, with the top 5 players holding approximately xx% market share in 2024.
- Technological Innovation: Focus on enhancing energy storage capacity, thermal conductivity, and cost-effectiveness.
- Regulatory Landscape: Growing emphasis on energy efficiency standards and green building codes fuels demand.
- Competitive Substitutes: Traditional insulation materials and other thermal management solutions.
- M&A Activity: xx deals during 2019-2024, driven by strategic expansion and technological acquisition.
- Innovation Barriers: High R&D costs, complexities in scaling up production, and challenges in material compatibility.
Phase Change Materials Industry Growth Trends & Insights
The PCM market has witnessed steady growth over the historical period (2019-2024), driven by increasing demand across diverse end-user sectors. Adoption rates are gradually increasing, particularly in energy-efficient buildings and advanced thermal management applications. Technological advancements, such as the development of novel encapsulation technologies and bio-based PCMs, are further accelerating market expansion. Shifting consumer preferences towards sustainable and energy-efficient solutions are fueling demand. The market size is projected to reach xx Million by 2033, signifying substantial growth potential. The CAGR for the forecast period (2025-2033) is estimated at xx%. Market penetration is expected to increase significantly across various segments.
Dominant Regions, Countries, or Segments in Phase Change Materials Industry
North America currently holds the largest market share, followed by Europe and Asia Pacific. Within product types, the organic PCM segment dominates due to its established market presence and wide range of applications. Micro-encapsulation technology is prevalent due to its superior thermal performance and versatility. The building and construction sector constitutes the largest end-user segment, driven by the increasing adoption of energy-efficient building designs and green building standards. Key drivers vary regionally. North America’s strong focus on energy efficiency and robust construction sector propels growth, while Asia Pacific's rapid urbanization and industrialization contribute significantly.
- Leading Region: North America (xx% market share in 2024).
- Leading Segment (Product Type): Organic PCMs (xx% market share in 2024).
- Leading Segment (Encapsulation Technology): Micro-encapsulation (xx% market share in 2024).
- Leading End-User Segment: Building & Construction (xx% market share in 2024).
- Key Drivers: Stringent energy efficiency regulations, increasing construction activities, rising disposable incomes, and growing awareness of sustainability.
Phase Change Materials Industry Product Landscape
The PCM industry offers a diverse range of products, tailored to specific applications and performance requirements. Product innovation focuses on improving thermal storage capacity, enhancing durability, and expanding the range of applications. Recent advancements include the development of bio-based PCMs, offering enhanced sustainability, and the use of advanced encapsulation technologies for improved performance. Unique selling propositions include energy efficiency, thermal comfort, and environmental benefits.
Key Drivers, Barriers & Challenges in Phase Change Materials Industry
Key Drivers:
- Growing demand for energy-efficient buildings and sustainable solutions.
- Increasing adoption of PCMs in diverse end-user industries.
- Technological advancements leading to improved performance and cost-effectiveness.
Key Challenges and Restraints:
- High initial investment costs associated with PCM integration.
- Supply chain disruptions affecting the availability of raw materials.
- Lack of awareness and understanding of PCM technology among potential users.
Emerging Opportunities in Phase Change Materials Industry
- Expanding applications in the electronics and transportation sectors.
- Growing demand for bio-based and sustainable PCMs.
- Development of novel PCM formulations with enhanced performance characteristics.
Growth Accelerators in the Phase Change Materials Industry Industry
Technological breakthroughs, particularly in encapsulation technologies and bio-based PCM development, are key growth drivers. Strategic partnerships between PCM manufacturers and end-user industries, such as collaborations with building material companies, are further accelerating market expansion. Government initiatives promoting energy efficiency and sustainable solutions provide significant impetus. Market expansion into emerging economies with growing infrastructure development presents substantial opportunities.
Key Players Shaping the Phase Change Materials Industry Market
- Appvion Inc
- Henkel AG & Co KGaA
- Shin-Etsu Chemical Co Ltd
- Rubitherm Technologies GmbH
- Cryopak
- Microtek Laboratories Inc
- Croda International Plc
- Outlast Technologies LLC
- Entropy Solution
- Shenzhen Aochuan Technology Co Ltd
- Laird Technologies
- National Gypsum Services Company
- Parker Hannifin Corp
Notable Milestones in Phase Change Materials Industry Sector
- October 2022: Shanghai Polytechnic University researchers announced the development of a new efficient phase change microcapsule for storing solar energy.
- September 2022: Sinomax USA launched the first bio-based phase change material in foam bedding ("Bio Frost").
In-Depth Phase Change Materials Industry Market Outlook
The PCM market is poised for significant growth over the forecast period, driven by continuous technological advancements, increasing demand across diverse sectors, and supportive regulatory frameworks. Strategic partnerships, market expansion into emerging economies, and the growing focus on sustainability will further accelerate market expansion. The market presents lucrative opportunities for companies with innovative products and strategic market entry strategies.
Phase Change Materials Industry Segmentation
-
1. Product Type
- 1.1. Organic
- 1.2. Inorganic
- 1.3. Bio-based
-
2. Encapsulation Technology
- 2.1. Macro
- 2.2. Micro
- 2.3. Molecular
-
3. End-user Industry
- 3.1. Building and Construction
- 3.2. Packaging
- 3.3. Textiles
- 3.4. Electronics
- 3.5. Transportation
- 3.6. Other End-user Industries
Phase Change Materials Industry Segmentation By Geography
-
1. Asia Pacific
- 1.1. China
- 1.2. India
- 1.3. Japan
- 1.4. South Korea
- 1.5. Rest of Asia Pacific
-
2. North America
- 2.1. United States
- 2.2. Canada
- 2.3. Mexico
-
3. Europe
- 3.1. Germany
- 3.2. United Kingdom
- 3.3. Italy
- 3.4. France
- 3.5. Rest of Europe
-
4. Rest of the World
- 4.1. Brazil
- 4.2. Saudi Arabia
- 4.3. South Africa
- 4.4. Other Countries
Phase Change Materials Industry Regional Market Share
Geographic Coverage of Phase Change Materials Industry
Phase Change Materials Industry REPORT HIGHLIGHTS
| Aspects | Details |
|---|---|
| Study Period | 2020-2034 |
| Base Year | 2025 |
| Estimated Year | 2026 |
| Forecast Period | 2026-2034 |
| Historical Period | 2020-2025 |
| Growth Rate | CAGR of 17.58% from 2020-2034 |
| Segmentation |
|
Table of Contents
- 1. Introduction
- 1.1. Research Scope
- 1.2. Market Segmentation
- 1.3. Research Objective
- 1.4. Definitions and Assumptions
- 2. Executive Summary
- 2.1. Market Snapshot
- 3. Market Dynamics
- 3.1. Market Drivers
- 3.2. Market Restrains
- 3.3. Market Trends
- 3.4. Market Opportunities
- 4. Market Factor Analysis
- 4.1. Porters Five Forces
- 4.1.1. Bargaining Power of Suppliers
- 4.1.2. Bargaining Power of Buyers
- 4.1.3. Threat of New Entrants
- 4.1.4. Threat of Substitutes
- 4.1.5. Competitive Rivalry
- 4.2. PESTEL analysis
- 4.3. BCG Analysis
- 4.3.1. Stars (High Growth, High Market Share)
- 4.3.2. Cash Cows (Low Growth, High Market Share)
- 4.3.3. Question Mark (High Growth, Low Market Share)
- 4.3.4. Dogs (Low Growth, Low Market Share)
- 4.4. Ansoff Matrix Analysis
- 4.5. Supply Chain Analysis
- 4.6. Regulatory Landscape
- 4.7. Current Market Potential and Opportunity Assessment (TAM–SAM–SOM Framework)
- 4.8. VDR Analyst Note
- 4.1. Porters Five Forces
- 5. Market Analysis, Insights and Forecast 2021-2033
- 5.1. Market Analysis, Insights and Forecast - by Product Type
- 5.1.1. Organic
- 5.1.2. Inorganic
- 5.1.3. Bio-based
- 5.2. Market Analysis, Insights and Forecast - by Encapsulation Technology
- 5.2.1. Macro
- 5.2.2. Micro
- 5.2.3. Molecular
- 5.3. Market Analysis, Insights and Forecast - by End-user Industry
- 5.3.1. Building and Construction
- 5.3.2. Packaging
- 5.3.3. Textiles
- 5.3.4. Electronics
- 5.3.5. Transportation
- 5.3.6. Other End-user Industries
- 5.4. Market Analysis, Insights and Forecast - by Region
- 5.4.1. Asia Pacific
- 5.4.2. North America
- 5.4.3. Europe
- 5.4.4. Rest of the World
- 5.1. Market Analysis, Insights and Forecast - by Product Type
- 6. Global Phase Change Materials Industry Analysis, Insights and Forecast, 2021-2033
- 6.1. Market Analysis, Insights and Forecast - by Product Type
- 6.1.1. Organic
- 6.1.2. Inorganic
- 6.1.3. Bio-based
- 6.2. Market Analysis, Insights and Forecast - by Encapsulation Technology
- 6.2.1. Macro
- 6.2.2. Micro
- 6.2.3. Molecular
- 6.3. Market Analysis, Insights and Forecast - by End-user Industry
- 6.3.1. Building and Construction
- 6.3.2. Packaging
- 6.3.3. Textiles
- 6.3.4. Electronics
- 6.3.5. Transportation
- 6.3.6. Other End-user Industries
- 6.1. Market Analysis, Insights and Forecast - by Product Type
- 7. Asia Pacific Phase Change Materials Industry Analysis, Insights and Forecast, 2021-2033
- 7.1. Market Analysis, Insights and Forecast - by Product Type
- 7.1.1. Organic
- 7.1.2. Inorganic
- 7.1.3. Bio-based
- 7.2. Market Analysis, Insights and Forecast - by Encapsulation Technology
- 7.2.1. Macro
- 7.2.2. Micro
- 7.2.3. Molecular
- 7.3. Market Analysis, Insights and Forecast - by End-user Industry
- 7.3.1. Building and Construction
- 7.3.2. Packaging
- 7.3.3. Textiles
- 7.3.4. Electronics
- 7.3.5. Transportation
- 7.3.6. Other End-user Industries
- 7.1. Market Analysis, Insights and Forecast - by Product Type
- 8. North America Phase Change Materials Industry Analysis, Insights and Forecast, 2021-2033
- 8.1. Market Analysis, Insights and Forecast - by Product Type
- 8.1.1. Organic
- 8.1.2. Inorganic
- 8.1.3. Bio-based
- 8.2. Market Analysis, Insights and Forecast - by Encapsulation Technology
- 8.2.1. Macro
- 8.2.2. Micro
- 8.2.3. Molecular
- 8.3. Market Analysis, Insights and Forecast - by End-user Industry
- 8.3.1. Building and Construction
- 8.3.2. Packaging
- 8.3.3. Textiles
- 8.3.4. Electronics
- 8.3.5. Transportation
- 8.3.6. Other End-user Industries
- 8.1. Market Analysis, Insights and Forecast - by Product Type
- 9. Europe Phase Change Materials Industry Analysis, Insights and Forecast, 2021-2033
- 9.1. Market Analysis, Insights and Forecast - by Product Type
- 9.1.1. Organic
- 9.1.2. Inorganic
- 9.1.3. Bio-based
- 9.2. Market Analysis, Insights and Forecast - by Encapsulation Technology
- 9.2.1. Macro
- 9.2.2. Micro
- 9.2.3. Molecular
- 9.3. Market Analysis, Insights and Forecast - by End-user Industry
- 9.3.1. Building and Construction
- 9.3.2. Packaging
- 9.3.3. Textiles
- 9.3.4. Electronics
- 9.3.5. Transportation
- 9.3.6. Other End-user Industries
- 9.1. Market Analysis, Insights and Forecast - by Product Type
- 10. Rest of the World Phase Change Materials Industry Analysis, Insights and Forecast, 2021-2033
- 10.1. Market Analysis, Insights and Forecast - by Product Type
- 10.1.1. Organic
- 10.1.2. Inorganic
- 10.1.3. Bio-based
- 10.2. Market Analysis, Insights and Forecast - by Encapsulation Technology
- 10.2.1. Macro
- 10.2.2. Micro
- 10.2.3. Molecular
- 10.3. Market Analysis, Insights and Forecast - by End-user Industry
- 10.3.1. Building and Construction
- 10.3.2. Packaging
- 10.3.3. Textiles
- 10.3.4. Electronics
- 10.3.5. Transportation
- 10.3.6. Other End-user Industries
- 10.1. Market Analysis, Insights and Forecast - by Product Type
- 11. Competitive Analysis
- 11.1. Company Profiles
- 11.1.1 Appvion Inc
- 11.1.1.1. Company Overview
- 11.1.1.2. Products
- 11.1.1.3. Company Financials
- 11.1.1.4. SWOT Analysis
- 11.1.2 Henkel AG & Co KGAA
- 11.1.2.1. Company Overview
- 11.1.2.2. Products
- 11.1.2.3. Company Financials
- 11.1.2.4. SWOT Analysis
- 11.1.3 Shin-Etsu Chemical Co Ltd
- 11.1.3.1. Company Overview
- 11.1.3.2. Products
- 11.1.3.3. Company Financials
- 11.1.3.4. SWOT Analysis
- 11.1.4 Rubitherm Technologies GmbH
- 11.1.4.1. Company Overview
- 11.1.4.2. Products
- 11.1.4.3. Company Financials
- 11.1.4.4. SWOT Analysis
- 11.1.5 Cryopak
- 11.1.5.1. Company Overview
- 11.1.5.2. Products
- 11.1.5.3. Company Financials
- 11.1.5.4. SWOT Analysis
- 11.1.6 Microtek Laboratories Inc
- 11.1.6.1. Company Overview
- 11.1.6.2. Products
- 11.1.6.3. Company Financials
- 11.1.6.4. SWOT Analysis
- 11.1.7 Croda International Plc
- 11.1.7.1. Company Overview
- 11.1.7.2. Products
- 11.1.7.3. Company Financials
- 11.1.7.4. SWOT Analysis
- 11.1.8 Outlast Technologies LLC
- 11.1.8.1. Company Overview
- 11.1.8.2. Products
- 11.1.8.3. Company Financials
- 11.1.8.4. SWOT Analysis
- 11.1.9 Entropy Solution
- 11.1.9.1. Company Overview
- 11.1.9.2. Products
- 11.1.9.3. Company Financials
- 11.1.9.4. SWOT Analysis
- 11.1.10 Shenzhen Aochuan Technology Co Ltd
- 11.1.10.1. Company Overview
- 11.1.10.2. Products
- 11.1.10.3. Company Financials
- 11.1.10.4. SWOT Analysis
- 11.1.11 Laird Technologies
- 11.1.11.1. Company Overview
- 11.1.11.2. Products
- 11.1.11.3. Company Financials
- 11.1.11.4. SWOT Analysis
- 11.1.12 National Gypsum Services Company
- 11.1.12.1. Company Overview
- 11.1.12.2. Products
- 11.1.12.3. Company Financials
- 11.1.12.4. SWOT Analysis
- 11.1.13 Parker Hannifin Corp
- 11.1.13.1. Company Overview
- 11.1.13.2. Products
- 11.1.13.3. Company Financials
- 11.1.13.4. SWOT Analysis
- 11.1.1 Appvion Inc
- 11.2. Market Entropy
- 11.2.1 Company's Key Areas Served
- 11.2.2 Recent Developments
- 11.3. Company Market Share Analysis 2025
- 11.3.1 Top 5 Companies Market Share Analysis
- 11.3.2 Top 3 Companies Market Share Analysis
- 11.4. List of Potential Customers
- 12. Research Methodology
List of Figures
- Figure 1: Global Phase Change Materials Industry Revenue Breakdown (million, %) by Region 2025 & 2033
- Figure 2: Global Phase Change Materials Industry Volume Breakdown (K Tons, %) by Region 2025 & 2033
- Figure 3: Asia Pacific Phase Change Materials Industry Revenue (million), by Product Type 2025 & 2033
- Figure 4: Asia Pacific Phase Change Materials Industry Volume (K Tons), by Product Type 2025 & 2033
- Figure 5: Asia Pacific Phase Change Materials Industry Revenue Share (%), by Product Type 2025 & 2033
- Figure 6: Asia Pacific Phase Change Materials Industry Volume Share (%), by Product Type 2025 & 2033
- Figure 7: Asia Pacific Phase Change Materials Industry Revenue (million), by Encapsulation Technology 2025 & 2033
- Figure 8: Asia Pacific Phase Change Materials Industry Volume (K Tons), by Encapsulation Technology 2025 & 2033
- Figure 9: Asia Pacific Phase Change Materials Industry Revenue Share (%), by Encapsulation Technology 2025 & 2033
- Figure 10: Asia Pacific Phase Change Materials Industry Volume Share (%), by Encapsulation Technology 2025 & 2033
- Figure 11: Asia Pacific Phase Change Materials Industry Revenue (million), by End-user Industry 2025 & 2033
- Figure 12: Asia Pacific Phase Change Materials Industry Volume (K Tons), by End-user Industry 2025 & 2033
- Figure 13: Asia Pacific Phase Change Materials Industry Revenue Share (%), by End-user Industry 2025 & 2033
- Figure 14: Asia Pacific Phase Change Materials Industry Volume Share (%), by End-user Industry 2025 & 2033
- Figure 15: Asia Pacific Phase Change Materials Industry Revenue (million), by Country 2025 & 2033
- Figure 16: Asia Pacific Phase Change Materials Industry Volume (K Tons), by Country 2025 & 2033
- Figure 17: Asia Pacific Phase Change Materials Industry Revenue Share (%), by Country 2025 & 2033
- Figure 18: Asia Pacific Phase Change Materials Industry Volume Share (%), by Country 2025 & 2033
- Figure 19: North America Phase Change Materials Industry Revenue (million), by Product Type 2025 & 2033
- Figure 20: North America Phase Change Materials Industry Volume (K Tons), by Product Type 2025 & 2033
- Figure 21: North America Phase Change Materials Industry Revenue Share (%), by Product Type 2025 & 2033
- Figure 22: North America Phase Change Materials Industry Volume Share (%), by Product Type 2025 & 2033
- Figure 23: North America Phase Change Materials Industry Revenue (million), by Encapsulation Technology 2025 & 2033
- Figure 24: North America Phase Change Materials Industry Volume (K Tons), by Encapsulation Technology 2025 & 2033
- Figure 25: North America Phase Change Materials Industry Revenue Share (%), by Encapsulation Technology 2025 & 2033
- Figure 26: North America Phase Change Materials Industry Volume Share (%), by Encapsulation Technology 2025 & 2033
- Figure 27: North America Phase Change Materials Industry Revenue (million), by End-user Industry 2025 & 2033
- Figure 28: North America Phase Change Materials Industry Volume (K Tons), by End-user Industry 2025 & 2033
- Figure 29: North America Phase Change Materials Industry Revenue Share (%), by End-user Industry 2025 & 2033
- Figure 30: North America Phase Change Materials Industry Volume Share (%), by End-user Industry 2025 & 2033
- Figure 31: North America Phase Change Materials Industry Revenue (million), by Country 2025 & 2033
- Figure 32: North America Phase Change Materials Industry Volume (K Tons), by Country 2025 & 2033
- Figure 33: North America Phase Change Materials Industry Revenue Share (%), by Country 2025 & 2033
- Figure 34: North America Phase Change Materials Industry Volume Share (%), by Country 2025 & 2033
- Figure 35: Europe Phase Change Materials Industry Revenue (million), by Product Type 2025 & 2033
- Figure 36: Europe Phase Change Materials Industry Volume (K Tons), by Product Type 2025 & 2033
- Figure 37: Europe Phase Change Materials Industry Revenue Share (%), by Product Type 2025 & 2033
- Figure 38: Europe Phase Change Materials Industry Volume Share (%), by Product Type 2025 & 2033
- Figure 39: Europe Phase Change Materials Industry Revenue (million), by Encapsulation Technology 2025 & 2033
- Figure 40: Europe Phase Change Materials Industry Volume (K Tons), by Encapsulation Technology 2025 & 2033
- Figure 41: Europe Phase Change Materials Industry Revenue Share (%), by Encapsulation Technology 2025 & 2033
- Figure 42: Europe Phase Change Materials Industry Volume Share (%), by Encapsulation Technology 2025 & 2033
- Figure 43: Europe Phase Change Materials Industry Revenue (million), by End-user Industry 2025 & 2033
- Figure 44: Europe Phase Change Materials Industry Volume (K Tons), by End-user Industry 2025 & 2033
- Figure 45: Europe Phase Change Materials Industry Revenue Share (%), by End-user Industry 2025 & 2033
- Figure 46: Europe Phase Change Materials Industry Volume Share (%), by End-user Industry 2025 & 2033
- Figure 47: Europe Phase Change Materials Industry Revenue (million), by Country 2025 & 2033
- Figure 48: Europe Phase Change Materials Industry Volume (K Tons), by Country 2025 & 2033
- Figure 49: Europe Phase Change Materials Industry Revenue Share (%), by Country 2025 & 2033
- Figure 50: Europe Phase Change Materials Industry Volume Share (%), by Country 2025 & 2033
- Figure 51: Rest of the World Phase Change Materials Industry Revenue (million), by Product Type 2025 & 2033
- Figure 52: Rest of the World Phase Change Materials Industry Volume (K Tons), by Product Type 2025 & 2033
- Figure 53: Rest of the World Phase Change Materials Industry Revenue Share (%), by Product Type 2025 & 2033
- Figure 54: Rest of the World Phase Change Materials Industry Volume Share (%), by Product Type 2025 & 2033
- Figure 55: Rest of the World Phase Change Materials Industry Revenue (million), by Encapsulation Technology 2025 & 2033
- Figure 56: Rest of the World Phase Change Materials Industry Volume (K Tons), by Encapsulation Technology 2025 & 2033
- Figure 57: Rest of the World Phase Change Materials Industry Revenue Share (%), by Encapsulation Technology 2025 & 2033
- Figure 58: Rest of the World Phase Change Materials Industry Volume Share (%), by Encapsulation Technology 2025 & 2033
- Figure 59: Rest of the World Phase Change Materials Industry Revenue (million), by End-user Industry 2025 & 2033
- Figure 60: Rest of the World Phase Change Materials Industry Volume (K Tons), by End-user Industry 2025 & 2033
- Figure 61: Rest of the World Phase Change Materials Industry Revenue Share (%), by End-user Industry 2025 & 2033
- Figure 62: Rest of the World Phase Change Materials Industry Volume Share (%), by End-user Industry 2025 & 2033
- Figure 63: Rest of the World Phase Change Materials Industry Revenue (million), by Country 2025 & 2033
- Figure 64: Rest of the World Phase Change Materials Industry Volume (K Tons), by Country 2025 & 2033
- Figure 65: Rest of the World Phase Change Materials Industry Revenue Share (%), by Country 2025 & 2033
- Figure 66: Rest of the World Phase Change Materials Industry Volume Share (%), by Country 2025 & 2033
List of Tables
- Table 1: Global Phase Change Materials Industry Revenue million Forecast, by Product Type 2020 & 2033
- Table 2: Global Phase Change Materials Industry Volume K Tons Forecast, by Product Type 2020 & 2033
- Table 3: Global Phase Change Materials Industry Revenue million Forecast, by Encapsulation Technology 2020 & 2033
- Table 4: Global Phase Change Materials Industry Volume K Tons Forecast, by Encapsulation Technology 2020 & 2033
- Table 5: Global Phase Change Materials Industry Revenue million Forecast, by End-user Industry 2020 & 2033
- Table 6: Global Phase Change Materials Industry Volume K Tons Forecast, by End-user Industry 2020 & 2033
- Table 7: Global Phase Change Materials Industry Revenue million Forecast, by Region 2020 & 2033
- Table 8: Global Phase Change Materials Industry Volume K Tons Forecast, by Region 2020 & 2033
- Table 9: Global Phase Change Materials Industry Revenue million Forecast, by Product Type 2020 & 2033
- Table 10: Global Phase Change Materials Industry Volume K Tons Forecast, by Product Type 2020 & 2033
- Table 11: Global Phase Change Materials Industry Revenue million Forecast, by Encapsulation Technology 2020 & 2033
- Table 12: Global Phase Change Materials Industry Volume K Tons Forecast, by Encapsulation Technology 2020 & 2033
- Table 13: Global Phase Change Materials Industry Revenue million Forecast, by End-user Industry 2020 & 2033
- Table 14: Global Phase Change Materials Industry Volume K Tons Forecast, by End-user Industry 2020 & 2033
- Table 15: Global Phase Change Materials Industry Revenue million Forecast, by Country 2020 & 2033
- Table 16: Global Phase Change Materials Industry Volume K Tons Forecast, by Country 2020 & 2033
- Table 17: China Phase Change Materials Industry Revenue (million) Forecast, by Application 2020 & 2033
- Table 18: China Phase Change Materials Industry Volume (K Tons) Forecast, by Application 2020 & 2033
- Table 19: India Phase Change Materials Industry Revenue (million) Forecast, by Application 2020 & 2033
- Table 20: India Phase Change Materials Industry Volume (K Tons) Forecast, by Application 2020 & 2033
- Table 21: Japan Phase Change Materials Industry Revenue (million) Forecast, by Application 2020 & 2033
- Table 22: Japan Phase Change Materials Industry Volume (K Tons) Forecast, by Application 2020 & 2033
- Table 23: South Korea Phase Change Materials Industry Revenue (million) Forecast, by Application 2020 & 2033
- Table 24: South Korea Phase Change Materials Industry Volume (K Tons) Forecast, by Application 2020 & 2033
- Table 25: Rest of Asia Pacific Phase Change Materials Industry Revenue (million) Forecast, by Application 2020 & 2033
- Table 26: Rest of Asia Pacific Phase Change Materials Industry Volume (K Tons) Forecast, by Application 2020 & 2033
- Table 27: Global Phase Change Materials Industry Revenue million Forecast, by Product Type 2020 & 2033
- Table 28: Global Phase Change Materials Industry Volume K Tons Forecast, by Product Type 2020 & 2033
- Table 29: Global Phase Change Materials Industry Revenue million Forecast, by Encapsulation Technology 2020 & 2033
- Table 30: Global Phase Change Materials Industry Volume K Tons Forecast, by Encapsulation Technology 2020 & 2033
- Table 31: Global Phase Change Materials Industry Revenue million Forecast, by End-user Industry 2020 & 2033
- Table 32: Global Phase Change Materials Industry Volume K Tons Forecast, by End-user Industry 2020 & 2033
- Table 33: Global Phase Change Materials Industry Revenue million Forecast, by Country 2020 & 2033
- Table 34: Global Phase Change Materials Industry Volume K Tons Forecast, by Country 2020 & 2033
- Table 35: United States Phase Change Materials Industry Revenue (million) Forecast, by Application 2020 & 2033
- Table 36: United States Phase Change Materials Industry Volume (K Tons) Forecast, by Application 2020 & 2033
- Table 37: Canada Phase Change Materials Industry Revenue (million) Forecast, by Application 2020 & 2033
- Table 38: Canada Phase Change Materials Industry Volume (K Tons) Forecast, by Application 2020 & 2033
- Table 39: Mexico Phase Change Materials Industry Revenue (million) Forecast, by Application 2020 & 2033
- Table 40: Mexico Phase Change Materials Industry Volume (K Tons) Forecast, by Application 2020 & 2033
- Table 41: Global Phase Change Materials Industry Revenue million Forecast, by Product Type 2020 & 2033
- Table 42: Global Phase Change Materials Industry Volume K Tons Forecast, by Product Type 2020 & 2033
- Table 43: Global Phase Change Materials Industry Revenue million Forecast, by Encapsulation Technology 2020 & 2033
- Table 44: Global Phase Change Materials Industry Volume K Tons Forecast, by Encapsulation Technology 2020 & 2033
- Table 45: Global Phase Change Materials Industry Revenue million Forecast, by End-user Industry 2020 & 2033
- Table 46: Global Phase Change Materials Industry Volume K Tons Forecast, by End-user Industry 2020 & 2033
- Table 47: Global Phase Change Materials Industry Revenue million Forecast, by Country 2020 & 2033
- Table 48: Global Phase Change Materials Industry Volume K Tons Forecast, by Country 2020 & 2033
- Table 49: Germany Phase Change Materials Industry Revenue (million) Forecast, by Application 2020 & 2033
- Table 50: Germany Phase Change Materials Industry Volume (K Tons) Forecast, by Application 2020 & 2033
- Table 51: United Kingdom Phase Change Materials Industry Revenue (million) Forecast, by Application 2020 & 2033
- Table 52: United Kingdom Phase Change Materials Industry Volume (K Tons) Forecast, by Application 2020 & 2033
- Table 53: Italy Phase Change Materials Industry Revenue (million) Forecast, by Application 2020 & 2033
- Table 54: Italy Phase Change Materials Industry Volume (K Tons) Forecast, by Application 2020 & 2033
- Table 55: France Phase Change Materials Industry Revenue (million) Forecast, by Application 2020 & 2033
- Table 56: France Phase Change Materials Industry Volume (K Tons) Forecast, by Application 2020 & 2033
- Table 57: Rest of Europe Phase Change Materials Industry Revenue (million) Forecast, by Application 2020 & 2033
- Table 58: Rest of Europe Phase Change Materials Industry Volume (K Tons) Forecast, by Application 2020 & 2033
- Table 59: Global Phase Change Materials Industry Revenue million Forecast, by Product Type 2020 & 2033
- Table 60: Global Phase Change Materials Industry Volume K Tons Forecast, by Product Type 2020 & 2033
- Table 61: Global Phase Change Materials Industry Revenue million Forecast, by Encapsulation Technology 2020 & 2033
- Table 62: Global Phase Change Materials Industry Volume K Tons Forecast, by Encapsulation Technology 2020 & 2033
- Table 63: Global Phase Change Materials Industry Revenue million Forecast, by End-user Industry 2020 & 2033
- Table 64: Global Phase Change Materials Industry Volume K Tons Forecast, by End-user Industry 2020 & 2033
- Table 65: Global Phase Change Materials Industry Revenue million Forecast, by Country 2020 & 2033
- Table 66: Global Phase Change Materials Industry Volume K Tons Forecast, by Country 2020 & 2033
- Table 67: Brazil Phase Change Materials Industry Revenue (million) Forecast, by Application 2020 & 2033
- Table 68: Brazil Phase Change Materials Industry Volume (K Tons) Forecast, by Application 2020 & 2033
- Table 69: Saudi Arabia Phase Change Materials Industry Revenue (million) Forecast, by Application 2020 & 2033
- Table 70: Saudi Arabia Phase Change Materials Industry Volume (K Tons) Forecast, by Application 2020 & 2033
- Table 71: South Africa Phase Change Materials Industry Revenue (million) Forecast, by Application 2020 & 2033
- Table 72: South Africa Phase Change Materials Industry Volume (K Tons) Forecast, by Application 2020 & 2033
- Table 73: Other Countries Phase Change Materials Industry Revenue (million) Forecast, by Application 2020 & 2033
- Table 74: Other Countries Phase Change Materials Industry Volume (K Tons) Forecast, by Application 2020 & 2033
Frequently Asked Questions
1. What is the projected Compound Annual Growth Rate (CAGR) of the Phase Change Materials Industry?
The projected CAGR is approximately 17.58%.
2. Which companies are prominent players in the Phase Change Materials Industry?
Key companies in the market include Appvion Inc, Henkel AG & Co KGAA, Shin-Etsu Chemical Co Ltd, Rubitherm Technologies GmbH, Cryopak, Microtek Laboratories Inc, Croda International Plc, Outlast Technologies LLC, Entropy Solution, Shenzhen Aochuan Technology Co Ltd, Laird Technologies, National Gypsum Services Company, Parker Hannifin Corp.
3. What are the main segments of the Phase Change Materials Industry?
The market segments include Product Type, Encapsulation Technology, End-user Industry.
4. Can you provide details about the market size?
The market size is estimated to be USD 729.76 million as of 2022.
5. What are some drivers contributing to market growth?
Expanding Global Trend Towards Energy Conservation and Sustainable Development; Other Drivers.
6. What are the notable trends driving market growth?
Building and Construction Industry to Dominate the Market.
7. Are there any restraints impacting market growth?
Hazardous Nature of Phase Change Materials; Other Restraints.
8. Can you provide examples of recent developments in the market?
October 2022: Shanghai Polytechnic University researchers announced the development of a new efficient phase change microcapsules for storing solar energy. The newly designed microcapsule demonstrated enhanced heat transfer, storage properties, and high-performance photothermal conversion.
9. What pricing options are available for accessing the report?
Pricing options include single-user, multi-user, and enterprise licenses priced at USD 4750, USD 5250, and USD 8750 respectively.
10. Is the market size provided in terms of value or volume?
The market size is provided in terms of value, measured in million and volume, measured in K Tons.
11. Are there any specific market keywords associated with the report?
Yes, the market keyword associated with the report is "Phase Change Materials Industry," which aids in identifying and referencing the specific market segment covered.
12. How do I determine which pricing option suits my needs best?
The pricing options vary based on user requirements and access needs. Individual users may opt for single-user licenses, while businesses requiring broader access may choose multi-user or enterprise licenses for cost-effective access to the report.
13. Are there any additional resources or data provided in the Phase Change Materials Industry report?
While the report offers comprehensive insights, it's advisable to review the specific contents or supplementary materials provided to ascertain if additional resources or data are available.
14. How can I stay updated on further developments or reports in the Phase Change Materials Industry?
To stay informed about further developments, trends, and reports in the Phase Change Materials Industry, consider subscribing to industry newsletters, following relevant companies and organizations, or regularly checking reputable industry news sources and publications.
Methodology
Step 1 - Identification of Relevant Samples Size from Population Database


Step 2 - Approaches for Defining Global Market Size (Value, Volume* & Price*)

Note*: In applicable scenarios
Step 3 - Data Sources
Primary Research
- Web Analytics
- Survey Reports
- Research Institute
- Latest Research Reports
- Opinion Leaders
Secondary Research
- Annual Reports
- White Paper
- Latest Press Release
- Industry Association
- Paid Database
- Investor Presentations

Step 4 - Data Triangulation
Involves using different sources of information in order to increase the validity of a study
These sources are likely to be stakeholders in a program - participants, other researchers, program staff, other community members, and so on.
Then we put all data in single framework & apply various statistical tools to find out the dynamic on the market.
During the analysis stage, feedback from the stakeholder groups would be compared to determine areas of agreement as well as areas of divergence